
Organic Pigments Market Size and Share
Market Overview
| Study Period | 2021 - 2031 |
|---|---|
| Market Volume (2026) | 757.84 kilotons |
| Market Volume (2031) | 889.69 kilotons |
| Growth Rate (2026 - 2031) | 3.26 % |
| Fastest Growing Market | Asia Pacific |
| Largest Market | Asia Pacific |
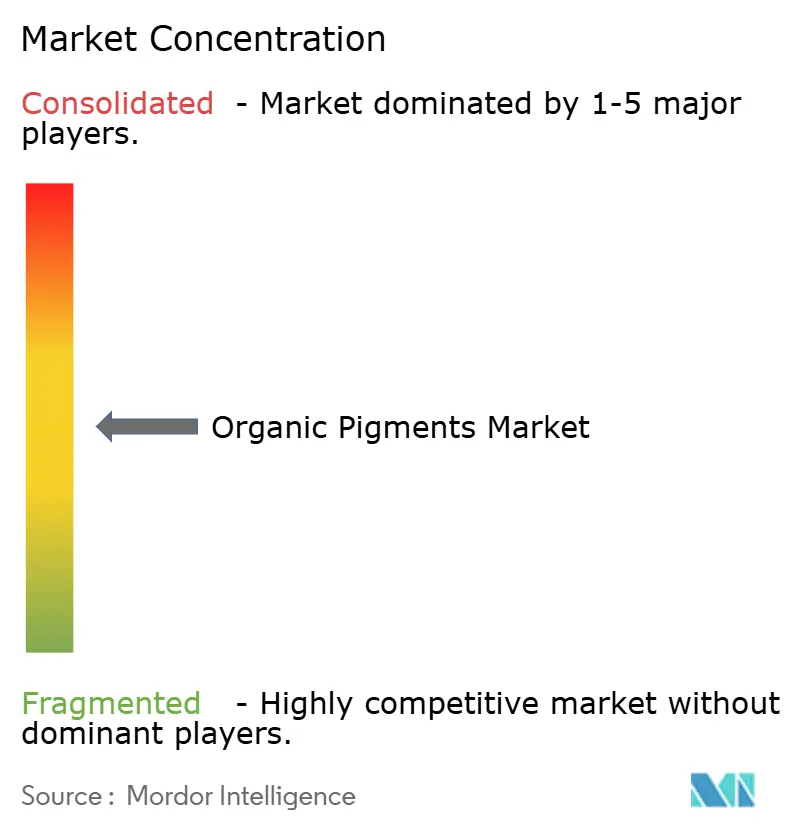
| Market Concentration | Medium |
Major Players *Disclaimer: Major Players sorted in no particular order Image © Mordor Intelligence. Reuse requires attribution under CC BY 4.0. | |

Organic Pigments Market Analysis by Mordor Intelligence
The Organic Pigments Market size is estimated at 757.84 kilotons in 2026, and is expected to reach 889.69 kilotons by 2031, at a CAGR of 3.26% during the forecast period (2026-2031). The expansion of the organic pigments market is powered by Asia-Pacific’s rapidly urbanizing economies, sustained e-commerce growth that lifts flexible-packaging inks, and the automotive sector’s shift to quinacridone grades that survive decade-long weathering tests. Printing-ink formulators are moving toward high-consistency dispersions compatible with AI-driven color-matching platforms, while brand owners in Europe and North America prefer bio-based options that comply with microplastics rules. Feedstock volatility and tighter hazard-communication laws add cost pressure, yet continuous-flow reactors and cloud-based formulation tools protect margins by cutting waste and cycle times. Competitive focus is migrating from commodity color strength to data-enabled services that guarantee first-time-right shades on any substrate.
Key Report Takeaways
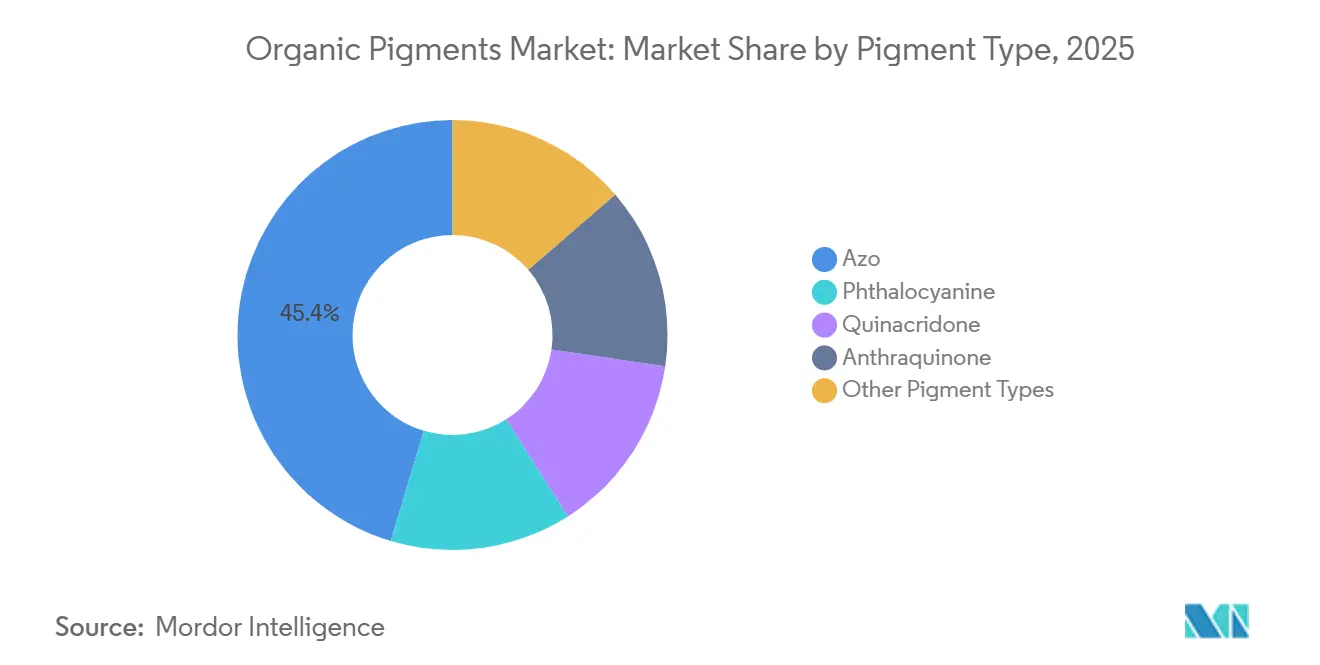
- By pigment type, azo grades held 45.36% of the organic pigments market share in 2025, whereas quinacridone variants are set to post the fastest 4.43% CAGR through 2031.
- By source, synthetic routes commanded 88.47% of the organic pigments market size in 2025, while natural and bio-based alternatives are forecast to expand at a 4.31% CAGR to 2031.
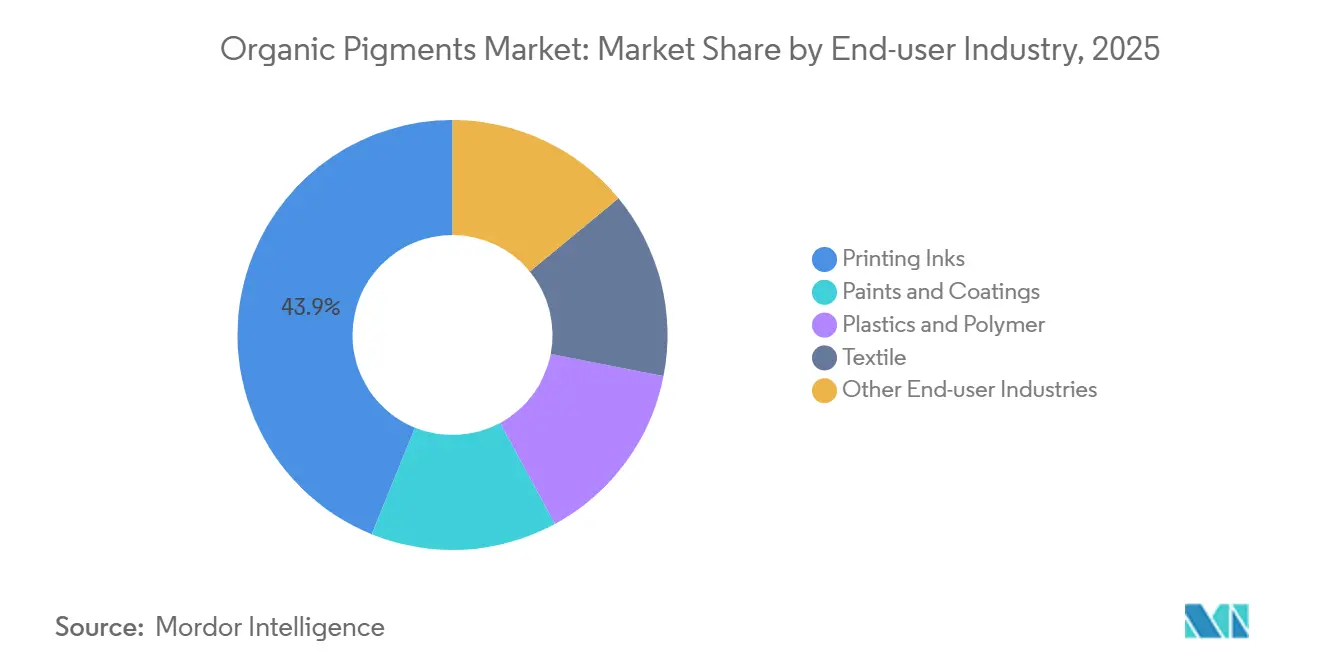
- By end-user industry, printing inks accounted for 43.88% of the organic pigments market size in 2025; the textile segment is advancing at a 4.39% CAGR through 2031.
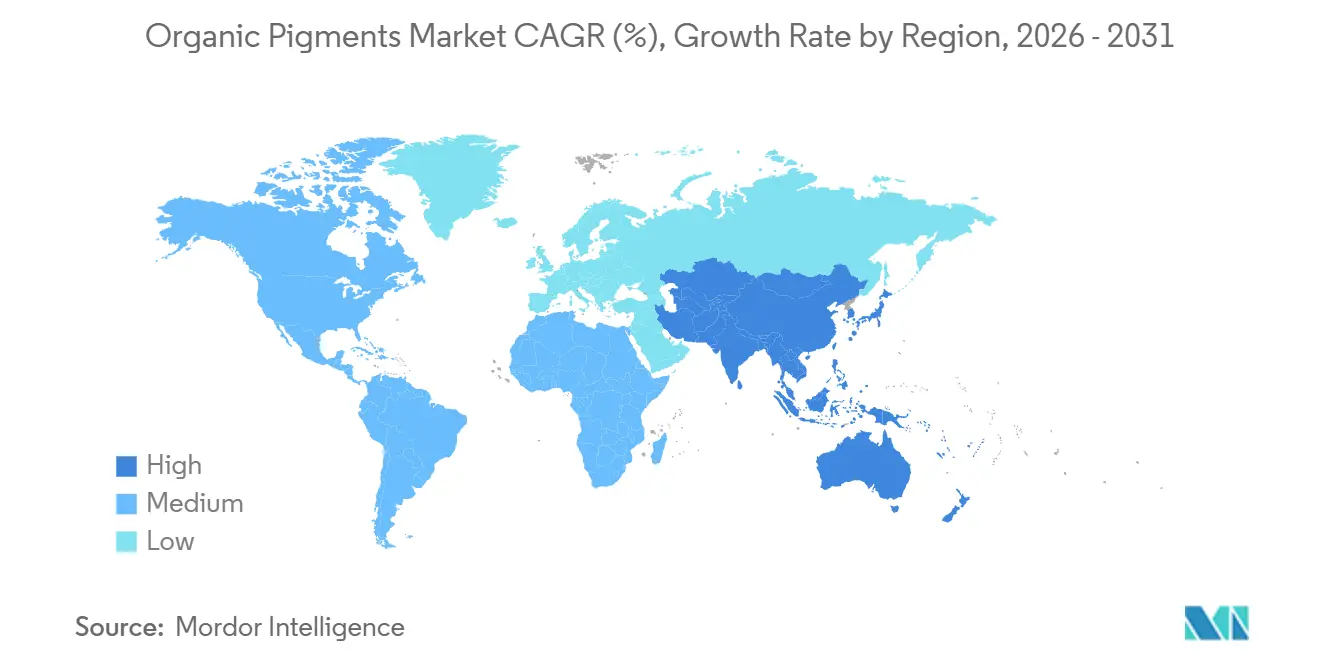
- By geography, Asia-Pacific captured 49.63% of volume in 2025 and is projected to lead the organic pigments market with a 4.92% regional CAGR out to 2031.
Note: Market size and forecast figures in this report are generated using Mordor Intelligence’s proprietary estimation framework, updated with the latest available data and insights as of January 2026.
Market Trends and Insights
Drivers Impact Analysis of Organic Pigments Market*
| Driver | (~) % Impact on CAGR Forecast | Geographic Relevance | Impact Timeline |
|---|---|---|---|
| Growing demand from paints and coatings | +0.8% | Global, concentrated in Asia-Pacific and Europe | Medium term (2-4 years) |
| Shift toward eco-friendly high-performance pigments | +0.7% | Europe and North America, spillover to Asia-Pacific | Long term (≥ 4 years) |
| Surging flexible-packaging and digital-printing ink demand | +0.9% | Global, led by Asia-Pacific e-commerce hubs | Short term (≤ 2 years) |
| Expanding textile production in emerging economies | +0.6% | Asia-Pacific core (India, Bangladesh, Vietnam) | Medium term (2-4 years) |
| AI-enabled digital color matching | +0.5% | North America and Europe, early adoption in China | Long term (≥ 4 years) |
| Source: Mordor Intelligence | |||
Growing Demand From Paints And Coatings Industry
Architectural and industrial coatings absorbed 39% of China’s 251,000-tonne pigment output in 2024, reflecting rapid urban renewal and infrastructure upgrades. Water-based acrylic emulsions replacing solvent-borne alkyds require pigments that disperse without coupling agents, favoring quinacridone magenta and phthalocyanine blue that resist flocculation in high-pH latex paints. Automotive refinish shops specify effect grades combining quinacridone with aluminum flakes to ensure radar-friendly finishes on electric vehicles, pushing approved pigment lists toward sub-100-nanometer products[1]. Continuous-flow reactors help producers meet this granularity while holding batch-to-batch ΔE within ±2, preserving brand color integrity. These technical prerequisites sustain premium pricing even when feedstock costs swing.
Shift Toward Eco-Friendly High-Performance Pigments
The European Union’s microplastics restriction, active since October 2023, prohibits intentional particle release under 5 millimeters, propelling formulators to experiment with bio-based quinacridone precursors synthesized from lignin. California’s Safer Consumer Products program lists several azo grades, obligating alternatives analysis for shipments above 1 tonne annually. Natural extractions from turmeric and spirulina win share in food-contact packaging but lack light-fastness beyond Blue Wool 4, limiting outdoor use. As regulations tighten, the organic pigments market rewards suppliers that can balance biodegradability with performance, spurring a bifurcation between commodity producers and specialty players offering certified low-migration grades.
Surging Flexible-Packaging And Digital-Printing Ink Demand
Asia-Pacific processed over 150 billion e-commerce parcels in 2024, each needing printed graphics. Digital inkjet presses, now 18% of installed capacity, call for nano-milled dispersions under 150 nanometers to protect printheads. Sun Chemical’s UV-curable flexo inks cure in 0.5 seconds at 400 meters per minute and use phthalocyanine and quinacridone pigments pre-dispersed in reactive diluents[2]. Food-contact flexible-packaging converters favor water-based gravure inks free of toluene, paying 20%-30% premiums for pigments with extractables below 0.1% by mass. These specifications keep digital printing a high-growth node inside the organic pigments market.
Expanding Textile Production In Emerging Economies
India’s textile exports hit USD 44.4 billion in FY 2023-24, supported by seven PM MITRA parks that co-locate dyeing and finishing under integrated effluent systems. Bangladesh added 1.2 million polyester spindles in 2024, targeting sportswear that requires azo-based disperse dyes with ISO 105 wash-fastness above Level 4. Vietnam’s textile shipments rose 8.7% in 2024 under EU tariff preferences. Heat-stable quinacridone and perylene grades endure 200 °C thermosol processing without sublimation, allowing dye houses to maintain vibrant shades. Regional pigment makers expanding dispersion capacity gain speed-to-market advantages that reinforce the organic pigments market expansion.
Restraints Impact Analysis of Organic Pigments Market*
| Restraint | (~) % Impact on CAGR Forecast | Geographic Relevance | Impact Timeline |
|---|---|---|---|
| Higher production costs from environmental rules | -0.5% | Europe and North America, extending to China | Medium term (2-4 years) |
| Cost/performance edge of inorganic pigments | -0.3% | Global, particularly in construction and industrial coatings | Long term (≥ 4 years) |
| Feedstock-price volatility | -0.4% | Global, with acute impact in Asia-Pacific | Short term (≤ 2 years) |
| Source: Mordor Intelligence | |||
Higher Production Costs From Stringent Environmental Regulations
The EU’s 2024 Classification, Labelling and Packaging update requires fresh toxicology dossiers costing EUR 50,000-150,000 per pigment. China’s 2024 Water-Pollution Law capped COD discharges at 50 mg/L, prompting CNY 20-50 million (USD 2.8-7 million) wastewater-treatment retrofits. India’s real-time effluent monitoring adds 12%-18% to operating costs for mid-tier producers. These investments burden firms that lack scale to amortize compliance, tempering growth in the organic pigments market.
Performance/Cost Advantages Of Inorganic Pigments
Titanium dioxide supplies superior opacity at one-third the kilogram cost, enabling formulators to hit hiding-power targets with lower loadings. For construction paints, price-sensitive buyers switch when organic quotations climb. Lanxess’s 2025 5% price hike on Bayferrox iron oxides illustrates industry-wide cost escalation. Inorganic pigments, therefore, cap the price elasticity of the organic pigments market, especially in high-volume architectural applications.
*Our forecasts treat driver/restraint impacts as directional, not additive. The impact forecasts reflect baseline growth, mix effects, and variable interactions.
Organic Pigments Market Segment Analysis
By Pigment Type:
Azo Variants Dominate While Quinacridone Gains PaceAzo grades secured 45.36% of the organic pigments market share in 2025, a position supported by low-complexity diazo-coupling synthesis that yields vivid yellows and reds at scale. Their ready dispersibility enables water-based flexographic inks to cut milling energy by 20% compared with quinacridone options. Disazo oranges deliver opacity in polypropylene masterbatch at 0.5% loading, doubling output rates on extruders that throttle back torque. Quinacridone pigments, though smaller in tonnage, expand at a 4.43% CAGR as OEMs demand polymorphs retaining hue after 2,000 hours of xenon-arc exposure, critical for 10-year vehicle warranties.
In the forecast horizon, the organic pigments market expects quinacridone’s heat stability above 200°C to unlock new battery-cover and composite-body uses, yet cost sensitivity in flexible packaging keeps azo grades entrenched. Phthalocyanine blues and greens remain workhorses in architectural coatings, trading under USD 8/kg for alpha-crystal copper phthalocyanine. Niche anthraquinone and perylene reds fetch prices beyond USD 50/kg, where Blue Wool 7 light-fastness is non-negotiable. Digital color-matching systems may substitute costly pigments with optimized blends, pressuring specialty grades to prove lifetime value in the organic pigments market.

By Source:
Synthetic Routes Prevail As Bio-Based Alternatives Scale SlowlySynthetic processes held 88.47% of the 2025 volume, buttressed by decades-honed yields surpassing 85% in azo, phthalocyanine, and quinacridone lines. Natural extracts, curcumin, betanin, phycocyanin, win niche adoption in food-contact packaging but lack Blue Wool 5 durability, stalling wider exterior uptake. Bio-based synthetic pigments produced via fermentation shave carbon footprints by 40%, though sub-60% yields keep costs elevated.
The organic pigments market size for bio-based grades is projected to rise at a 4.31% CAGR to 2031, aided by California’s Safer Consumer Products mandates and forthcoming EU Ecodesign rules. Yet until carbon pricing closes the gap, synthetic incumbents will dominate high-performance coatings where consistent chroma and stability outweigh environmental messaging. The trajectory signals parallel supply chains: commodity synthetic for cost efficiency and specialty bio-based for premium eco-labels.
By End-User Industry:
Printing Inks Lead While Textile AcceleratesPrinting inks consumed 43.88% of the organic pigments market size in 2025, riding e-commerce’s parcel boom and the shift to nano-milled dispersions for inkjet heads. Paints and coatings follow, leveraging water-based acrylics to meet VOC caps of 50 g/L in the EU and 150 g/L in China. Plastics compounding values heat-stable quinacridone reds that endure 280°C in polyamide without hue drift.
Textiles, though a smaller slice, race ahead at a 4.39% CAGR as India, Bangladesh, and Vietnam upgrade dyeing capacity. Disperse dyes integrating azo chromophores achieve ISO 105-C06 wash-fastness above Level 4, essential for fast-fashion polyester. Integrated PM MITRA parks in India shorten pigment lead times, reinforcing growth momentum. Specialty cosmetics and artist-color segments round out demand, insisting on low-migration grades that carry 30%-50% premiums, securing value pockets inside the organic pigments market.
Geography Analysis
APAC Organic Pigments Market
Asia-Pacific commanded 49.63% of 2025 volume and will expand at a 4.92% CAGR to 2031 as China’s 251,000-tonne output and India’s fast-growing textile and coatings sectors lift regional offtake. Chinese producers such as Baihehua and Qicai Chemical employ continuous-flow reactors that achieve color-strength tolerances within ±2 ΔE, qualifying for automotive approvals CPCIF.CN. India’s organic pigments market registered 11% growth in FY 2024-25 on the back of USD 44.4 billion in textile exports and infrastructure-driven paint consumption.
North America and Europe Organic Pigments Market
North America and Europe jointly represent roughly 30% of global volume. The EU’s microplastics restriction and REACH updates steer formulators toward low-migration and biodegradable grades, letting specialty suppliers capture margin. In the United States, California’s regulatory stance accelerates the substitution of flagged azo pigments with quinacridone and phthalocyanine alternatives, pressuring commodity incumbents to upgrade toxicology data. Digital color-matching tools see early adoption across automotive refinish chains, enhancing service differentiation.
South America and MEA Organic Pigments Market
South America and the Middle East-Africa cover the remaining share. Brazil’s construction rebound supports local pigment demand, whereas Saudi Arabia’s downstream diversification under Vision 2030 seeds coatings capacity tied to petrochemical clusters. These regions import high-performance grades yet source commodity azo pigments from Asia, underscoring Asia-Pacific’s role as the supply backbone of the organic pigments market.
Regulatory Landscape
Organic pigment manufacturers selling into coatings and inks face tighter EU chemical compliance requirements covering substance registration, classification, and particle-form documentation under REACH and related updates. In December 2025, the European Commission adopted Decision 2025/2607, which set revised EU Ecolabel criteria for decorative and performance coatings, increasing downstream demand for pigments and preparations with reduced hazardous content and improved lifecycle profiles.
In 2026, enforcement attention also broadened to emissions and trade compliance. In April 2026, the US EPA updated NESHAP requirements for chemical manufacturing area sources, raising the compliance burden for pigment plants and upstream intermediates. Separately, in February 2026, the US Department of Commerce published preliminary results in an administrative review on antidumping duties for carbazole violet pigment 23 from India, showing how trade remedies can affect sourcing decisions for specific organic pigment chemistries in North America.
Value Chain Analysis
The organic pigments value chain begins with petrochemical aromatics and derivatives (including benzene-toluene-xylenes chains, naphthalene derivatives, and key intermediates such as crude copper phthalocyanine). It then moves through synthesis and finishing (filtration, washing, drying), followed by downstream processing into powder pigments, press-cakes, and pigment preparations or dispersions. Feedstock availability and intermediate concentration in Asia remain important, with crude copper phthalocyanine supply concentrated across China, India, and Japan, while high-consistency dispersions and nano-milling capabilities are increasingly used to differentiate suppliers serving digital inks and high-end coatings.
Manufacturing economics and resilience are shaped by compliance investments and process choices. Producers are adopting continuous manufacturing and improved heat-management approaches, particularly for performance chemistries such as quinacridones, to improve yield consistency and reduce waste under stricter environmental enforcement. Integrated pigment houses with broader chemical portfolios, for example BASF SE access to dispersant chemistry alongside pigments, gain leverage across procurement, production optimization, and technical service, while European producers manage higher energy-transition costs and shift select commodity production steps toward lower-cost regions under the EU Green Deal context.
Competitive Landscape
The Organic Pigments market is moderately consolidated. Consolidation continued when SK Capital acquired Heubach in November 2024, merging European phthalocyanine lines with a broader specialty-chemicals portfolio. Sudarshan Chemical commissioned a 5,000-tonne dispersion line in 2025 to serve automotive and industrial coatings that require ±2 ΔE consistency. Regulatory compliance costs under REACH and California’s programs raise barriers, favoring diversified players that amortize documentation across portfolios, thereby shaping long-term dynamics in the organic pigments market.
Organic Pigments Industry Leaders
-
DIC CORPORATION
-
Sudarshan Chemical Industries Limited
-
BASF
-
artience Co., Ltd.
-
Clariant
- *Disclaimer: Major Players sorted in no particular order
Organic Pigments Market Companies Covered in this Report
- BASF
- artience Co., Ltd.
- Changzhou Longyu Pigment Chemical CO.,LTD.
- Clariant
- DIC CORPORATION (Sun Chemical)
- Ferro Corporation
- Hangzhou Han-Color Chemical CO. LTD
- Heubach GmbH
- Indian Chemical Industries
- Koel Colours Pvt Ltd
- LANXESS AG
- Meghmani Organics Ltd.
- Origo Chemical
- Pidilite Industries Ltd
- Sudarshan Chemical Industries Limited
- Trust Chem Co. Ltd
- VIBFAST PIGMENTS PVT LTD
- Vipul Organics Ltd
Market Opportunities and Future Outlook
Capacity and technology investments are clustering around high-performance organic pigments and application-ready formats. In February 2026, Sun Chemical announced an approximately USD 10 million investment to expand quinacridone pigment production capacity at its Newport, Delaware facility, which aligns with demand for durable, heat-stable grades used in premium coatings and color-critical applications. Downstream users in printing inks and coatings continue moving from dry pigments to dispersions and pigment preparations that simplify formulation and support tighter color tolerances, consistent with the report’s emphasis on AI-enabled digital color matching and the need for consistent, nano-milled dispersions.
Compliance-driven positioning also creates room for suppliers that can operationalize documentation, traceability, and safer-substitution performance. In July 2026, ECHA implemented Version 4 of revised Annex VI under REACH with nano-form dossier requirements for materials below 100 nm, increasing the value of suppliers that can provide nano-specific data packages and consistent particle-form control for EU-bound shipments. Ongoing substitution away from cadmium and lead pigments in regulated applications keeps attention on organic alternatives where lightfastness, migration control, and heat stability can meet end-use requirements, supporting differentiated low-migration grades for food-contact packaging inks and performance coatings.
Recent Industry Developments in Organic Pigments Market
- June 2026: Sudarshan Chemical inaugurated its second global head office in Frankfurt, Germany, expanding its operating footprint after integrating the Heubach business. The move strengthens customer-facing coordination and technical support for European coatings and ink customers and signals a more permanent post-merger structure for managing a multi-site pigment network.
- March 2025: Sudarshan Chemical Industries Limited completed the acquisition of Germany-based Heubach Group, combining legacy Heubach and Sudarshan capabilities into a broader global pigments platform with an expanded international site base. The transaction reshaped competitive dynamics by increasing scale in key organic pigment families and strengthening access to regulated end markets.
- November 2024: SK Capital acquired Heubach, marking a significant ownership change for a major pigment producer with established positions in performance organic pigments. The deal accelerated consolidation momentum and influenced portfolio and footprint decisions across suppliers serving coatings, inks, plastics, and specialty applications.
Organic Pigments Market Report Scope and Research Methodology
Market Definition and Coverage
This market tracks organic pigments used to add color in industrial and consumer applications, counted as pigment volumes supplied into end uses like coatings, plastics, inks, and textiles across major regions.
Scope exclusions: Inorganic pigments, dyes, and other colorants that do not function as pigments in the target applications are excluded.
Segments Covered in This Report
- By Pigment Type
- Azo
- Phthalocyanine
- Quinacridone
- Anthraquinone
- Other Pigment Types
- By Source
- Synthetic
- Natural / Bio-based
- By End-User Industry
- Paints and Coatings
- Plastics and Polymer
- Printing Inks
- Textile
- Other End-user Industries
- By Geography
- Asia-Pacific
- China
- India
- Japan
- South Korea
- Southeast Asia
- Rest of Asia-Pacific
- North America
- United States
- Canada
- Mexico
- Europe
- Germany
- United Kingdom
- Italy
- France
- Russia
- Rest of Europe
- South America
- Brazil
- Argentina
- Rest of South America
- Middle-East and Africa
- Saudi Arabia
- South Africa
- Rest of Middle-East and Africa
- Asia-Pacific
Data Sources, Market Sizing, and Validation
Desk Research
Desk research was used to build the starting structure for the size model and to anchor assumptions that are hard to validate through interviews alone. We reviewed public trade and production signals such as United Nations Comtrade import and export series, national statistics office industrial output indices, and EPA and ECHA publications to understand compliance-driven shifts in pigment selection.
To keep the end-use splits realistic, we also checked sources such as paint and coatings and printing ink association publications, peer-reviewed papers on pigment chemistry and performance, and patent databases that indicate where formulation work is moving. Alongside these, we used company annual reports, investor presentations, and industry press for capacity additions, plant restarts, and regional supply changes. Some datasets were supported with paid subscriptions for company financials and intelligence and shipment-level trade data, and then reconciled back to public signals. These examples are not exhaustive, and other sources were also used for data collection, cross-checks, and clarification.
Primary Interviews and Surveys
Primary work focused on validating how demand is formed and how volumes move through the value chain, especially where public statistics do not separate pigment families cleanly. We spoke with pigment producers, formulators, distributors, and downstream users in coatings, plastics, inks, and textiles across APAC, EMEA, and the Americas, then used their input to confirm split assumptions and normalize outlier signals.
Distribution of primary research fieldwork respondents
| Company type | Respondent position | Region |
|---|---|---|
| Top tier: 26% | CXOs: 18% | APAC: 41% |
| Mid tier: 56% | Functional/Unit leaders: 40% | EMEA: 36% |
| Smaller Players: 18% | Managers: 42% | Americas: 23% |
Market-Sizing & Forecasting
The core sizing starts from a top-down demand build using region-level coatings, plastics processing, and printing activity indicators, which are then translated into organic pigment consumption using application-level loading factors and substitution patterns. Once that demand pool was assembled, we corroborated totals with selective bottom-up approximations, such as sampled supplier volumes by pigment family and channel checks on typical grade-level pricing ranges, and then adjusted where the two views did not align.
Inputs that matter in this market include paints and coatings output trends, plastics compounding and masterbatch activity, printing ink demand linked to packaging and publishing, textile coloration shifts, and regulation-led movement away from certain chemistries. Where available, trade flows for pigment intermediates and finished pigments were used as a reasonableness check, and capacity announcements were used to stress-test supply feasibility. For forecasting, scenario analysis was applied around end-use growth rates and price progression, and those scenarios were pressure-tested with primary feedback so the final path reflects how suppliers and buyers expect demand and pricing to move. When gaps appeared in country detail, we filled them using regional proxies tied to industrial output and trade intensity, and then rechecked the implied per-unit pigment usage against interview ranges.
Data Validation & Update Cycle
Validation is done through multi-step checks so the model does not drift away from real market signals. We compare computed volumes against independent indicators like downstream production indices, trade directionality, and capacity utilization narratives, then review sharp variances before final sign-off.
If an assumption shifts materially, such as a major plant shutdown, a compliance change, or an unexpected demand slowdown in packaging or coatings, the analyst is re-contacted with selected respondents to confirm the magnitude and timing. The report is refreshed annually, and interim updates are prepared when major events materially change supply, pricing, or demand. Before delivery, a final review pass is completed so clients receive the most current view, tied back to clear inputs.
Mordor Intelligence's Organic Pigments Market Sizing Compared With Other Published Estimates
Published market sizes for organic pigments can look far apart because the studies do not always measure the same thing, even when the title sounds identical. Differences usually come from whether the work is volume-led or revenue-led, how applications are grouped, and how price is treated across regions and grades.
The main gap comes from unit choice and scope mixing, where Mordor Intelligence keeps the headline size in kilotons and avoids folding dyes and inorganic pigments into the pigment total, while some published figures present a USD value that can also reflect broader colorant baskets and different price escalation logic.
Benchmark comparison
| Source | Market Size | Gaps in Research Methodology |
|---|---|---|
| Mordor Intelligence | USD 0.76 M (2026) | |
| Industry Publisher A | USD 3.56 B (2024) | Uses revenue sizing in USD and a different base year, which can embed wider application pricing spreads and currency timing effects that are not comparable to a volume-only headline. |
| Industry Publisher B | USD 5.00 B (2024) | Reports a value-based global estimate with a broad application list, and the approach can vary by assumed average selling prices by grade and region, which can inflate totals when scope boundaries are not tightly controlled. |
Looking at the table, most of the spread is explained by mixing kilotons with USD value and by using different base years. When buyers align the unit of measure and keep the included colorant set consistent, the remaining differences usually narrow to pricing assumptions, regional weighting, and how quickly the model is refreshed after supply or regulatory changes.
Key Questions Answered in the Report
What is the projected demand for organic pigments by 2031?
The organic pigments market is forecast to reach 889.69 kilotons by 2031, reflecting a 3.26% CAGR during 2026-2031.
Which region contributes the most to consumption?
Asia-Pacific accounts for 49.63% of 2025 volume and is expected to remain the largest and fastest-growing region.
Which pigment type leads in volume terms?
Azo pigments held 45.36% of volume in 2025 due to low-cost synthesis and broad compatibility with water-based inks.
Why are quinacridone grades gaining traction?
Quinacridone pigments deliver heat stability above 200 °C and 2,000-hour xenon-arc durability, meeting stringent automotive color warranties.
How do environmental regulations affect producers?
EU CLP updates and microplastics rules raise compliance costs by EUR 50,000-150,000 per pigment, increasing production expenses for smaller firms.