
Organic Fish Market Size and Share
Market Overview
| Study Period | 2021 - 2031 |
|---|---|
| Market Size (2026) | USD 2.71 Billion |
| Market Size (2031) | USD 3.63 Billion |
| Growth Rate (2026 - 2031) | 6.02 % |
| Fastest Growing Market | Asia Pacific |
| Largest Market | Europe |
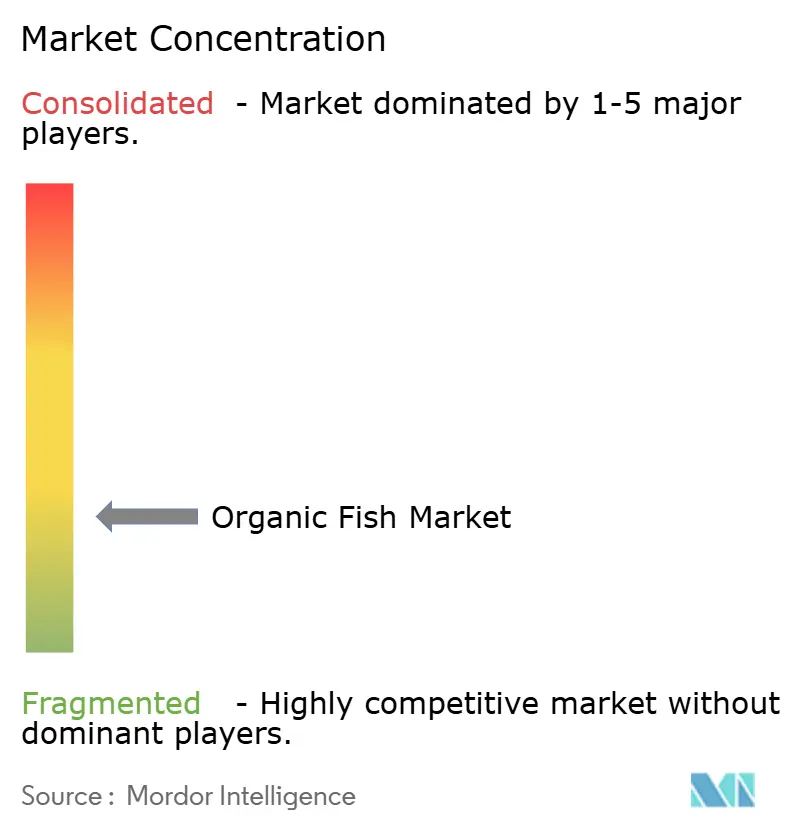
| Market Concentration | Low |
Major Players
*Disclaimer: Major Players sorted in no particular order Image © Mordor Intelligence. Reuse requires attribution under CC BY 4.0. |
|
Organic Fish Market Analysis by Mordor Intelligence
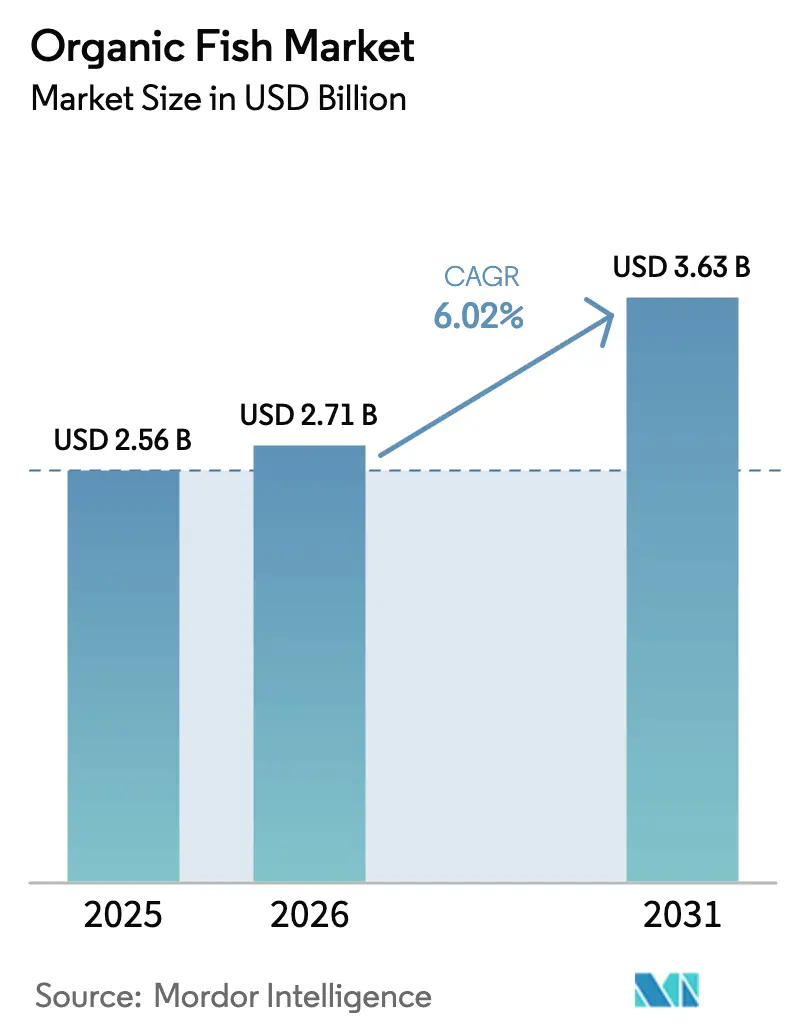
The organic fish market size is expected to grow from USD 2.56 billion in 2025 to USD 2.71 billion in 2026 and is forecast to reach USD 3.63 billion by 2031 at 6.02% CAGR over 2026-2031. Rising consumer consciousness about chemical residues in conventional aquaculture, broader alignment with sustainable diets, and the enforcement of tighter organic aquaculture regulations collectively underpin this growth. Demand momentum is amplified by educated millennial and Gen Z cohorts who routinely prioritize traceability, animal welfare, and climate metrics when purchasing seafood. Momentum is especially clear in regions that combine high disposable incomes with well-developed cold-chain networks, allowing retailers to stock a widening range of certified fresh, chilled, and processed products. Meanwhile, land-based recirculating aquaculture systems (RAS) and novel packaging platforms such as water-resistant DryPack are cutting distribution losses and broadening shelf life, reducing one of the main historical barriers to scale.
Key Report Takeaways
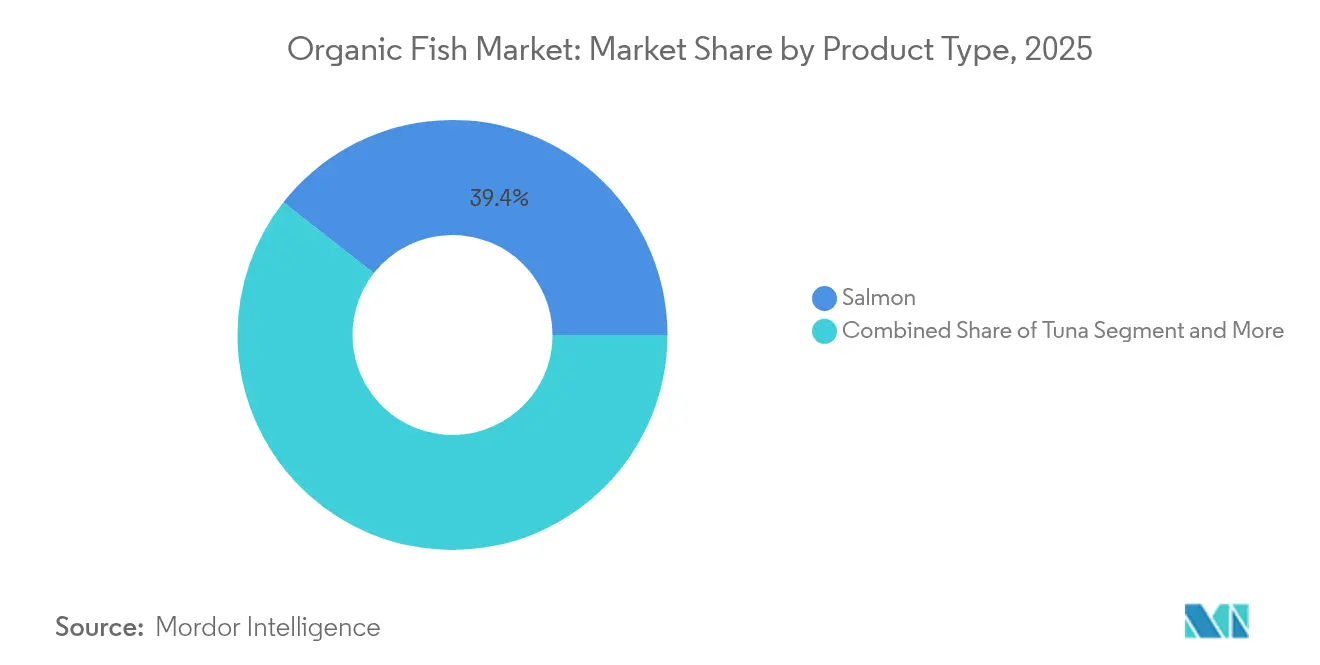
- By product type, salmon led with 39.42% of organic fish market share in 2025, while trout is forecast to grow fastest at an 8.30% CAGR through 2031.
- By form, fresh and chilled products captured 46.10% of revenue in 2025; processed variants are poised for a 7.19% CAGR to 2031.
- By price range, premium lines dominated with 59.48% of value in 2025, whereas value offerings are on track for a 7.08% CAGR.
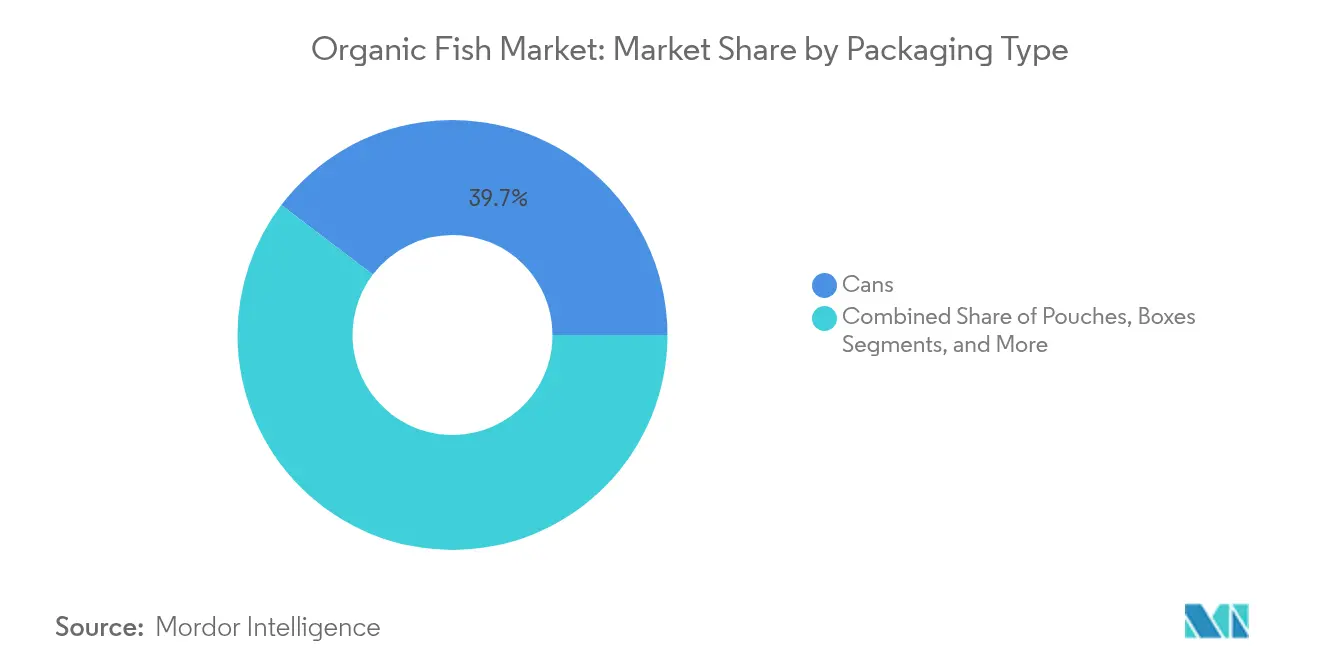
- By packaging, traditional cans retained 39.67% share in 2025; pouches represent the quickest-expanding format at an 8.39% CAGR.
- By distribution channel, the off-trade segment accounted for 68.22% of the organic fish market size in 2025, as the on-trade channel advances at a 7.10% CAGR.
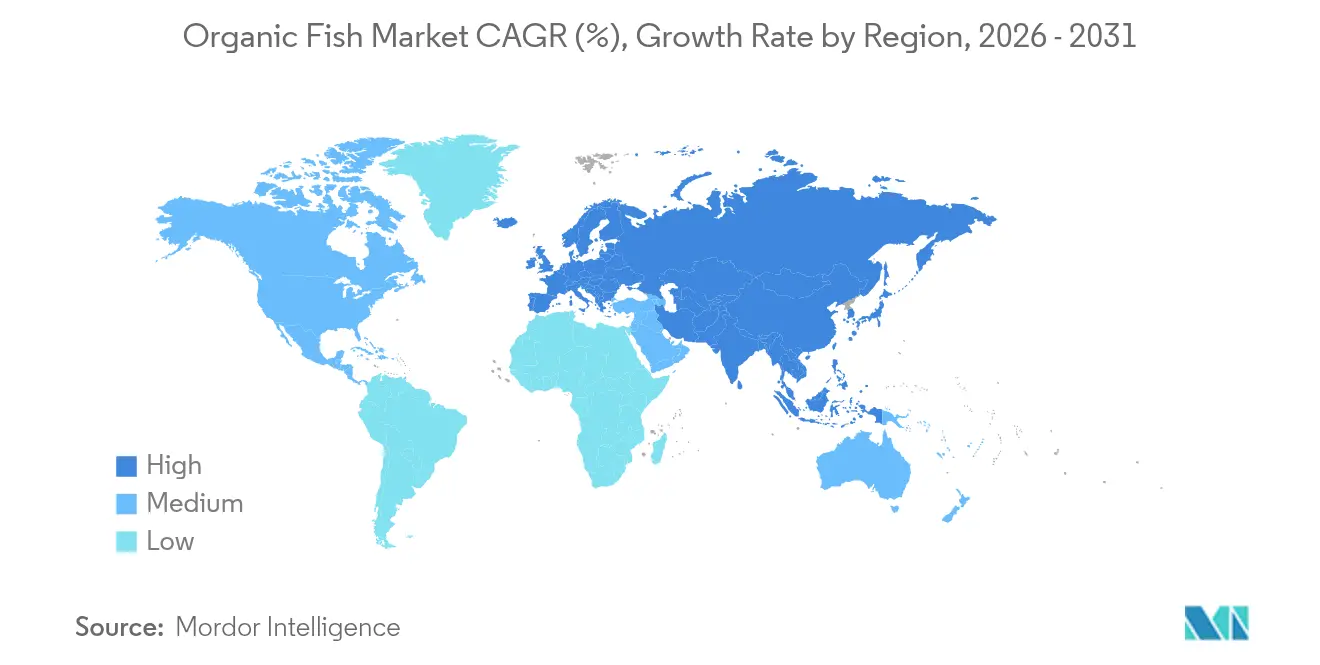
- By geography, Europe held 36.12% of global revenue in 2025, while Asia-Pacific is expected to accelerate at a 7.90% CAGR to 2031.
Note: Market size and forecast figures in this report are generated using Mordor Intelligence’s proprietary estimation framework, updated with the latest available data and insights as of 2026.
Market Trends and Insights
Drivers Impact Analysis of Organic Fish Market*
| Driver | (~) % Impact on CAGR Forecast | Geographic Relevance | Impact Timeline |
|---|---|---|---|
| Rising Consumer Preference for Chemical-Free and Sustainably Farmed Fish | +1.2% | Global, with strongest impact in North America and Europe | Medium term (2-4 years) |
| Strict Government Regulations on Chemical Use | +0.9% | Europe and North America core, expanding to Asia-Pacific | Long term (≥ 4 years) |
| Expansion of Organic Certification Programs | +0.7% | Global, with emphasis on developing markets | Medium term (2-4 years) |
| Rising Disposable Income in Developed and Emerging Markets | +0.8% | Asia-Pacific core, spill-over to South America | Short term (≤ 2 years) |
| Increasing Availability Through Modern Retail and Online Channels | +0.6% | Global, with early gains in urban centers | Short term (≤ 2 years) |
| Growing Demand for Traceability and Transparency | +0.5% | North America and Europe, expanding globally | Medium term (2-4 years) |
| Source: Mordor Intelligence | |||
Rising Consumer Preference for Chemical-Free and Sustainably Farmed Fish Fuels Market Growth
The market is experiencing significant growth, primarily driven by increasing consumer demand for chemical-free and sustainably farmed fish. Consumers are becoming more conscious of the environmental and health impacts associated with conventional aquaculture practices. This shift in preference is fueled by growing awareness of the benefits of organic fish, which include the absence of synthetic chemicals, antibiotics, and genetically modified organisms (GMOs) in production. The rising trend of health-conscious eating and the increasing popularity of organic food products are also contributing to the expansion of the organic fish market. As consumers prioritize quality and sustainability, the demand for organic fish is expected to grow steadily during the forecast period. In addition to regulatory support, advancements in aquaculture technology are playing a crucial role in meeting the growing demand for organic fish. Innovations in water quality management, feed optimization, and disease prevention are enabling producers to maintain high standards of organic certification while improving yield efficiency. These technological developments are reducing production costs, making organic fish more accessible to a broader consumer base.
Strict Government Regulations on Chemical Use Encourage Organic Fish Farming Practices
Regulatory frameworks are tightening globally. The EU has established the world's strictest aquaculture standards through Organic Regulation 2018/848, requiring maximum stocking densities, organic feeds, and banning artificial hormones for induced spawning.[1]Source: European Commission, "Organic production and products", www.agriculture.ec.europa.eu The U.S. has launched a USD 300 million Organic Transition Initiative to support farmers transitioning to organic practices. Starting March 2024, the U.S. enforced stricter measures by requiring NOP Import Certificates for all organic shipments [2]Source: U.S. Department of Agriculture, "Organic Situation Report, 2025 Edition", www.ers.usda.gov. These regulatory changes increase compliance costs but also create market barriers that protect certified producers from low-quality competition. In the UK, the Soil Association completed an 18-month review of welfare and environmental practices in Scottish salmon farms. They warned that they might withdraw from the sector within a year if meaningful progress does not occur. China's organic aquaculture sector, which produces 85,000 tonnes annually, faces fragmentation due to inconsistent certification standards across provinces. This highlights the need for unified regulatory measures. As regulations converge globally, producers who meet the highest standards can seize opportunities, while those unable to adapt may face exclusion.
Expansion of Organic Certification Programs Improves Consumer Trust and Market Credibility
The expansion of organic certification programs is a significant driver in the market. These programs ensure that organic fish products meet stringent standards, including sustainable farming practices, chemical-free production, and ethical sourcing. By adhering to these certifications, producers can enhance transparency and build consumer trust. This trust is crucial as consumers increasingly prioritize health-conscious and environmentally friendly choices. Furthermore, the credibility provided by recognized certification bodies strengthens the market position of organic fish products, enabling producers to differentiate themselves in a competitive landscape. The growing awareness and demand for certified organic products are expected to further propel the organic fish market during the forecast period. Organic certification programs also play a pivotal role in addressing consumer concerns regarding food safety and quality. These certifications assure that the fish are raised in controlled environments, free from harmful chemicals, antibiotics, and synthetic additives. This assurance is particularly important as consumers become more informed about the potential health risks associated with conventionally farmed fish. Additionally, the certifications promote sustainable aquaculture practices, which align with the increasing consumer preference for environmentally responsible products. The emphasis on sustainability not only attracts eco-conscious consumers but also supports long-term resource conservation, further driving the market.
Rising Disposable Income in Developed and Emerging Markets Supports Premium Organic Fish Sales
As disposable incomes rise in emerging markets, particularly in the Asia-Pacific region, consumers are increasingly driving the expansion of the market for premium organic fish products. This growth is significantly broadening the consumer base, extending beyond the traditionally developed markets. Consumers in these regions are actively seeking healthier and environmentally friendly dietary options, showing a growing preference for sustainable and organic food products. Their willingness to invest in high-quality, premium offerings is further fueling this demand. In response to this trend, India's Department of Fisheries is implementing the Pradhan Mantri Matsya Sampada Yojana with ambitious goals to double fishers' income and boost fish production to 22 million metric tonnes by 2024-25 [3]Source: Government of India, Ministry of Fisheries, Animal Husbandry and Dairying, "Department of Fisheries", www.dof.gov.in. The initiative emphasizes sustainable aquaculture practices, encouraging the adoption of organic production methods to ensure long-term environmental sustainability and economic growth. By prioritizing these measures, the program actively addresses economic and ecological challenges, fostering a balanced and sustainable development of the fisheries market while enhancing the livelihoods of fishers.
Restraints Impact Analysis of Organic Fish Market*
| Restraint | (~) % Impact on CAGR Forecast | Geographic Relevance | Impact Timeline |
|---|---|---|---|
| High Production Costs Limit Affordability and Restrict Market Penetration | -1.4% | Global, most acute in developing markets | Medium term (2-4 years) |
| Longer Growth Cycles Affect Timely Market Supply | -0.8% | Global, particularly affecting seasonal demand | Short term (≤ 2 years) |
| Competition From Conventional Fish Products with Lower Prices | -1.1% | Global, strongest in price-sensitive markets | Long term (≥ 4 years) |
| Supply Chain Inefficiencies and Limited Cold Storage Infrastructure | -0.6% | Developing markets, rural distribution networks | Medium term (2-4 years) |
| Source: Mordor Intelligence | |||
High Production Costs of Organic Fish Limit Affordability and Restrict Market Penetration
Organic aquaculture production costs significantly exceed conventional methods due to expensive organic feed requirements, extended certification processes, and stringent monitoring protocols that limit economies of scale. Transitioning from conventional to organic aquaculture is complex and costly, with organic yields typically lower than conventional systems, potentially limiting contribution to global food security despite environmental advantages. Feed represents the largest production cost component in European fish farming, with organic feed requirements adding substantial expense premiums that smaller producers struggle to absorb. Certification costs create additional barriers, particularly for small-scale producers who may require group certification arrangements to achieve economic viability, with high certification expenses limiting market entry for emerging producers. The cost structure challenges are most pronounced in developing markets where consumer price sensitivity restricts premium product adoption. However, Norwegian case studies demonstrate that effective biological risk management in organic systems can offset some cost disadvantages through reduced mortality rates and improved feed conversion efficiency. Industry consolidation may emerge as a response to cost pressures, potentially favoring larger integrated producers over smaller independent operations.
Competition From Conventional Fish Products with Lower Prices Challenges Market Growth
Conventional aquaculture products consistently challenge the expansion of the organic fish market. This is especially true as conventional producers, benefiting from economies of scale, outpace their organic counterparts constrained by volume limitations. While consumers show a willingness to pay a premium for organic fish, their purchasing behavior often skews towards conventional products when price differences surpass perceived value thresholds. This dynamic introduces volatility for organic producers, making it difficult to maintain consistent growth. The Scottish salmon industry feels this pressure acutely. The potential removal of distinctions between organic and conventional salmon in geographical indications threatens to commoditize the market. Such a shift could disadvantage smaller organic producers who depend on premium positioning to differentiate their products and sustain profitability. Companies in this sector are intensifying efforts to enhance taste, texture, and affordability, positioning themselves as challengers to both conventional and organic fish products. These advancements in plant-based alternatives could further fragment the market and increase competition. Given this competitive landscape, organic producers must articulate their value propositions more clearly.
*Our forecasts treat driver/restraint impacts as directional, not additive. The impact forecasts reflect baseline growth, mix effects, and variable interactions.
Organic Fish Market Segment Analysis
By Product Type:
Salmon Remains Dominant While Trout Accelerates InnovationIn 2025, salmon commands a dominant 39.42% market share, bolstered by the robust production infrastructure of Norway and Scotland. Meanwhile, trout is making waves as the fastest-growing segment, boasting an 8.30% CAGR through 2031. This surge is largely attributed to land-based recirculating aquaculture systems, which are adept at addressing pressing environmental concerns. Hima Seafood, at the forefront, operates the world's largest land-based trout farm in Norway. By harnessing advanced RAS technology, they not only cultivate trout but also produce organic fertilizer as a byproduct, showcasing scalable and sustainable production methods. Tuna, while carving out a premium niche in organic aquaculture, faces hurdles. Meanwhile, other species like sea bass, sea bream, and shellfish are diversifying the market, with China stepping up as a leader in producing a range of organic species, moving beyond the traditional salmon-centric focus.
Established supply chains and consumer familiarity tilt the competitive scales in favor of salmon. However, trout is reaping the rewards of technological advancements that not only mitigate environmental impacts but also slash production costs. Norwegian producers of organic salmon are proving that strategic differentiation can outpace the profitability of standard commodity production. One such company stands out, consistently reaping superior returns on sales, thanks to astute biological risk management. As conventional salmon farming grapples with regulatory scrutiny especially concerning sea lice management and environmental repercussions—organic producers find a golden opportunity. By showcasing their enhanced sustainability credentials, they can carve out a more significant market share.


By Form:
Fresh Dominates While Processing Innovations Drive GrowthFresh and chilled products command 46.10% market share in 2025, reflecting consumer preferences for minimally processed organic seafood, while processed products including smoked and ready-to-eat variants expand at 7.19% CAGR through 2031, driven by convenience demands and shelf-life extension technologies. High-pressure processing, modified atmosphere packaging, and smart packaging technologies enable organic fish processors to extend shelf life by up to 50% while maintaining organic integrity, addressing key distribution challenges. Frozen organic fish products serve as market entry vehicles for emerging producers, offering lower distribution costs and extended market reach compared to fresh products that require sophisticated cold chain infrastructure.
Processing innovation focuses on maintaining organic standards while improving convenience and shelf stability, with edible coatings derived from biopolymers emerging as sustainable preservation methods that enhance nutritional value. The form segmentation reflects broader consumer trends toward premium fresh products in developed markets and processed convenience options in emerging markets where cold chain infrastructure remains limited. Regulatory frameworks increasingly scrutinize processing aids and additives used in organic fish products, creating opportunities for companies that can develop clean-label processing technologies. Value-added processing represents a key differentiation strategy for organic producers seeking to capture higher margins while addressing diverse consumer preferences across geographic markets.
By Price Range:
Premium Still Rules While Value Lines Extend ReachIn 2025, premium products account for 59.48% of the global fish market value. This dominance highlights the cost dynamics associated with organic aquaculture and the growing consumer preference for products with verified sustainability credentials. The premium segment's stronghold reflects the willingness of consumers to pay a higher price for quality and environmentally responsible practices, which are increasingly becoming key differentiators in the market. As sustainability continues to gain traction, the premium segment is expected to maintain its significant share in the market over the coming years. Additionally, the premium segment benefits from advancements in aquaculture technologies and certifications that ensure traceability and compliance with environmental standards, further solidifying its position in the market.
Meanwhile, value segments are experiencing faster growth, expanding at a 7.08% CAGR through 2031. This growth indicates ongoing efforts to democratize the market, making fish products more accessible to a broader consumer base. The rising demand for affordable options is driving innovation and efficiency in production processes, enabling companies to cater to cost-conscious consumers without compromising on quality. This trend suggests a shift in market dynamics, where both premium and value segments coexist to meet diverse consumer needs. Furthermore, the growth of the value segment is supported by increasing investments in supply chain optimization and the adoption of cost-effective farming practices, which help reduce production costs and enhance market penetration. As a result, the global fish market is evolving to balance premium offerings with affordable alternatives, ensuring sustained growth across all segments.
By Packaging:
Sustainability Drives Pouch Innovation LeadershipIn 2025, traditional cans hold a 39.67% market share in the global fish market. This dominance is attributed to their well-established supply chains and the ability to provide extended shelf life, which is crucial for preserving fish products. Traditional cans have long been a preferred choice for manufacturers and consumers alike, offering durability and reliability in maintaining product quality over time. Their widespread availability and compatibility with existing distribution networks further reinforce their strong position in the market. Additionally, the affordability of traditional cans compared to other packaging formats makes them a cost-effective solution for both producers and consumers, particularly in regions with high demand for canned fish products.
On the other hand, pouches are emerging as the fastest-growing packaging format in the global fish market, with a projected CAGR of 8.39% through 2031. This growth is driven by increasing sustainability initiatives and the rising demand for convenient packaging solutions among consumers. Pouches are lightweight, require less material, and are easier to transport, making them an environmentally friendly alternative to traditional packaging. Additionally, their resealable features and ease of use cater to modern consumer preferences, positioning them as a key driver of innovation in the fish packaging segment. The growing focus on reducing plastic waste and adopting eco-friendly materials further accelerates the adoption of pouches, as they align with global sustainability goals.
By Distribution Channel:
Off-Trade Dominance Faces On-Trade Growth ChallengeIn 2025, off-trade channels, which include supermarkets, hypermarkets, convenience stores, specialty stores, and online retail, dominate with a 68.22% market share. Meanwhile, on-trade segments, primarily restaurants and foodservice, are witnessing a robust growth at a 7.10% CAGR through 2031. This surge is largely attributed to the rising demand for traceable organic seafood in restaurants. Among off-trade channels, online retail stands out as the fastest-growing subsegment. It not only facilitates direct-to-consumer sales, allowing for higher profit margins, but also caters to the organic consumer's demand for detailed product information and traceability. Supermarkets and hypermarkets continue to lead the market, bolstered by their established cold chain infrastructure and ingrained consumer shopping habits. However, specialty stores are carving out a niche, offering premium positioning for high-value organic fish products.
The evolution of distribution channels underscores a shift in consumer behavior and a trend in the restaurant industry leaning towards sustainability and transparency in sourcing. Maine's seafood sector pinpoints enhanced access to markets and distribution networks as pivotal for growth. This is especially true in the Northeast and South Atlantic regions, where the appetite for organic seafood is on the rise. Restaurants are driving the on-trade growth, aiming to set themselves apart through sustainable sourcing. Organic fish products not only enhance their menu but also justify a premium pricing strategy. These channel dynamics highlight the enduring significance of traditional retail, while also spotlighting the burgeoning opportunities in foodservice and direct-to-consumer sales, both of which promise greater value for organic producers.
Geography Analysis
Europe Organic Fish Market
In 2025, Europe commands a dominant 36.12% share of the organic fish market, leveraging its robust certification infrastructure and a discerning consumer base that values sustainability. Norway and Ireland spearhead production in Europe. Norwegian companies highlight the lucrative nature of organic salmon farming, attributing their success to effective biological risk management. Conversely, Scottish producers face pressure from the Soil Association, which has issued a warning of withdrawal unless notable welfare improvements are implemented within a year. Germany, the UK, and France emerge as key consumption centers, while Nordic nations, with their favorable aquaculture conditions, dominate production. In a testament to the region's trade tensions, European processors unite to challenge Norway's export restrictions on production-grade salmon, a move poised to reshape regional supply chains.
APAC Organic Fish Market
Asia-Pacific is set to emerge as the fastest-growing region, forecasting a 7.90% CAGR through 2031. This growth is fueled by rising disposable incomes, heightened awareness of organic food benefits, and a surge in aquaculture activities. Leading this momentum are countries like China, India, and Vietnam, bolstered by government initiatives championing sustainable aquaculture. The region's burgeoning middle class, willing to invest in organic and sustainably sourced fish, further propels this growth. Yet, challenges loom with inadequate certification frameworks and a nascent cold chain infrastructure, potentially curbing the market's expansive potential.
North America and MEA Organic Fish Market
North America and the Middle East & Africa are also pivotal players in the global organic fish arena. North America, with its pronounced focus on sustainability and health, sees the U.S. and Canada as its primary markets. The region's edge is amplified by advanced aquaculture technologies and a robust certification system. Meanwhile, the Middle East & Africa, buoyed by urbanization and a surging appetite for organic products, sees the UAE and South Africa emerging as key players. These nations benefit from escalating investments in aquaculture and enhancements in supply chain infrastructure, though they grapple with challenges like high production costs and a lack of consumer awareness.

Regulatory Landscape
Organic fish is governed by a combination of statutory organic rules and voluntary aquaculture schemes that influence stocking densities, feed inputs, animal welfare, and audit requirements. In Europe, EU Organic Regulation 2018/848 is a key anchor for organic aquaculture, and Norway aligns national organic rules with the EU framework, with the Norwegian Food Safety Authority delegating certification and control to Debio through recurring independent audits. Many producers also use additional third-party standards (such as ASC, GlobalG.A.P., and BAP) to show performance beyond minimum legal requirements and to improve market access in premium retail and foodservice channels.
In the UK organic salmon segment, 2026 has brought increased standard-setting pressure, with the Soil Association consulting on tougher criteria for organic salmon and setting a summer 2026 timeline for sector progress. These efforts raise compliance and documentation burdens across farming and processing, but they also strengthen differentiation for certified suppliers and increase the barrier for uncertified or weakly verified product moving through international trade.
Value Chain Analysis
The organic fish value chain runs from broodstock and hatcheries (smolt or juveniles) through grow-out (sea cages and land-based RAS), harvesting, and primary processing (gutting, filleting). It then moves into secondary and value-added processing (including smoked and ready-to-eat products), packaging, cold-chain logistics, and distribution via off-trade and on-trade channels. Organic requirements shape key operating steps, including tighter controls on feed and treatments, as well as production planning considerations such as longer fallowing periods between cycles (with organic fallowing described as longer than conventional in leading salmon production systems). Certification bodies and auditors, such as Debio in Norway under delegated control arrangements, add continuous verification steps that connect farm records, feed traceability, and processing segregation.
A defining feature in this segment is the role of vertically integrated players in managing critical bottlenecks, especially feed, farming, and processing. Companies such as Mowi, SalMar, and Leroy focus on end-to-end traceability and multi-standard certification coverage (organic plus aquaculture schemes such as ASC, GlobalG.A.P., and BAP), which helps maintain chain-of-custody integrity across farms, plants, and export documentation. Feed sourcing and formulation remain a central cost and risk node, requiring certified agricultural inputs and verified marine ingredients, often emphasizing trimmings and approved additives, while cold-chain execution and packaging choices influence yield protection and shelf-life performance for fresh, chilled, frozen, and processed organic fish.
Competitive Landscape
The organic fish market is characterized by fragmented competition, reflected in a low concentration score of 3 out of 10. This fragmented nature creates significant opportunities for both well-established aquaculture companies and emerging technology-driven disruptors to gain market share through innovative differentiation strategies. Major players such as Mowi ASA, Loch Duart Ltd., Leroy Seafood Group ASA, and SalMar ASA dominate the market by leveraging their extensive expertise in salmon farming and their well-integrated value chains. These companies benefit from economies of scale and robust operational frameworks, enabling them to maintain a competitive edge. On the other hand, smaller, specialized producers like Cooke Scotland and Glenarm Organic Salmon focus on carving out a niche by emphasizing premium organic positioning.
A key strategic trend in the market is the emphasis on vertical integration. Companies are increasingly controlling every stage of the value chain, from feed production and farming operations to processing and distribution. This approach ensures compliance with organic standards across the supply chain, enhances traceability, and reduces dependency on external suppliers. Vertical integration also allows companies to maintain consistent product quality and optimize cost structures, further strengthening their market position. Technological advancements play a pivotal role in shaping the competitive landscape. Companies are adopting innovative solutions such as recirculating aquaculture systems (RAS), which enable efficient water usage and minimize environmental impact.
Furthermore, the market dynamics are influenced by evolving consumer preferences, regulatory frameworks, and environmental challenges. The rising awareness of health benefits associated with organic fish consumption and the growing demand for sustainably sourced seafood are driving market growth. Companies that can effectively align their strategies with these trends are well-positioned to capture a larger share of the market. The competitive landscape is expected to remain dynamic, with both established players and new entrants striving to innovate and differentiate themselves in this rapidly evolving market.
Organic Fish Industry Leaders
-
Mowi ASA
-
Loch Duart Ltd.
-
Leroy Seafood Group ASA
-
SalMar ASA
-
Glenarm Organic Salmon Ltd.
- *Disclaimer: Major Players sorted in no particular order
Organic Fish Market Companies Covered in this Report
- Mowi ASA
- Loch Duart Ltd.
- Leroy Seafood Group ASA
- SalMar ASA
- Glenarm Organic Salmon Ltd.
- Valhalla Salmon
- The Irish Organic Salmon Company Ltd.
- Dom International Ltd.
- Coombe Farm Organic
- Blue Circle Foods
- Loch Fyne Oysters Ltd
- Scottish Salmon Company (Bakkafrost)
- Organic Sea Harvest Ltd.
- North Coast Seafoods
- Fish4Ever
- Isle of Skye Smokehouse
- Cooke Aquaculture Inc.
- Solex Catsm
- Anova Seafood B.V.
- Aqualande SA

Market Opportunities and Future Outlook
Tighter organic and welfare scrutiny across major consuming markets creates space for suppliers that can document higher-standard production and chain-of-custody. The Soil Association consultation on tougher organic salmon criteria in early 2026, with a summer 2026 progress timeline, supports product differentiation for operators already using higher transparency and welfare practices, while also increasing switching costs for retailers and foodservice operators seeking stable certified supply. Producers are also leaning on layered certification stacks (organic plus ASC, GlobalG.A.P., and BAP, depending on market) to expand access to premium customers that require auditable sustainability claims beyond baseline organic rules.
Feed and input innovation is another opportunity area because feed is a dominant operating cost and a key point of certification compliance. Mowi has formalized sustainable feed priorities, including an explicit target range of 10-15% of ingredients from emerging sources by 2030 and the use of certified soy and marine raw materials, which frames supply-chain redesign as a commercial lever for certified salmon and other organic species. On the production side, land-based RAS scaling, highlighted by Hima Seafood starting construction of a major RAS trout facility in Rjukan, Norway (announced August 2024), supports new organic-capable supply nodes closer to demand centers and can reduce distribution losses when paired with improved cold-chain and packaging execution.
Recent Industry Developments in Organic Fish Market
- July 2026: Mowi ASA issued a Q2 2026 trading update. The release provides a direct company-level view on revenue and volume, offering a clear indication of end-of-quarter momentum and the ability to sustain organic growth across the value chain.
- June 2026: Mowi ASA enters a Share Purchase Agreement to divest 9k GWT salmon farming operations in Canada East to Cooke Inc. for CAD 225 million. The divestment reduces geographic exposure and reallocates capital toward core organic growth initiatives, aligning the portfolio with strategic priorities.
- June 2026: Mowi entered into a Share Purchase Agreement to divest its 9k GWT salmon farming operations in Canada East to Cooke Inc. for CAD 225 million. The transaction trims the companys global footprint and provides capital for investment in higher return growth areas within existing operations.


Organic Fish Market Report Scope and Research Methodology
Market Definition and Coverage
For this study, the organic fish market covers sales value of fish that is produced under recognized organic aquaculture standards and sold as fresh, chilled, frozen, or processed products through retail and foodservice channels, across major consuming and producing regions.
Scope exclusions: Wild-caught fish without organic certification and organic seafood items outside fish (for example shrimp and shellfish) are excluded.
Segments Covered in This Report
-
By Product Type
- Salmon
- Tuna
- Trout
- Other Species
-
By Form
- Fresh/Chilled
- Frozen
- Processed (Smoked, Ready-to-Eat)
-
By Price Range
- Premium
- Value
-
By Packaging
- Cans
- Pouches
- Boxes
- Others
-
By Distribution Channel
-
Off-Trade
- Supermarkets & Hypermarkets
- Convenience Stores
- Specialty Stores
- Online Retail Stores
- Other Distribution Channels
- On-Trade
-
Off-Trade
-
By Geography
-
North America
- United States
- Canada
- Mexico
- Rest of North America
-
Europe
- Germany
- United Kingdom
- Italy
- France
- Spain
- Netherlands
- Poland
- Belgium
- Sweden
- Rest of Europe
-
Asia-Pacific
- China
- India
- Japan
- Australia
- Indonesia
- South Korea
- Thailand
- Singapore
- Rest of Asia-Pacific
-
South America
- Brazil
- Argentina
- Colombia
- Chile
- Peru
- Rest of South America
-
Middle East and Africa
- South Africa
- Saudi Arabia
- United Arab Emirates
- Nigeria
- Egypt
- Morocco
- Turkey
- Rest of Middle East and Africa
-
North America
Data Sources, Market Sizing, and Validation
Desk Research
Desk research started with mapping the organic aquaculture rulebook and labeling requirements, because these standards decide what can truly be counted as organic fish in trade and retail. We referred to public sources such as USDA organic program resources, the European Commission organic regulation pages, FAO fisheries and aquaculture statistics, UN Comtrade trade data, and national fisheries agencies that publish aquaculture volumes and species mix.
After that, secondary reading was used to translate volume signals into value signals. This included company annual reports and investor decks for product mix cues, retailer and association websites for certification and assortment direction, and reputable press for capacity additions and supply shocks. Select paid subscriptions were used only for company financials, patent lookups related to recirculating aquaculture and feed inputs, and shipment-level trade checks where public reporting lacked detail. The desk sources listed here are illustrative, and many other public and paid references were also used to gather, cross-check, and clarify data.
Primary Interviews and Surveys
Primary work was used to pressure-test pricing, certified supply availability, and what portion of premium fish is actually sold with organic certification rather than as a general sustainability claim. We spoke with stakeholders across farming, processors, certifiers, importers, and channel partners, which helped us align assumptions across APAC, EMEA, and the Americas and close gaps left by public statistics.
Distribution of primary research fieldwork respondents
| Company type | Respondent position | Region |
|---|---|---|
| Top tier: 36% | CXOs: 12% | APAC: 52% |
| Mid tier: 49% | Functional/Unit leaders: 42% | EMEA: 29% |
| Smaller Players: 15% | Managers: 46% | Americas: 19% |
Market-Sizing & Forecasting
Sizing was built from a top-down demand pool that reconstructs organic fish value by combining certified organic aquaculture output signals with trade flows, and then allocating these totals to end channels using observed consumption patterns. To keep the model realistic, the totals were subsequently checked with selective bottom-up approximations, such as sampled price points by species and form, distributor channel checks, and supplier roll-ups where disclosures were available.
Inputs used in the model included certified organic aquaculture volumes by species, import and export movements for key fish categories, average price premiums for organic versus conventional fish, the split of fresh versus frozen and processed consumption, and the pace of retail shelf expansion for certified seafood. Where direct organic labeling data was thin, conversion factors were applied using interview feedback and then stress-tested against trade and production constraints so the model did not over-allocate organic penetration.
Forecasting relied on scenario analysis anchored to expected certification uptake, farm capacity additions, feed availability constraints, and steady price premium behavior, with assumptions adjusted using expert feedback from primary calls. For regions with limited reported organic output, a gap-fill approach was used that starts from observed demand in import statistics and then back-allocates supply sources before final normalization.
Data Validation & Update Cycle
Outputs were validated by comparing modeled value totals against independent signals such as organic aquaculture production trends, trade balances for relevant fish categories, and stated capacity or certification expansions reported by market participants. When large variances showed up by region, species, or form, the assumptions were re-checked, and follow-up outreach was triggered to confirm whether pricing, availability, or channel mix had shifted.
Before sign-off, the full model and key assumptions go through multi-step analyst reviews, followed by consistency checks across historical years so unusual jumps can be explained and documented. Reports are refreshed annually, and interim updates are made when material events occur, such as regulatory changes for organic aquaculture or significant supply disruptions. Right before delivery, we complete a final review pass so the published view reflects the latest available information.
Mordor Intelligence's Organic Fish Market Size Versus Other Published Estimates
Published market values for organic fish do not always match, even when the topic name looks identical, because scopes and counting rules can be quietly different. The biggest differences usually come from whether the estimate is built around certified organic aquaculture sales only, what forms and channels are included, and how price premiums are applied across species and regions.
The table points to a clear spread across 2024 to 2026 values, and in Mordor Intelligence's model, only fish sold under recognized organic certification is counted, which avoids blending in broader sustainable seafood claims and limits double counting between fresh and processed formats. Other estimates can move higher or lower depending on whether they mix organic fish farming with wider seafood, apply a single premium across all regions, or rely on older price points without re-checking supply constraints.
Benchmark comparison
| Source | Market Size | Gaps in Research Methodology |
|---|---|---|
| Mordor Intelligence | USD 2.71 B (2026) | |
| Global Consultancy A | USD 2.48 B (2024) | Uses an earlier base year and can understate the market if later certification uptake and retail expansion are not carried into pricing and volume assumptions for 2025 to 2026. |
| Trade Platform B | USD 1.61 B (2023) | Tracks organic fish farming more narrowly and may miss downstream value capture from processing, imports, and foodservice sales that lift the end-market value beyond farm-gate views. |
Taken together, the spread is mostly explained by timing, whether the estimate is closer to farm output or end-market sales, and how certification is treated in the counting logic. By documenting the included demand signals and cross-checking price premiums with current trade and supply constraints, the final number stays traceable to steps that another analyst can repeat and challenge logically.


Key Questions Answered in the Report
What is the current size of the organic fish market?
The organic fish market size reached USD 2.71 billion in 2026, and forecasts point to USD 3.63 billion by 2031 due to a 6.02% CAGR.
Which region leads global demand for organic fish?
Europe holds the top position with 36.12% of 2025 revenue, benefiting from mature certification systems and consumers who readily pay premiums for traceable seafood.
What species dominates organic fish sales?
Salmon accounted for 39.42% organic fish market share in 2025, supported by established Nordic farming infrastructure.
Why are pouches the fastest-growing packaging format?
Pouches deliver 81% freight-space savings and full recyclability, pushing their adoption pace to an 8.39% CAGR through 2031.
Page last updated on:


 Your data is secure and never sold or shared.


