
Organic Coffee Market Size and Share
Market Overview
| Study Period | 2021 - 2031 |
|---|---|
| Market Size (2026) | USD 8.73 Billion |
| Market Size (2031) | USD 14.12 Billion |
| Growth Rate (2026 - 2031) | 10.09 % |
| Fastest Growing Market | Asia Pacific |
| Largest Market | Europe |
| Market Concentration | Medium |
Major Players *Disclaimer: Major Players sorted in no particular order Image © Mordor Intelligence. Reuse requires attribution under CC BY 4.0. | |
Organic Coffee Market Analysis by Mordor Intelligence
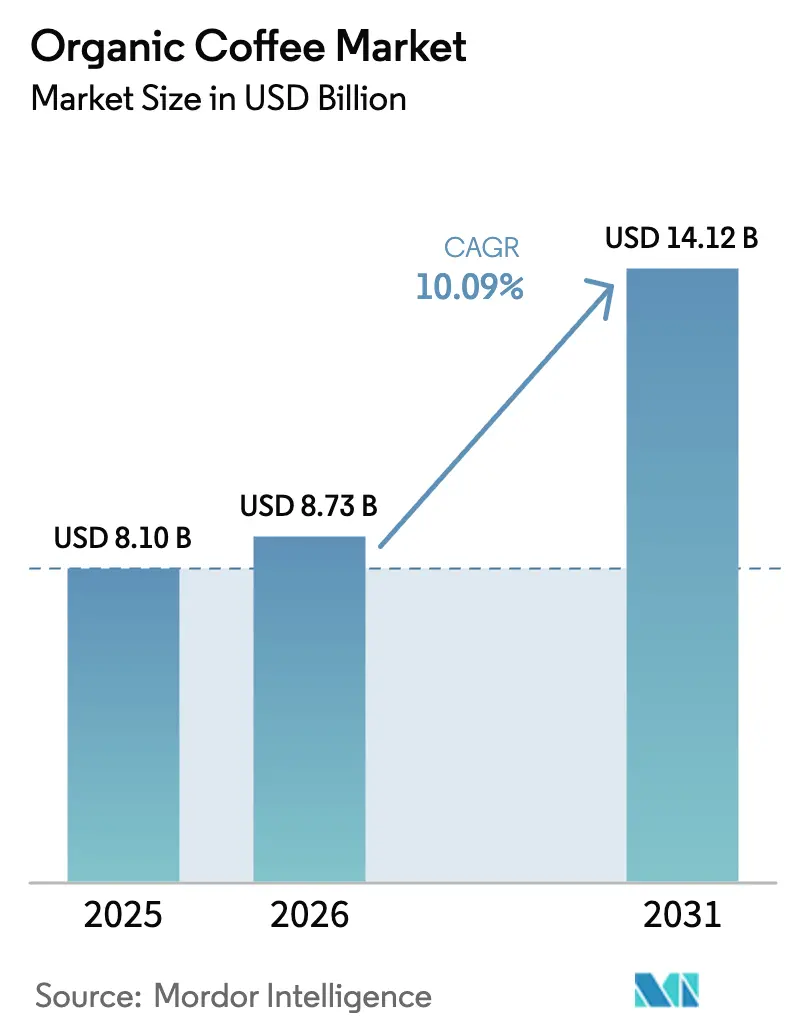
The organic coffee market size is projected to expand from USD 8.1 billion in 2025 and USD 8.73 billion in 2026 to USD 14.12 billion by 2031, registering a CAGR of 10.09% between 2026 to 2031. Driven by robust consumer demand for certified-sustainable beverages, tightening environmental regulations like the EU Deforestation Regulation, and a rising health consciousness, households in both developed and emerging economies are increasingly adopting these products. Europe, led by Germany and the Netherlands as re-export hubs, continues to dominate in terms of revenue. Meanwhile, the Asia-Pacific region is witnessing a surge in new café openings, particularly in China and India. While on-trade venues remain the primary drivers of value creation, direct-to-consumer subscriptions and online grocery platforms are swiftly expanding off-trade reach and altering gross-margin dynamics. Arabica beans remain the cornerstone of specialty offerings. However, a notable shift is emerging: with accelerating investments in organic Robusta certifications in Vietnam and Indonesia, there's a pivot towards espresso blends. These blends, preferred in Southern Europe and East Asia for their ability to pair with milk and sugar, signal a changing trend in the market.
Key Report Takeaways
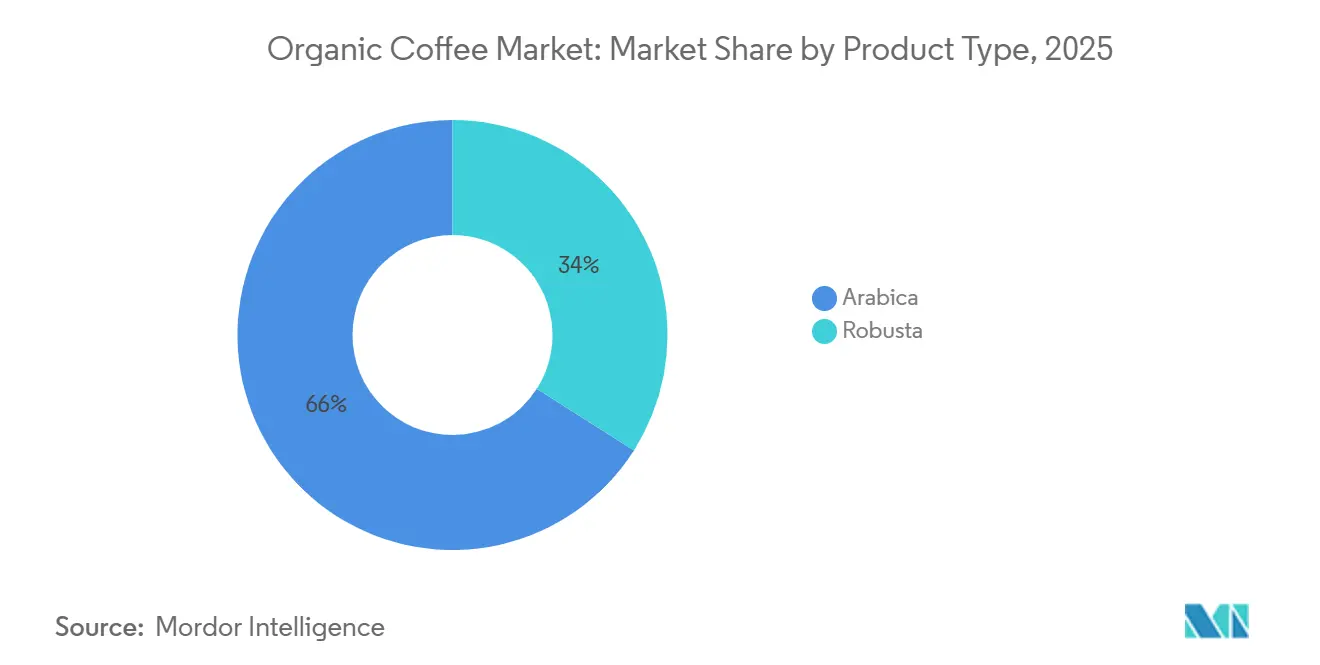
- By origin, Arabica beans led with 65.98% of the organic coffee market share in 2025, and Robusta is forecast to expand at a 10.87% CAGR through 2031.
- By product form, ground coffee accounted for 34.87% of 2025 revenue, whereas pods and capsules are projected to grow at an 11.24% CAGR to 2031.
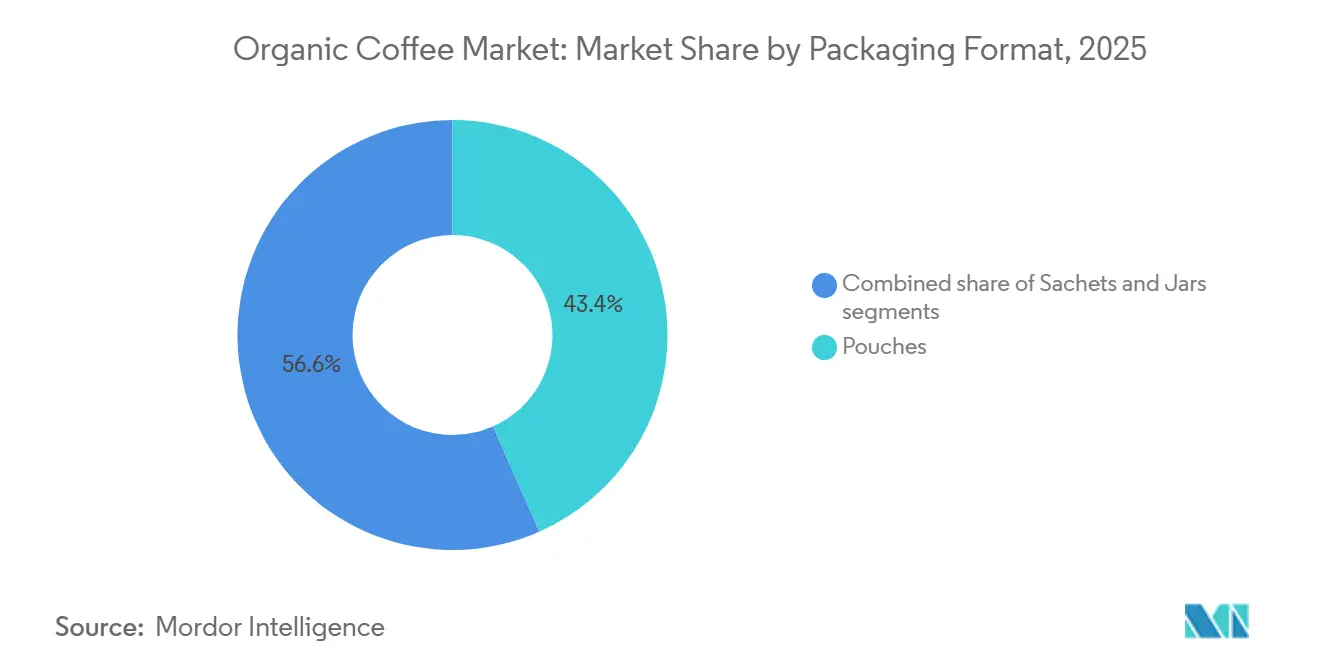
- By packaging, pouches captured 43.37% of 2025 sales, yet jars are set to rise at a 12.56% CAGR through 2031.
- By channel, on-trade outlets generated 76.83% of 2025 revenue, although off-trade is advancing at a 7.98% CAGR.
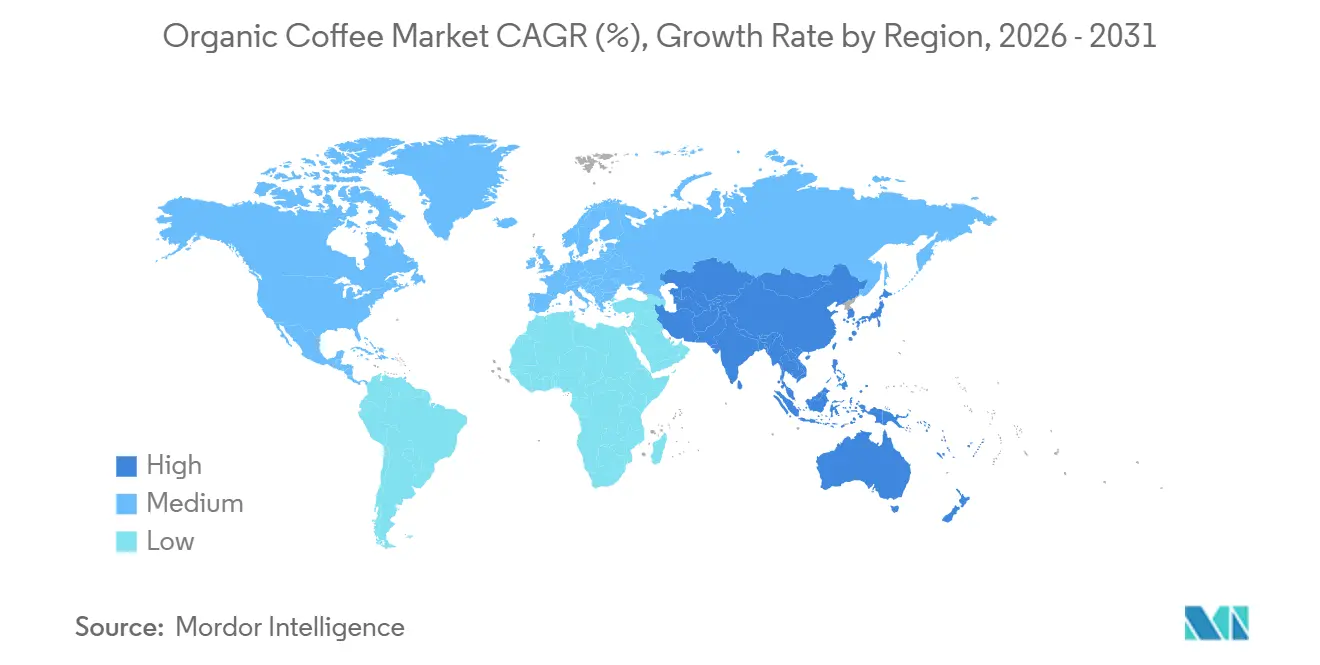
- By region, Europe held 34.90% of 2025 turnover; Asia–Pacific is the fastest-growing territory, advancing at a 9.62% CAGR.
Note: Market size and forecast figures in this report are generated using Mordor Intelligence’s proprietary estimation framework, updated with the latest available data and insights as of January 2026.
Market Trends and Insights
Drivers Impact Analysis of Organic Coffee Market*
| Driver | (~) % Impact on CAGR Forecast | Geographic Relevance | Impact Timeline |
|---|---|---|---|
| Premium-pricing acceptance in developed economies | +1.8% | North America, Western Europe, Australia | Medium term (2-4 years) |
| Government incentives expanding organic cultivation | +1.5% | Brazil, Colombia, Peru, Central America | Long term (≥ 4 years) |
| Growth of single-serve organic coffee formats | +1.9% | Global, led by the United States and the European Union | Short term (≤ 2 years) |
| Clean-label café menu adoption | +1.2% | Urban centers worldwide | Medium term (2-4 years) |
| Low-acid SKUs boosting specialty-retail demand | +0.9% | North America, Northern Europe | Short term (≤ 2 years) |
| On-trade outlets switching to 100% organic beans | +1.1% | Europe, North America, urban Asia–Pacific | Medium term (2-4 years) |
| Source: Mordor Intelligence | |||
Premium-pricing acceptance in developed economies
In 2025, consumers in the U.S., Canada, Germany, and France accepted 25-40% price premiums on organic products. According to the Center for the Promotion of Imports, 19% of German consumers in 2024 were willing to pay premium prices for organic-certified coffee, indicating a direct correlation between ethical sourcing and purchasing behavior [1]. This trend was bolstered by transparent supply-chain narratives and QR-code traceability initiatives introduced by Starbucks and Nestlé. Nestlé's organic Nespresso line achieved an 18% increase in average selling prices, yet maintained repeat purchases. This indicates a shift: consumers are now more inclined to pay for verification rather than viewing it as a niche rarity. Blockchain initiatives in 2,400 U.S. stores led to double-digit increases in organic attachment rates, underscoring the effectiveness of in-store digital prompts in converting certification stories into sales. Australia saw a similar pattern, with the Australian Bureau of Statistics noting a 22% rise in organic coffee retail turnover, driven by millennials' preference for Fair Trade and Rainforest Alliance certifications. Given the consistent price resilience, the narrowing price gap between organic and conventional roasts suggests a broader market potential for organic coffee in the coming years.
Government incentives expanding organic coffee cultivation
Brazil allocated BRL 500 million (USD 100 million) in subsidies to transform 50,000 hectares of conventional coffee into organic by 2028. This initiative, primarily in Minas Gerais and Espírito Santo, covers 70% of certification fees and mitigates transition risks for smallholders. In 2024, the Asian Development Bank extended a USD 100 million loan to ECOM Agroindustrial Corporation. This funding aims to cultivate climate-resilient coffee value chains in India, Indonesia, Papua New Guinea, and Vietnam, benefiting over 62,000 smallholder farmers[2]. Colombia and Peru implemented concurrent technical-assistance programs and expanded their inspector workforce, effectively halving accreditation lead times. These governmental initiatives are steering farmers towards formal organic certification, stabilizing supply curves in origin countries, and reducing the premium multinationals previously paid for certified beans. With a more abundant supply, vertically integrated roasters like JDE Peet’s, which secure multiyear supply contracts, can expect improved margin predictability. Additionally, a broader grower pipeline allows smaller craft roasters to access micro-lots, bypassing the large-lot minimums that typically advantage established players.
Growth of single-serve organic coffee formats
As lineups compatible with Keurig and Nespresso platforms enter mass distribution, pods and capsules are set to grow through 2031. Within just six months, Keurig Dr Pepper’s 12-SKU compostable range captured a 6% share of the U.S. single-serve organic segment, underscoring a strong demand for convenience alongside eco-friendly disposal options. Lavazza bolstered its aluminum capsule-recycling initiative in Italy and Spain by introducing over 1,200 municipal drop-off points, highlighting that a robust circular-economy infrastructure can mitigate consumer concerns about waste. In 2025, patent activity surrounding oxygen-barrier biopolymers surged by a third, signaling a competitive technological race within the industry to replicate aluminum-pod shelf life while ensuring compostability. The allure of convenience remains strong, even among eco-conscious consumers, suggesting that the industry will lean towards gradual material innovations instead of a complete shift back to bulk formats.
Clean-label café menu adoption
Municipal bans on single-use plastics, coupled with heightened consumer scrutiny over ingredient origins, are driving a shift towards clean-label menus in both independent cafés and global chains. Starbucks has committed to sourcing 20% of its total coffee volume from organic origins by 2027. In a move towards transparency, the coffee giant began highlighting cooperative names on its European menu boards in late 2025. The clean-label initiative, as exemplified by Starbucks, emphasizes both ingredient transparency and ethical sourcing. Starbucks proudly sources 99% of its coffee through its Coffee and Farmer Equity Practices[3]. In January 2026, Blue Bottle Coffee made a significant shift, transitioning its entire U.S. offerings to organic beans. This decision was backed by survey data indicating that 68% of its patrons associate organic certification with superior taste and ethical practices. The trend isn't limited to coffee; vendors of oat and almond milk are now required to present organic certificates to stay on approved supplier lists. Urban centers like Shanghai and Seoul witnessed a 30% surge in organic brew sales during 2025, underscoring the amplified reputational benefits of clean-label commitments in densely populated areas. These industry shifts are not just about meeting consumer demands; they're also about locking in future demand. As a result, exporters are now standardizing organic and traceability protocols to align with the rigorous requirements of multinational audits.
Restraints Impact Analysis of Organic Coffee Market*
| Restraint | (~) % Impact on CAGR Forecast | Geographic Relevance | Impact Timeline |
|---|---|---|---|
| Organic-grade fertilizer scarcity in Central America | -1.4% | Guatemala, Honduras, Nicaragua, Costa Rica | Short term (≤ 2 years) |
| Heightened consumer concern over caffeine intake | -0.8% | North America, Northern Europe | Medium term (2-4 years) |
| Substitution from functional RTD beverages | -0.6% | Global, led by U.S. and urban Asia | Short term (≤ 2 years) |
| Higher price volatility vs. conventional coffee | -0.7% | Global | Medium term (2-4 years) |
| Source: Mordor Intelligence | |||
Organic-grade fertilizer scarcity in Central America
In 2025, Guatemala, Honduras, and Nicaragua faced significant shortages of USDA-compliant compost, as the growth in organic acreage outstripped the region's composting capabilities. Despite Guatemala boosting its organic fertilizer imports by 45% year-over-year, the supply still fell short, meeting only 62% of local demand. This shortfall compelled local growers to stretch application intervals and settle for diminished yields. In Honduras, organic yields per hectare dropped by 12% in 2025 compared to 2024, a decline directly linked to delays in nutrient delivery during the crucial flowering stage. Meanwhile, the Costa Rican government, in a bid to bolster its biochar plants, aimed to add 15,000 metric tons of capacity by 2027. However, this intervention comes too late to avert immediate output declines. These ongoing nutrient bottlenecks threaten to trigger regional supply shocks, potentially widening the price gap between organic beans from Central and South America.
Heightened consumer concern over caffeine intake
Shoppers in North America and Northern Europe are cutting back on caffeine, particularly in the evenings, leading to a rise in the popularity of half-caf blends and herbal substitutes. Data from a 2025 survey by Canada's Heart & Stroke Foundation showed a notable increase: 37% of adults now limit their caffeine intake to one cup daily, a jump from 28% in 2023. This shift reflects growing health awareness and concerns about the potential negative effects of excessive caffeine consumption, such as sleep disturbances and increased heart rate. In response, specialty roasters are turning to naturally low-caffeine Arabica varieties like Laurina and Aramosa. However, these varieties face challenges due to their limited agronomic yield, which restricts large-scale production and availability. Retailers are broadening their offerings of organic decaf options. Yet, the solvent-free Swiss Water processing method, which inflates green-bean costs by 20-25%, tightens margins unless consumers are willing to pay a premium. If this trend solidifies, it may limit the growth potential for regular organic SKUs in established markets, as consumer preferences shift toward healthier and lower-caffeine alternatives.
*Our forecasts treat driver/restraint impacts as directional, not additive. The impact forecasts reflect baseline growth, mix effects, and variable interactions.
Organic Coffee Market Segment Analysis
By Origin:
Robusta Gains Ground on Espresso DemandBy 2025, Arabica is set to command a dominant 65.98% share of the global organic coffee market. Its supremacy is bolstered by premium offerings from high-altitude regions like Colombia and Ethiopia, known for their unique flavor profiles and assured traceability. Even with challenges like saturated cultivated acreage and rising climate threats, these regions consistently fetch premiums, ensuring specialty roasters remain profitable. Initiatives like blockchain traceability pilots, especially Colombia’s collaboration with IBM Food Trust, bolster buyer trust. Additionally, agronomy training programs backed by Latin American governments are refining cupping scores, solidifying Arabica’s status at the pinnacle of the premium organic market.
In contrast, Robusta is emerging as the organic coffee market's fastest-growing segment, with projections of a 10.87% CAGR through 2031. This surge is largely driven by intensified certification efforts from producers in Vietnam and Indonesia. European roasters are now tweaking their espresso blends, incorporating organic Robusta for its cost-effectiveness and richer crema. In 2025, with backing from Rainforest Alliance, Indonesia's Sulawesi and Sumatra regions expanded their certified Robusta acreage by 8,500 hectares. This swift certification expansion is paving the way for budget-friendly organic instant coffee, catering to Eastern Europe and Southeast Asia, where consumers prioritize value over single-origin tales. Such developments position Robusta as a crucial growth catalyst, diversifying the supply landscape while complementing Arabica's premium emphasis

By Product Form:
Pods and Capsules Reshape Household ConsumptionIn 2025, ground coffee dominated the organic coffee market, accounting for 34.87% of its total value. Its widespread appeal stems from its adaptability to various brewing devices and a strong consumer affinity for traditional preparation methods. While ground coffee's growth rate of 8% lags behind the surge of single-serve options, it remains a cornerstone for both retail and out-of-home sales worldwide. Whole-bean formats, commanding a 28% share, bolster their premium status, appealing to third-wave cafés and aficionados who relish grinding fresh beans at home. Yet, in North America, growth has slowed as the adoption of espresso machines stabilized, coinciding with the settling of hybrid work trends.
Pods and capsules have emerged as the quickest-growing segment, boasting an impressive 11.24% CAGR through 2031, driven by consumer demands for convenience and sustainability. The swift rise of compostable and bio-based capsule materials, like BASF’s polylactic-acid format, which is certified for industrial composting, has alleviated environmental worries without compromising on performance or shelf life. As more households embrace organic coffee, the audience is expanding from niche specialty drinkers to families in search of hassle-free brewing. Instant organic coffee is also riding this wave of convenience, especially in the Asia–Pacific region, where innovative freeze-dried products propelled South Korean sales by 34% in 2025. This collective momentum in single-serve formats is not only shifting value distribution within the category but also spurring innovation among suppliers.
By Packaging Format:
Jars Capture Premiumization WavePouches led the organic coffee packaging scene in 2025, capturing 43.37% of total sales. Their lightweight nature, resealability, and cost-effective shipping make them especially appealing for e-commerce, where breakage is a concern. Even with intensifying competition, pouches retain their top spot, bolstered by sustainable options and hybrid designs that enhance shelf appeal. In markets prioritizing efficiency, exporters and major retailers alike favor these flexible formats. Ongoing advancements in recyclable and mono-material films further solidify pouches' status, even amidst a trend towards premiumization.
Jars are the packaging format on the rise, boasting a 12.56% CAGR as consumers increasingly associate glass with artisanal quality and reusability. Brand initiatives have fueled this momentum, exemplified by JDE Peet’s 2025 glass-jar debut, which captured 9% of the U.S. premium organic market in just four months, all while commanding an 18% price premium. Starbucks’ jar-return initiative highlighted the model's loyalty potential, achieving a notable 22% repeat purchase rate with a USD 2 refill incentive. In Germany, sales of embossed glass jars jumped 41% year on year, driven by small roasters aiming for a unique shelf presence. This uptick underscores how aesthetic allure and circular packaging efforts are transforming jars from a niche choice to a key growth driver.
By Distribution Channel:
Off-Trade Gains on Direct-to-Consumer ModelsIn 2025, on-trade channels dominated the organic coffee market, capturing 76.83% of total sales. This stronghold is bolstered by entrenched café cultures in countries like Italy and Japan, where traditions such as espresso bars and kissaten play pivotal roles in daily consumption. Demand is further amplified by hotels, restaurants, and specialty cafés, all of which feature premium organic beverages on their menus. While convenience stores have limited space and often prioritize functional ready-to-drink options, they struggle to accommodate high-priced organic formats. Consequently, despite evolving consumer habits, on-trade channels remain central to organic coffee consumption.
Off-trade channels are emerging as the fastest-growing segment, boasting a 7.98% CAGR, fueled by the rapid ascent of online grocery shopping, home delivery, and subscription services. In 2025, U.S. e-commerce sales of organic coffee surged by 16%, with Shopify-backed storefronts enabling small roasters to achieve impressive 60–70% gross margins through direct shipments to households. Supermarkets played a pivotal role in enhancing category visibility, with notable expansions in organic shelf space at Whole Foods by 12% and Carrefour by 9%. Subscription platforms showcased their prowess by keeping churn rates below 4% monthly, thanks to curated rotating micro-lots and compelling storytelling content that fostered customer loyalty. This broader diversification across both retail and digital avenues not only helps brands tap into new consumer occasions but also acts as a buffer against the volatility of on-trade channels.
Geography Analysis
Europe Organic Coffee Market
In 2025, Europe accounted for 34.90% of global revenue, largely due to Germany and the Netherlands acting as re-export hubs, channeling beans from Latin America and Africa to the wider EU. Germany and the Netherlands leveraged their advanced logistics infrastructure and strategic geographic positioning to dominate re-export activities. Specialty cafés in the UK and France expanded their menus to include innovative offerings such as single-origin brews and plant-based milk options, catering to evolving consumer preferences. Meanwhile, Italy, drawing on its espresso legacy, popularized organic blends in independent bars, further solidifying its reputation as a coffee culture leader. Compliance lapses with the EUDR caused spot-price fluctuations, momentarily tightening supply. This led to a high-single-digit increase in café menu prices but also heightened consumer awareness regarding traceability, encouraging more informed purchasing decisions.
APAC Organic Coffee Market
Asia-Pacific is on a growth trajectory, boasting a 9.62% CAGR. This surge is bolstered by China, which introduced over 1,200 specialty cafés in Shanghai in 2025, reflecting the growing urban demand for premium coffee experiences. India’s modern trade shelf resets expanded organic SKUs by 28%, driven by increasing health consciousness and the rising availability of organic products in urban retail outlets. Japan saw a 14% rise in imports, driven by third-wave roasters in Tokyo and Osaka, who prioritized single-origin transparency to meet the demands of discerning coffee enthusiasts. In South Korea, the instant organic segment thrived due to its convenience appeal, particularly among busy urban professionals. Meanwhile, Australia experienced a 22% retail growth, fueled by millennials' preference for Fair Trade-verified products, as sustainability and ethical sourcing became key purchasing factors.
The Americas and MEA Organic Coffee Market
North America commanded a 28% share in 2025, with the U.S. accounting for a dominant 82% of the region's turnover. Retail giants like Whole Foods, Costco, and Trader Joe’s bolstered consumer choices by introducing direct-trade lines from Central America, which emphasized ethical sourcing and quality. A significant milestone was reached in Q3 2025 when online sales surpassed foodservice for the first time, enhancing price transparency and driving subscription growth. This shift was fueled by the convenience of e-commerce platforms and the growing popularity of subscription models offering curated coffee selections. South America, with a 12% share of global sales, witnessed a shift: domestic consumption in Brazil and Colombia now matches export growth, as the middle class increasingly opts for organic labels. This trend reflects a broader shift in consumer behavior, with local shoppers prioritizing quality and sustainability. The Middle East and Africa, though representing only 8% of the total, showcase vigorous growth in the UAE and South Africa, highlighted by a surge in re-export and private-label initiatives. These regions benefited from increasing investments in coffee processing facilities and the rising popularity of private-label brands among cost-conscious consumers.
Regulatory Landscape
The regulatory environment for organic coffee increasingly reflects how organic certification rules intersect with supply-chain due diligence and traceability requirements in major consuming markets. In the United States, the USDA National Organic Program (NOP) Strengthening Organic Enforcement (SOE) final rule was fully implemented on March 19, 2024, tightening oversight by requiring certification coverage across organic handlers and reinforcing import and traceability controls. For EU market entry, organic coffee shipments continue to rely on electronic Certificates of Inspection via the European Commission TRACES system, while the EU-US Organic Equivalence Arrangement supports cross-border trade for products meeting both control systems.
In Europe, the EU Deforestation Regulation (EUDR, Regulation (EU) 2023/1115) creates an added compliance layer beyond organic. It requires deforestation-free verification, due diligence statements, and plot geolocation (including polygon mapping for coffee plots above 4 hectares). The European Commission issued additional guidance in July 2026 to clarify operator and trader obligations, with application dates set for December 30, 2026 for large and medium operators, and June 30, 2027 for micro and small undertakings. For organic coffee exporters and importers, this pushes wider adoption of digital traceability systems and reinforces the role of cooperatives and traders that can aggregate farm-level data to maintain EU channel access.
Competitive Landscape
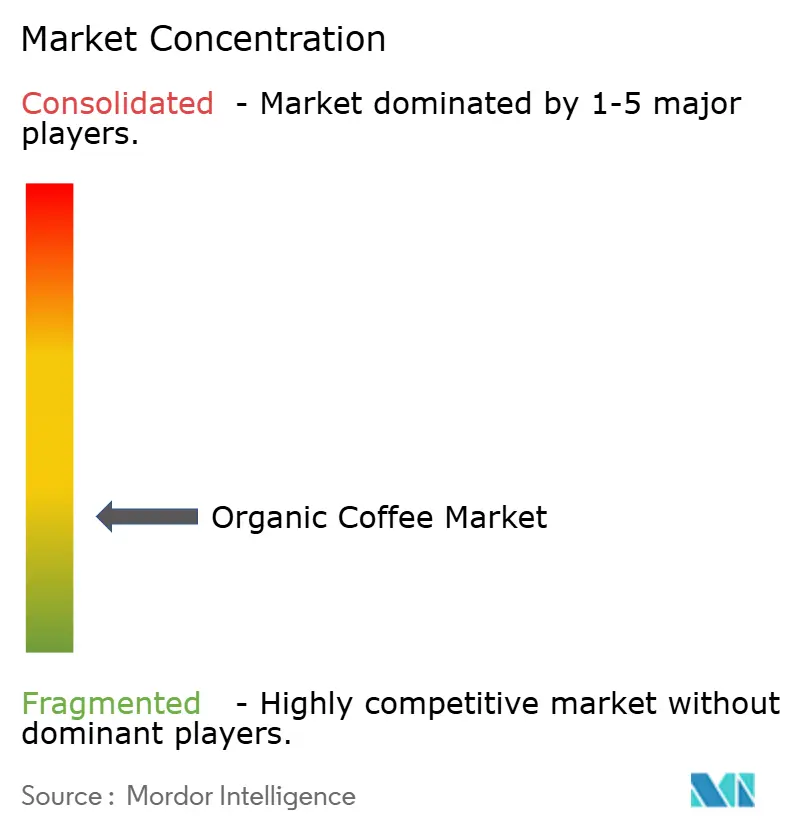
The organic coffee market is moderately concentrated. Global giants like Nestlé, JDE Peet’s, and Starbucks share the stage with regional craft players and vertically integrated cooperatives. Nestlé's acquisition of Blue Bottle's sourcing network reduced its dependence on commodity exchanges, yielding a 15% savings in procurement costs projected through 2028. This strategic move not only enhances cost efficiency but also strengthens control over supply chain operations, ensuring consistent quality and sustainability. Operational since December 2025, JDE Peet's EUR 45 million wet-mill in Guatemala offers oversight from bean to bag, cutting shipment lead times to Europe from three weeks to just five days. This facility enables the company to streamline its production process, improve product freshness, and respond more quickly to market demands. In a move emphasizing transparency, Starbucks and IBM introduced blockchain technology in 3,200 European outlets, allowing consumers to scan and access farm data. This initiative positions transparency as a key differentiator, fostering consumer trust and loyalty.
Technology start-ups are heightening the competition: Driftaway Coffee, utilizing IBM Food Trust, highlights roast dates and farmer profiles, prioritizing subscription freshness over traditional branding. This approach appeals to a growing segment of consumers who value freshness and traceability over legacy brand recognition. Smaller roasters, through accelerated patents on nitrogen-flushing for compostable pods, now match the shelf life of aluminum capsules, diminishing the advantages held by larger incumbents. This technological advancement levels the playing field, enabling smaller players to compete effectively in terms of product longevity. Retail prices are under pressure as supermarket private labels captured 18% of organic unit sales in 2025, up from 14% in 2024. This surge has pushed branded players to bolster investments in digital loyalty programs, exclusive micro-lots, and café events. These strategies aim to enhance customer engagement and differentiate branded products in an increasingly competitive market.
In the Asia-Pacific region, a lack of supply-chain transparency has allowed niche players to flourish by establishing direct-trade agreements, bypassing European importers. However, these players struggle with brand building due to limited scale, which restricts their ability to expand market presence and compete with larger players. Central American cooperatives are increasingly collaborating with ESG funds for organic transitions, securing advance purchase contracts that guarantee minimum price floors. These partnerships provide financial stability for cooperatives, enabling them to invest in sustainable farming practices and meet the growing demand for organic coffee. In summary, the industry's strategic focus is on vertical integration, traceability technology, and premium segmentation to maintain pricing power amidst growing private-label competition. These strategies are critical for navigating the evolving market dynamics and sustaining long-term growth.
Organic Coffee Industry Leaders
-
JDE Peet’s N.V.
-
Nestlé S.A.
-
Keurig Dr Pepper Inc.
-
Starbucks Corporation
-
Luigi Lavazza S.p.A.
- *Disclaimer: Major Players sorted in no particular order
Organic Coffee Market Companies Covered in this Report
- JDE Peet's N.V.
- Nestle S.A.
- Keurig Dr Pepper Inc.
- Starbucks Corporation
- Luigi Lavazza S.p.A.
- Kicking Horse Coffee Co.
- Ecotone
- Tru Bru Coffee
- Burke Brands (Don Pablo)
- Rogers Family Co. (Organic Coffee Co.)
- Death Wish Coffee Co.
- Jim's Organic Coffee
- Dean's Beans Organic Coffee Co.
- Volcanica Coffee
- Camano Island Coffee Roasters
- Ethical Bean Coffee
- Fresh Roasted Coffee LLC
- West Berkshire Roastery
- Balance Coffee LTD.
- Cafe direct Group (Grumpy Mule)
Market Opportunities and Future Outlook
Multi-standard certification and expanded traceability capabilities are creating room for origin-side suppliers that can support multiple premium destination requirements through a single supply program. In February 2026, VinaCoffee Group reported achieving triple organic certification (USDA NOP, EU Organic, and JAS) across 3,200 hectares of Robusta farms in Dak Lak, Vietnam. This example underscores how origin investments can support broader market access and aligns with the broader shift toward organic Robusta certifications in Vietnam and Indonesia. Regenerative positioning is also appearing as a distinct pathway within organic: Pachamama Coffee announced Regenerative Organic Certified (ROC) status for its Peru and Machu Picchu coffees in February 2026, and Cooxupe partnered with Gold Standard in May 2026 to enable commercialization of carbon credits from pilot regenerative coffee farming practices in Brazil, linking farm practice upgrades with new revenue mechanisms.
Downstream, investments in processing and roasting capacity, along with sustainability-focused process upgrades, point to opportunities tied to single-serve formats and soluble or instant, as well as private label and foodservice procurement that require consistent quality and auditability. Lower-carbon operations also factor into procurement decisions where verification and segregation are necessary. Luckin Coffee commissioned a USD 440 million smart roasting center in Qingdao in April 2026, and Melitta Group announced a EUR 100 million investment at its Bremen roastery in May 2026 to raise capacity by 50% over six years using advanced process control and sustainability systems. In soluble coffee, Trung Nguyen Legend broke ground on an USD 83.6 million instant coffee hub in Dak Lak in June 2026 designed around renewable energy and circular water use. Nestle also announced a CHF 563 million AI-enabled Nescafe production and distribution hub in Samut Prakan, Thailand (July 2026), reinforcing the shift toward digitalized, higher-throughput manufacturing and distribution that can support organic-certified lines where supply verification needs to be sustained.
Recent Industry Developments in Organic Coffee Market
- April 2026: Keurig Dr Pepper finalized the acquisition of 96.22% of JDE Peet's shares and outlined a plan to separate into Beverage Co. and Global Coffee Co. by end-2026. The acquisition consolidates coffee procurement and manufacturing scale, improving the ability to standardize sourcing programs, including certified offerings such as organic. It also shifts competitive dynamics for branded and private-label roasters through combined distribution reach.
- September 2025: Nespresso announced its first coffee certified regenerative by the Rainforest Alliance, with products carrying the new seal beginning to appear in 2026. The certification expands premium sustainability claims that can sit alongside organic positioning at retail and in single-serve formats. It also raises the bar for competitors seeking verified environmental attributes beyond baseline certification.
- February 2024: Nespresso Professional expanded its Origins Organic lineup with the launch of a Brazil Organic capsule sourced from the Cerrado Mineiro, Minas Gerais, and Sao Paulo regions under the Nespresso AAA Sustainable Quality Program. The addition strengthened single-origin organic availability in the professional channel, supporting on-trade and workplace demand for certified products. It also reinforced continued innovation in organic pods and capsules, a faster-growing product form within the category.
Organic Coffee Market Report Scope and Research Methodology
Market Definition and Coverage
For this study, the organic coffee market covers coffee products that are produced and sold under recognized organic farming standards, and then traded through both retail and foodservice channels in value terms.
Scope exclusions: Conventional coffee, uncertified coffee marketed only as natural, and non-coffee caffeine beverages are excluded from this market sizing.
Segments Covered in This Report
- By Origin
- Arabica
- Robusta
- By Product Form
- Whole Bean
- Ground
- Instant
- Pods/Capsules
- By Packaging Format
- Sachets
- Pouches
- Jars
- By Distribution Channel
- On-Trade
- Off-Trade
- Supermarkets/Hypermarkets
- Convenience/Grocery Stores
- Online Retail
- Other Off-Trade Channels
- By Geography
- North America
- United States
- Canada
- Mexico
- Rest of North America
- Europe
- Germany
- France
- United Kingdom
- Spain
- Netherlands
- Italy
- Sweden
- Poland
- Belgium
- Rest of Europe
- Asia-Pacific
- China
- India
- Japan
- Australia
- South Korea
- Indonesia
- Thailand
- Singapore
- Rest of Asia-Pacific
- South America
- Brazil
- Argentina
- Chile
- Colombia
- Peru
- Rest of South America
- Middle East and Africa
- United Arab Emirates
- South Africa
- Nigeria
- Saudi Arabia
- Egypt
- Morocco
- Turkey
- Rest of Middle East and Africa
- North America
Data Sources, Market Sizing, and Validation
Desk Research
Desk research was used to establish the factual base for the model and to keep definitions consistent for organic certification and coffee trade flows. We relied on public sources such as FAOSTAT, ITC Trade Map style import-export statistics, USDA organic materials and coffee-related publications, and ICO statistical releases to map production, consumption, and trade direction.
To add commercial context, we also reviewed company annual reports and investor presentations, reputable press coverage, and updates from certification bodies and coffee trade associations. A paid subscription focused on company financials and news was used selectively to cross-check reported revenue exposure and expansion activity, and patent database scans helped confirm packaging and processing shifts that can change product mix. These examples are not exhaustive, and other public sources were used for data collection, validation, and clarification during the work.
Primary Interviews and Surveys
Primary discussions were run with stakeholders across the organic coffee value chain, including farmers and cooperatives, processors, traders, roasters, distributors, and channel specialists, so pricing and channel shares could be checked in practical terms. Since this is a global market, we also balanced views across major demand regions and key sourcing corridors, and then used the inputs to close data gaps and confirm assumptions that could not be resolved from public sources alone.
Distribution of primary research fieldwork respondents
| Company type | Respondent position | Region |
|---|---|---|
| Top tier: 38% | CXOs: 16% | APAC: 51% |
| Mid tier: 43% | Functional/Unit leaders: 35% | EMEA: 29% |
| Smaller Players: 19% | Managers: 49% | Americas: 20% |
Market-Sizing & Forecasting
The core build starts from a top-down demand pool, where overall coffee consumption and trade series are reconstructed by region and then filtered to the organic share based on certification penetration and channel availability. To keep the totals realistic, we corroborate the results with selective bottom-up approximations, including sampled price points by product form and packaging, and sanity checks on channel level sales mix from interviews.
Key inputs in the market model include organic certified coffee production and export trends, retail and foodservice channel split, product form mix (whole bean, ground, instant, pods or capsules), packaging shifts (pouches, jars, sachets), and observed price premiums for organic versus conventional coffee. When a country-level data series is incomplete, proxy indicators like nearby trade flows and consumption patterns are used first, and then corrected through expert feedback so the gap does not distort regional totals. For forecasting, we used multivariate regression supported by scenario checks, where demand growth is linked to variables such as coffee consumption growth, organic adoption rates, and expected organic price premium movement that was validated through primary calls.
Data Validation & Update Cycle
Outputs are validated through repeated cross-checks, so the market value aligns with independent signals such as production and trade direction, channel level shifts, and realistic price bands. If a country or channel result looks off, it is flagged for analyst review, assumptions are revisited, and the related primary respondents may be re-contacted to confirm what changed.
Before sign-off, the model goes through multi-step reviews that focus on variance checks by region and year-on-year growth consistency, plus whether the final totals match the stated market scope. The report is refreshed annually, and interim updates are done when a material event affects pricing, certification rules, trade, or supply availability. Right before delivery, a final pass is completed so clients receive the latest updated view.
Mordor Intelligence's Organic Coffee Market Size Measured Against Other Published Estimates
Published market sizes for organic coffee often do not match because scope boundaries are set differently, and because not every publisher treats channels and product forms in the same way. The year used as the current estimate also matters, since coffee prices and organic premiums can move quickly and shift the value base.
The main gap drivers usually come from whether on-trade is counted fully, how pods or capsules are treated, and whether the sizing leans more on trade and consumption signals or more on limited brand sampling. Trade flow direction, organic certification footprint, and channel mix checks are the evidence points that anchor the 2026 estimate in Mordor Intelligence's model, which is why some 2024 based figures look lower even when the growth story is similar.
Benchmark comparison
| Source | Market Size | Gaps in Research Methodology |
|---|---|---|
| Mordor Intelligence | USD 8.73 B (2026) | |
| Global Consultancy A | USD 7.92 B (2024) | Uses an earlier base year and can understate the current value if organic price premiums and channel mix moved up after 2024, especially when on-trade recovery is not fully reflected in the same way. |
| Industry Publisher B | USD 7.01 B (2024) | Appears to apply a narrower value build for 2024, which can happen when organic penetration assumptions are conservative across regions and when product form coverage is not consistently expanded to pods or capsules in the totals. |
Across the three figures, most of the spread is explained by the year selected for the stated market size and how the organic share and channel coverage are applied. By keeping the scope rules explicit and then checking them against trade, certification, and pricing signals, the estimate stays traceable to clear inputs that can be revisited and updated.
Key Questions Answered in the Report
What is the forecast size of the organic coffee market by 2031?
The organic coffee market size is expected to reach USD 14.12 billion by 2031, expanding at a 10.09% CAGR from 2026 to 2031.
Which origin currently leads volume sales?
Arabica retains volume leadership at 65.98% of 2025 shipments, although Robusta is the faster-growing origin.
How fast are pods and capsules growing?
Single-serve pods and capsules are advancing at an 11.24% CAGR through 2031, the quickest pace among all product forms.
Which region shows the highest growth momentum?
Asia–Pacific is the fastest-growing geography, recording a 9.62% CAGR through 2031 on rapid café expansion in China and India.