
Organic Beverage Market Size and Share
Market Overview
| Study Period | 2021 - 2031 |
|---|---|
| Market Size (2026) | USD 26.48 Billion |
| Market Size (2031) | USD 36.86 Billion |
| Growth Rate (2026 - 2031) | 6.85 % |
| Fastest Growing Market | Asia Pacific |
| Largest Market | North America |
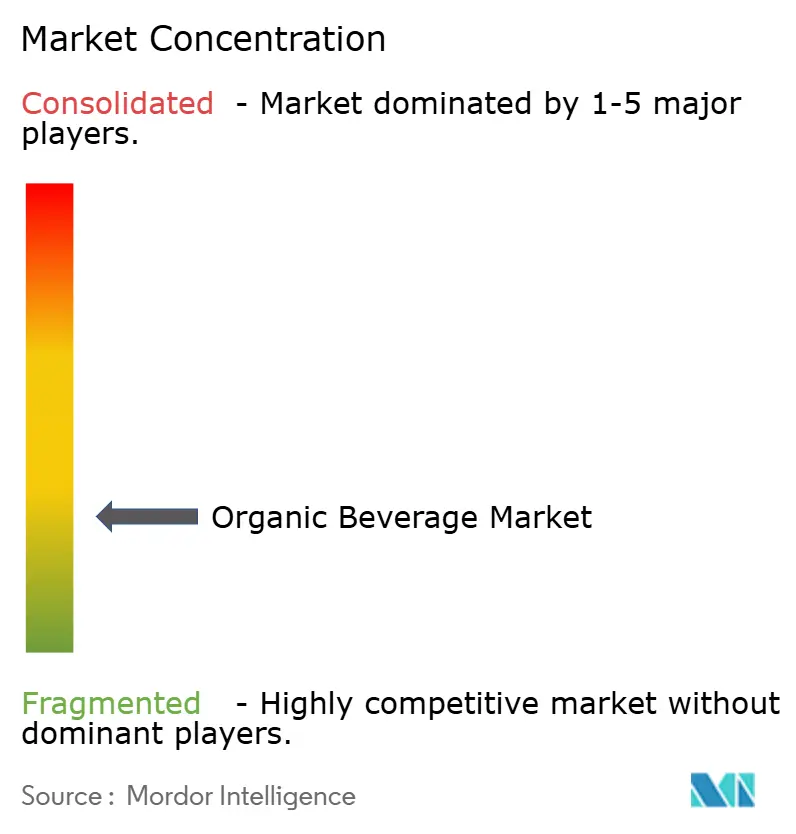
| Market Concentration | Low |
Major Players *Disclaimer: Major Players sorted in no particular order Image © Mordor Intelligence. Reuse requires attribution under CC BY 4.0. | |
Organic Beverage Market Analysis by Mordor Intelligence
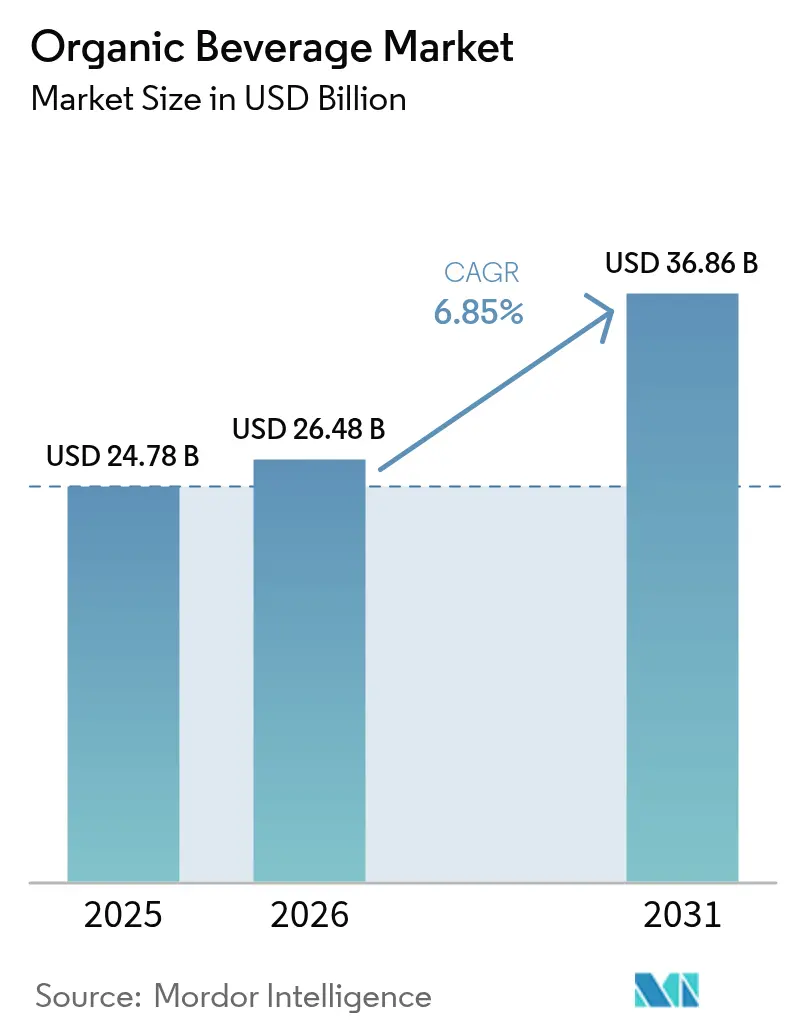
The organic beverage market size in 2026 is estimated at USD 26.48 billion, growing from 2025 value of USD 24.78 billion with 2031 projections showing USD 36.86 billion, growing at 6.85% CAGR over 2026-2031. Growth rests on a structural shift in consumer priorities toward certified-organic formulations that avoid synthetic additives. PepsiCo’s USD 1.95 billion purchase of Poppi in March 2025 confirms that functional sodas once confined to specialty stores have become strategic for global conglomerates. Regulatory tightening in producer nations, especially India’s eighth-edition National Programme for Organic Production (NPOP), is unlocking export opportunities for certified suppliers while raising compliance hurdles for late adopter. Packaging innovation is accelerating demand; bottles still led volumes in 2024, yet pouches and sachets are eroding that lead owing to lower carbon footprints and portion-controlled convenience. Online retail, propelled by direct-to-consumer models and rapid-commerce apps, is now the fastest growing distribution channel.
Key Report Takeaways
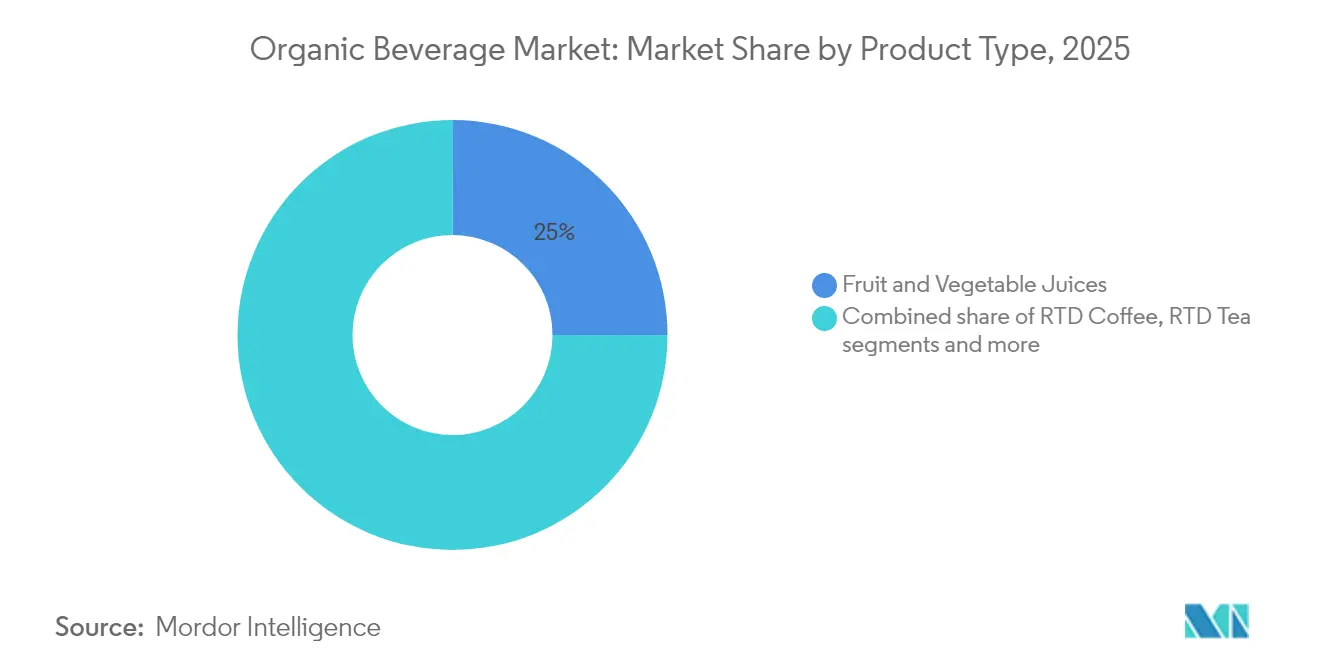
- By product type, fruit and vegetable juices accounted for 24.96% market share in 2025; functional drinks led with an 8.29% CAGR through 2031, outpacing the organic beverage market average.
- By packaging type, bottles retained 43.92% of share in 2025, while pouches and sachets are expanding at a 8.75% CAGR through 2031.
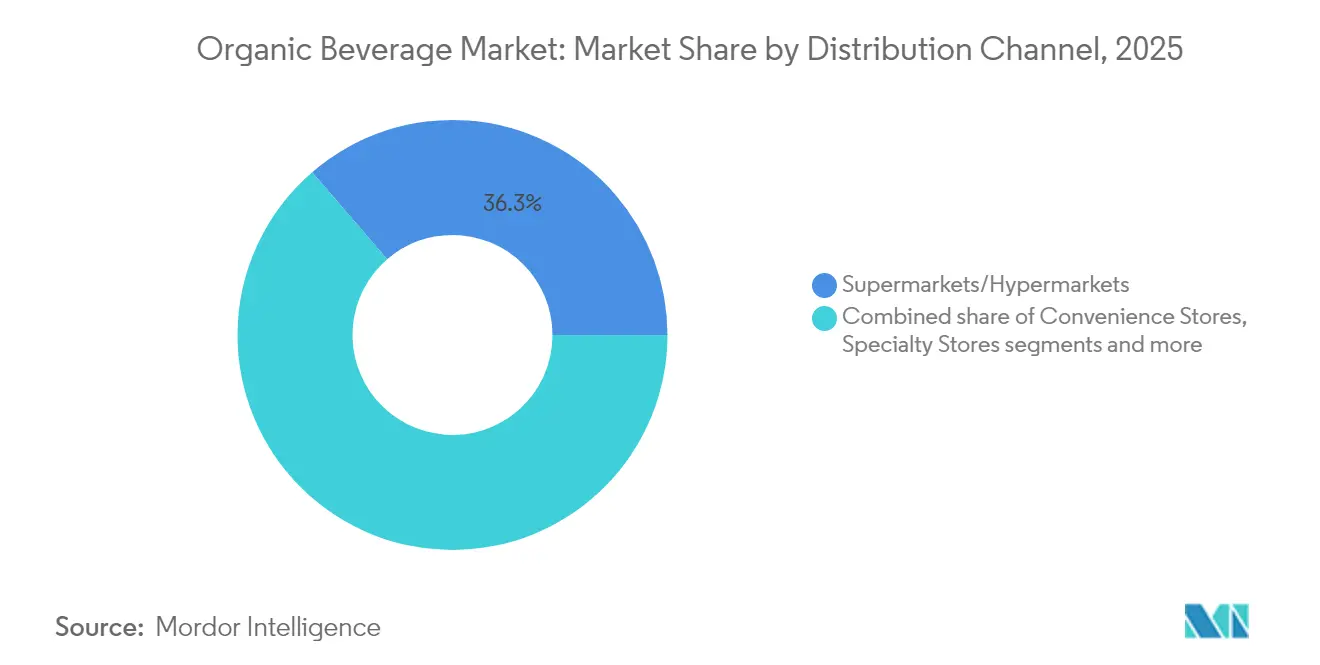
- By distribution channel, supermarkets and hypermarkets held 36.32% organic beverage market share in 2025; online retail posts the highest projected CAGR at 8.96% through 2031.
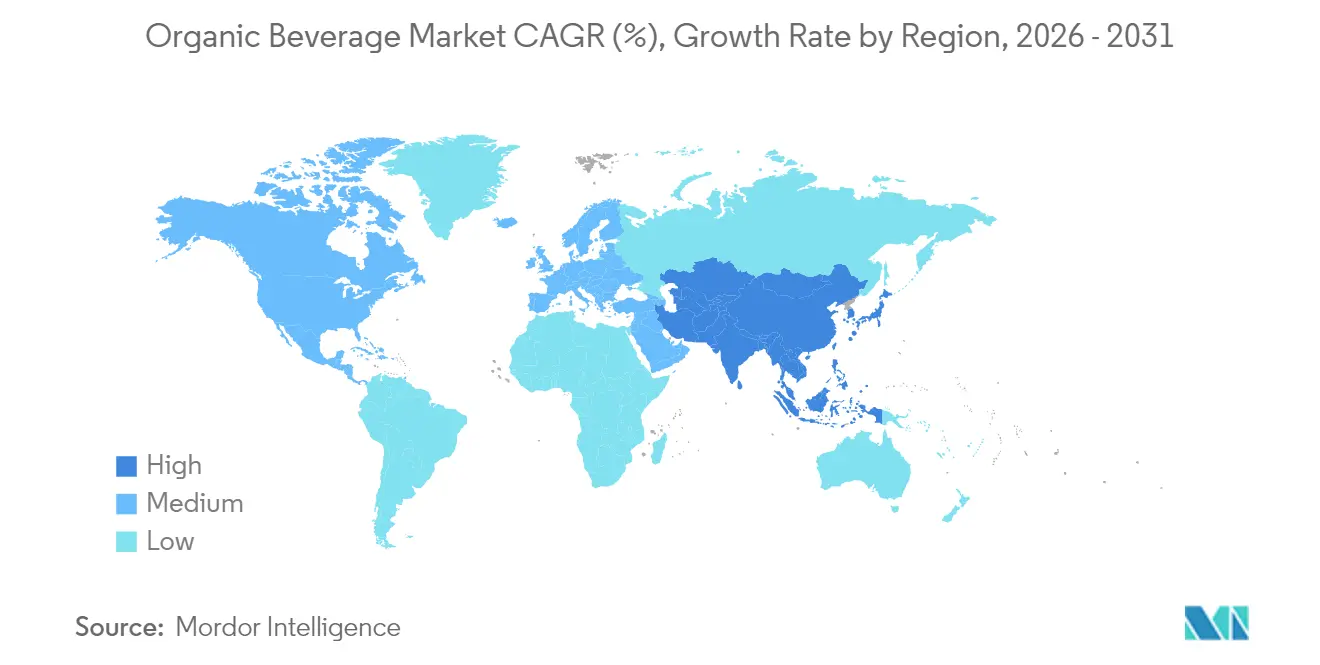
- By geography, North America captured 35.41% of value in 2025, and Asia-Pacific is forecast to register the fastest regional CAGR at 7.53% through 2031.
Note: Market size and forecast figures in this report are generated using Mordor Intelligence’s proprietary estimation framework, updated with the latest available data and insights as of 2026.
Market Trends and Insights
Drivers Impact Analysis of Organic Beverage Market*
| Driver | (~) % Impact on CAGR Forecast | Geographic Relevance | Impact Timeline |
|---|---|---|---|
| Rising health and wellness consciousness and desire to avoid synthetic additives and pesticides | +1.5% | Global, with strongest uptake in North America, Western Europe, and urban Asia-Pacific | Medium term (2-4 years) |
| Increasing preference for natural, clean-label products | +1.2% | North America and Europe core, expanding to Asia-Pacific urban centers | Short term (≤ 2 years) |
| Growth in plant-based, functional, and fortified drinks (probiotics, herbal, non-dairy) | +1.8% | Global, with rapid adoption in Asia-Pacific and North America | Medium term (2-4 years) |
| Supportive government initiatives and certifications promoting organic farming and products | +0.9% | Asia-Pacific (India, China), Europe, North America | Long term (≥ 4 years) |
| Strong marketing, social media influence, and brand positioning around "organic" and "natural" | +0.8% | Global, particularly North America and Europe | Short term (≤ 2 years) |
| Product innovation in flavors, ingredients, and formats tailored to specific lifestyle needs | +1.3% | Global, with early gains in North America, Western Europe, and Australia | Medium term (2-4 years) |
| Source: Mordor Intelligence | |||
Rising health and wellness consciousness and desire to avoid synthetic additives and pesticides
Rising health and wellness consciousness drives the organic beverage market as consumers increasingly prioritize natural products free from synthetic additives and pesticides. This shift reflects growing awareness of long-term health risks associated with chemical residues in conventional beverages, prompting demand for certified organic alternatives. According to the Organic Trade Association, 90% of Generation Z consumers (ages 13-28) identify as committed or new organic consumers, accelerating this trend through their influence on purchasing decisions and social media advocacy [1]. Parents particularly seek organic juices and teas for children to minimize exposure to harmful substances during critical developmental stages. Wellness trends amplify this preference, positioning organic beverages as functional options supporting immunity, hydration, and detoxification. Moreover retail expansion of organic sections and premium pricing tolerance underscore the segment's robust growth trajectory fueled by health-driven purchasing decisions.
Increasing preference for natural, clean-label products
Increasing preference for natural, clean-label products propels the organic beverage market as consumers reject artificial preservatives, colors, and flavors prevalent in conventional offerings. This demand stems from heightened scrutiny of ingredient lists, with shoppers favoring transparency and minimal processing in juices, teas, and functional drinks. According to research by CBI Ministry of Foreign Affairs, clean-label products are projected to constitute over 70% of portfolios in 2025 and 2026, increasing from 52% in 2021[2], underscoring the rapid portfolio shift among manufacturers. Clean-label positioning enables premium pricing, as organic certifications signal purity and authenticity to discerning buyers. Younger demographics, particularly millennials and Gen Z, drive this shift through social media influence and ethical consumption values. Retailers respond by expanding organic aisles and highlighting "no additives" claims to capture market share.
Growth in plant-based, functional, and fortified drinks (e.g., probiotics, herbal, non-dairy)
Growth in plant-based, functional, and fortified organic drinks such as probiotics, herbal infusions, and non-dairy alternatives fuels the organic beverage market amid rising demand for health-enhancing options. Consumers seek beverages delivering targeted benefits like gut health, immunity boosting, and stress relief through natural botanicals and superfoods. Plant-based variants, including almond and oat milks, capture share from traditional dairy as lactose intolerance and veganism rise globally. Fortified formulations with vitamins, adaptogens, and nootropics appeal to wellness enthusiasts prioritizing preventive nutrition. This diversification expands category appeal beyond juices into RTD teas and kombuchas with premium pricing power. Manufacturers leverage organic certification to differentiate in crowded functional aisles. The segment's innovation drives double-digit growth, reshaping retail landscapes with expanded shelf space.
Supportive government initiatives and certifications promoting organic farming and products
Supportive government initiatives and certifications promoting organic farming accelerate the organic beverage market by providing financial incentives, subsidies, and standardized labeling that build consumer trust. In the United States, the USDA's Organic Transition Initiative earmarked USD 300 million to assist farmers in transitioning to organic practices, complemented by an additional USD 20 million from the Organic and Transitional Education and Certification Program to alleviate certification costs[3]. Programs like USDA Organic, EU Organic Regulation, and national schemes in Asia-Pacific reduce production costs for farmers while ensuring traceability from farm to bottle. These policies expand certified acreage for key crops like fruits, herbs, and tea leaves, stabilizing supply chains for juice and RTD producers. Import/export facilitations under organic equivalence agreements boost cross-border trade, particularly for premium exports from emerging markets. Certifications signal quality and sustainability, justifying premium pricing and appealing to eco-conscious buyers.
Restraints Impact Analysis of Organic Beverage Market*
| Restraint | (~) % Impact on CAGR Forecast | Geographic Relevance | Impact Timeline |
|---|---|---|---|
| Higher production and raw material costs leading to premium shelf prices | -1.1% | Global, with acute pressure in North America and Western Europe | Medium term (2-4 years) |
| Stringent organic certification, labeling rules, and compliance overheads | -0.6% | Global, particularly Europe, North America, and India | Long term (≥ 4 years) |
| Price sensitivity in mass-market consumer segments limiting penetration | -0.9% | Emerging markets in Asia-Pacific, South America, and Middle East and Africa | Short term (≤ 2 years) |
| Risk of inconsistent quality or contamination issues eroding consumer trust | -0.5% | Global, with heightened scrutiny in North America and Europe | Medium term (2-4 years) |
| Source: Mordor Intelligence | |||
Higher production and raw material costs leading to premium shelf prices
Higher production and raw material costs pose a significant restraint to the organic beverage market, contributing to premium shelf prices that can limit consumer accessibility. Organic farming demands stringent practices, including pesticide-free cultivation, crop rotation, and certification processes, which increase input costs compared to conventional agriculture. These costs are further amplified by lower yields, labor-intensive harvesting, and specialized processing techniques that preserve organic integrity. Supply chain complexities, such as limited raw material availability and enhanced quality controls, also drive up expenses. As a result, organic beverages often carry higher retail price points, potentially deterring price-sensitive consumers despite growing health awareness. Retailers face challenges balancing premium pricing with mainstream demand while manufacturers contend with cost pressures affecting margins.
Stringent organic certification, labeling rules, and compliance overheads
Stringent organic certification, labeling rules, and compliance overheads restrain the organic beverage market by imposing rigorous documentation, audits, and traceability requirements that elevate operational costs. Producers must adhere to standards like USDA Organic or EU Organic, involving annual inspections, soil testing, and prohibited substance residue monitoring, which delay market entry for new entrants. Labeling mandates demand precise claims verification, allergen disclosures, and origin tracing, complicating packaging design and increasing regulatory risks. Non-compliance penalties, including product recalls or certification revocation, deter smaller manufacturers with limited resources. These barriers fragment supply chains, as only certified farms qualify, limiting raw material sourcing flexibility. International trade faces additional hurdles from varying regional standards, hindering exports.
*Our forecasts treat driver/restraint impacts as directional, not additive. The impact forecasts reflect baseline growth, mix effects, and variable interactions.
Organic Beverage Market Segment Analysis
By Product Type:
Functional Drinks Lead Innovation WaveFruit and vegetable juices held the largest market share in the organic beverage market in 2025, accounting for 24.96% of the total market value. This segment's dominance underscores its role as the foundational category driving organic beverage adoption among consumers. Its long-standing popularity stems from widespread consumer trust in the nutritional benefits and natural qualities of fruit and vegetable juices. Many consumers view these juices as a primary entry point into organic products due to their established presence in the market. The consistent demand has been sustained by increasing awareness around health and wellness, as well as the clean-label appeal of these products.
In contrast, functional drinks represent the fastest-growing segment within the organic beverage market, expanding at a robust compound annual growth rate (CAGR) of 8.29% through 2031, outpacing all other product types. This rapid growth is driven by rising consumer interest in beverages that offer additional health benefits such as enhanced immunity, energy, and digestive support. Functional drinks benefit from innovation in ingredients and formulations, integrating botanicals, probiotics, and adaptogens to cater to evolving consumer wellness trends. The segment’s expansion is further accelerated by increased marketing efforts and availability across diverse retail channels. Functional beverages appeal particularly to health-conscious consumers seeking convenience without compromising nutritional value.

By Packaging Type:
Flexible Formats Gain GroundBottles dominated the organic beverage market's packaging segment in 2025, capturing 43.92% of the total packaging volume. This substantial share reflects the enduring legacy of glass and PET materials, which have long been staples in premium beverage categories. Glass bottles, in particular, convey a sense of luxury and quality preservation, appealing to consumers who prioritize authenticity in organic products. PET bottles offer practicality through lightweight design and recyclability, further solidifying their position in retail and distribution channels. The dominance of bottles is also supported by established supply chains and consumer familiarity with traditional packaging formats. Overall, bottles continue to lead as the preferred choice, balancing tradition with functionality in the organic beverage landscape.
Meanwhile, pouches and sachets are surging ahead as the fastest-growing packaging format in the organic beverage market, achieving a compound annual growth rate (CAGR) of 8.75% through 2031, surpassing all other options. This rapid expansion is fueled by their convenience, portability, and suitability for on-the-go consumption lifestyles. Pouches appeal to eco-conscious consumers with their potential for reduced material use and better recyclability compared to rigid formats. Sachets enable single-serve portions, ideal for trial purchases and emerging markets with price-sensitive buyers. Innovation in flexible packaging technology enhances shelf life and product freshness, driving adoption across diverse organic beverage types. This growth trajectory signals a shift toward more agile, consumer-centric packaging solutions in the evolving organic beverage sector.
By Distribution Channel:
E-Commerce Redefines Route-to-MarketSupermarkets and hypermarkets secured the largest share of the organic beverage distribution market in 2025, commanding 36.32% of the total share. Their dominance highlights their critical role as the primary discovery and purchase channels for mainstream consumers seeking organic beverage options. These large-format retail outlets offer wide product assortments, competitive pricing, and convenient one-stop shopping experiences, making them attractive to a broad consumer base. The visibility and promotional capabilities within these stores help drive trial and repeat purchases of organic beverages. Established supply chain networks and strategic partnerships with organic beverage brands further reinforce supermarkets and hypermarkets as the go-to choice for consumers.
Conversely, online retail is the fastest-growing distribution channel within the organic beverage market, expanding at a compound annual growth rate (CAGR) of 8.96% through 2031, outpacing all other channels. The surge in online sales is driven by shifting consumer preferences toward convenience, home delivery, and the ability to access a wider variety of organic beverage brands beyond traditional retail assortments. Digital platforms enable personalized shopping experiences, easy price comparisons, and subscription services, enhancing customer engagement. The increasing penetration of smartphones and improvements in e-commerce infrastructure support this rapid growth. Additionally, online retail is agile in responding to emerging trends and new product launches, allowing brands to quickly reach targeted consumer segments.
Geography Analysis
North America Organic Beverage Market
North America dominated the organic beverage market in 2025, capturing 35.41% of the total market value. This leadership is underpinned by mature regulatory frameworks that ensure consumer trust and product integrity. High per-capita spending on wellness products reflects strong consumer prioritization of health-focused beverages. Established distribution networks facilitate widespread availability across retail channels. The United States stands out as the largest single-country market within the region. Its dominance is propelled by the USDA National Organic Program certification, which bolsters confidence in organic labeling. Strong consumer awareness further drives demand and market penetration in this mature landscape.
APAC Organic Beverage Market
Asia-Pacific emerges as the fastest-growing region in the organic beverage market, achieving a compound annual growth rate (CAGR) of 7.53% through 2031. This rapid expansion is fueled by accelerating urbanization, which shifts consumer lifestyles toward convenient, health-oriented products. Rising disposable incomes enable broader access to premium organic beverages among middle-class populations. Government support for organic agriculture enhances local production and supply chain resilience. Increasing health consciousness and preference for natural ingredients amplify demand across diverse markets. This dynamic growth positions Asia-Pacific as a pivotal engine for the global organic beverage industry's future trajectory.
EMEA and South America Organic Beverage Market
Europe maintains a significant presence in the organic beverage market, supported by stringent EU organic standards and high consumer demand for sustainable products, though it trails North America in overall share. South America shows emerging potential driven by expanding organic farming initiatives in countries like Brazil and growing export capabilities. The Middle East and Africa represent nascent opportunities, with rising urbanization and wellness trends spurring adoption, albeit constrained by infrastructural challenges and lower per-capita incomes. These regions collectively contribute to global diversification, with Europe leading in regulatory maturity, South America in production growth, and Middle East and Africa in untapped consumer bases.
Regulatory Landscape
Organic beverages operate under certification and labeling regimes that set allowable inputs, processing aids, and on-pack claims, with increased scrutiny on traceability across global supply chains. In the United States, the USDA Agricultural Marketing Service (AMS) administers the National Organic Program (NOP), and its February 2026 actions on sunset review and renewals for substances on the National List under 7 CFR part 205 reinforced that formulations and processing steps used in organic beverages must continue to align with permitted materials as listings are reviewed.
In Europe, the EU Organic Regulation framework continues to shape import compliance and equivalence decisions for non-EU operators, and 2026 policy discussions added new compliance and access considerations. In June 2026, the Council of the European Union adopted implementing regulations establishing tariff-rate quotas for U.S. agricultural and food products, including non-alcoholic beverages, which created a new trade channel structure for qualifying shipments. Separately, EU institutions discussed adjustments to small-operator certification thresholds in 2026 and ongoing work on organic equivalence arrangements, with the current arrangements referenced as expiring on December 31, 2026, keeping importers focused on contingency planning for certification recognition and labeling continuity.
Competitive Landscape
The organic beverage market is characterized by a highly fragmented competitive structure, where no single company holds a dominant position, allowing a diverse array of players to coexist and thrive. This fragmentation arises from the specialized nature of organic production, which demands adherence to stringent certification standards and sustainable sourcing practices across varied regional ecosystems. Multinational giants like PepsiCo and Coca-Cola maintain strong portfolios through acquisitions and organic lines, yet they face stiff competition from niche brands focused on specific product categories or local markets. Regional specialists, such as European artisanal juice producers or Asia-Pacific herbal tea innovators, leverage intimate knowledge of local consumer preferences and supply chains to capture significant shares.
This fragmented landscape presents substantial white-space opportunities for agile brands willing to master the complexities of organic certification and supply chain management. Certification processes, including USDA Organic, EU Organic, and regional equivalents, involve rigorous audits for soil health, pesticide avoidance, and traceability, creating barriers that deter casual participants but reward committed players. Brands that excel here can differentiate through transparent labeling and storytelling, appealing to ethically conscious consumers who prioritize provenance. By forging direct relationships with organic farmers, companies gain advantages in quality control, cost efficiency, and supply stability, mitigating risks from volatile commodity prices and climate impacts.
Ultimately, effective control of the farm-to-shelf supply chain positions brands for long-term competitive advantage in this fragmented market. Vertically integrated models allow for real-time monitoring of cultivation, processing, and distribution, ensuring product integrity and reducing intermediaries that dilute margins. This approach also facilitates rapid response to trends like functional additions or zero-waste packaging, keeping brands ahead of commoditized rivals. Regional specialists often outperform multinationals by embedding in local communities, co-developing flavors, and building loyalty through authenticity. As consumer demand for traceable organics intensifies, mastery of this end-to-end chain becomes a key differentiator, transforming fragmentation from a challenge into a strategic asset for growth-oriented brands.
Organic Beverage Industry Leaders
-
PepsiCo, Inc.
-
The Hain Celestial Group, Inc.
-
Nestlé S.A.
-
Danone S.A.
-
The Coca-Cola Company
- *Disclaimer: Major Players sorted in no particular order
Organic Beverage Market Companies Covered in this Report
- Danone S.A.
- The Hain Celestial Group, Inc.
- Nestlé S.A.
- PepsiCo, Inc.
- The Coca-Cola Company
- Suja Life LLC
- Organic Valley ( CROPP Co-op )
- WhiteWave Foods (Alpro)
- SunOpta Inc.
- Keurig Dr Pepper Inc.
- Oatly AB
- Bolthouse Farms
- Health-Ade Kombucha
- GT’s Living Foods
- Remedy Drinks
- Galvanina SpA
- Biotta AG
- Phoenix Organics
- Uncle Matt's Organic
Market Opportunities and Future Outlook
Scaling certified-organic capacity and improving cost-to-serve are the main whitespace areas, especially for high-velocity RTD formats (functional drinks, RTD tea/coffee, and plant-based beverages) that depend on consistent supply and modern packaging lines. Several 2026 investments point to where manufacturers are building that capability, including Oatly's multi-year USD 16 million investment in its Landskrona, Sweden facility to lift output capacity by more than 33% (targeting 200 million liters per year) and Chobani's USD 567 million multi-phase expansion of its La Colombe plant in Norton Shores, Michigan, adding more than 200,000 square feet of production space. Together, these moves signal a shift toward larger-scale, more automated production footprints that can support national distribution and broader channel coverage.
There is also opportunity in export-oriented processing and cross-border assortment expansion as certification and trade frameworks evolve. In June 2026, APEDA notified a framework that allows Indian organic processors to import USDA NOP-certified organic ingredients for value addition and re-export to the United States under defined composition limits, creating a practical pathway for blended formulations and ingredient optimization while staying within certification rules. For brand owners, this supports portfolio extension into functional and clean-label formulations and helps accelerate testing of new recipes and pack formats across regions, particularly as online retail expands access to niche organic SKUs and direct-to-consumer replenishment models.
Recent Industry Developments in Organic Beverage Market
- February 2026: The Hain Celestial Group entered into an agreement to sell its North American Snacks business for USD 115 million as it sharpened focus on core categories, including beverages such as tea and plant-based drinks. The divestiture reallocates capital and management attention toward innovation and brand investment in beverage platforms that align with organic and wellness positioning.
- May 2025: PepsiCo completed its acquisition of prebiotic soda brand Poppi after announcing the USD 1.95 billion deal in March 2025. Folding a fast-growing functional soda brand into a global route-to-market extends distribution reach and increases competitive intensity in better-for-you carbonated and functional beverage shelves where organic claims and clean-label messaging often overlap.
- May 2024: Chameleon Organic Coffee expanded its ready-to-drink lineup with four 8 oz canned cold-brew products made from 100% organic beans. The move into single-serve cans supports consumption occasions beyond bottles and helps broaden placement in convenience-led channels that prioritize portability and faster turns.
Organic Beverage Market Report Scope and Research Methodology
Market Definition and Coverage
This market covers beverages sold with an organic claim, where the key ingredients are produced under organic standards and the product is marketed as organic at retail. We size the market in value terms across alcoholic and non-alcoholic beverages sold through major retail and foodservice routes.
Scope exclusions: We exclude conventional beverages without an organic claim and we do not treat packaging material sales as part of the market value.
Segments Covered in This Report
- By Product Type
- Fruit and Vegetable Juices
- Dairy-based
- RTD Coffee
- RTD Tea
- Functional Drinks
- Other Product Types
- By Packaging Type
- Bottles
- Cans
- Cartons/Tetrapacks
- Pouches/Sachets
- By Distribution Channel
- Supermarkets/Hypermarkets
- Convenience Stores
- Specialty Stores
- Online Retail Stores
- Other Distribution Channels
- By Region
- Noth America
- United States
- Canada
- Mexico
- Rest of North America
- Europe
- United Kingdom
- Germany
- France
- Spain
- Italy
- Netherlands
- Poland
- Belgium
- Sweden
- Rest of Europe
- Asia-Pacific
- China
- Japan
- India
- Australia
- Indonesia
- South Korea
- Thailand
- Singapore
- Rest of Asia-Pacific
- South America
- Brazil
- Argentina
- Chile
- Peru
- Colombia
- Rest of South America
- Middle East and Africa
- Saudi Arabia
- United Arab Emirates
- South Africa
- Nigeria
- Egypt
- Morocco
- Turkey
- Rest of Middle East and Africa
- Noth America
Data Sources, Market Sizing, and Validation
Desk Research
Desk research starts with building a clean view of the demand pool for organic beverages and the rules behind organic labeling, since those rules decide what can be counted. We refer to public sources such as the USDA organic program resources, European Commission organic regulation notes, the FAO food and agriculture datasets, and trade statistics published by UN Comtrade and national customs portals to understand category movement and cross-border flows.
Once the market boundaries are set, we use company annual reports, investor presentations, brand and retailer announcements, and reputable press coverage to map product presence, pricing direction, and channel mix shifts. In parallel, we use a paid subscription for company financials and intelligence, and a paid import and export shipment-level database where it is helpful to sanity-check trade-linked beverages and packaging formats in circulation. This list is illustrative, and we also reviewed other public and paid sources to collect data, validate assumptions, and clarify gaps.
Primary Interviews and Surveys
Primary work is used to stress-test what we see in public data, especially on pricing, organic premium trends, and channel realities for each beverage type. We speak with a mix of brand owners, ingredient and packaging-linked stakeholders, distributors, retailers, and category specialists across APAC, EMEA, and the Americas, so our inputs stay aligned with what is actually selling and not only what is being launched.
Respondent input was used to check the organic-share splits we apply within beverage subcategories, and to confirm where channel reporting differs between grocery retail, convenience, and online retail.
Distribution of primary research fieldwork respondents
| Company type | Respondent position | Region |
|---|---|---|
| Top tier: 28% | CXOs: 12% | APAC: 43% |
| Mid tier: 56% | Functional/Unit leaders: 30% | EMEA: 33% |
| Smaller Players: 16% | Managers: 58% | Americas: 24% |
Market-Sizing & Forecasting
For market sizing, we use a top-down and bottom-up approach where category demand is reconstructed from consumption and channel signals, and then cross-checked with selective supplier and brand roll-ups. In practice, our top-down build uses beverage category splits and the estimated organic share within each split, before values are extended through typical pricing by channel.
Key inputs that shape the model include the organic share within RTD tea and RTD coffee, the value contribution of fruit and vegetable juices, dairy-based organic beverages, and alcoholic organic beverages, plus the channel mix across supermarkets and hypermarkets, convenience stores, specialist retailers, and online retail. Packaging mix (bottles, cans, cartons or tetrapacks, and pouches or sachets) is also used as a realism check, since it typically moves with price bands and distribution access. For forecasting, we rely on scenario analysis supported by trend lines in organic penetration, pricing premium direction, and category expansion pace that our interviews helped confirm. Where bottom-up datapoints are missing for smaller channels, we bridge gaps using conservative organic-share ranges and then adjust only after checks against the broader channel totals.
Data Validation & Update Cycle
Validation is done by triangulating the modeled totals across independent signals, followed by variance checks at category and region level so unusual spikes get explained before sign-off. We also compare the implied per-capita spend trend and channel mix movement with what retailers and industry bodies indicate, and then we re-contact sources when gaps remain on pricing or organic share.
Each report goes through multi-step analyst reviews, where assumptions are challenged and the math is rechecked for internal consistency across beverages, packaging, and channels. The study is refreshed annually, and interim updates are triggered when material events occur, such as major regulation changes or large shifts in organic input availability. Right before delivery, a final review pass is completed so clients receive the most current view we can support.
Mordor Intelligence's Organic Beverage Market Size Compared Against Other Published Estimates
Published market sizes for organic beverages can look far apart even when they use similar words, because the counted products, the base year, and the pricing logic often differ. We also see gaps when one estimate leans more on aggressive growth scenarios, while another takes a conservative view of how fast organic penetration expands.
Key gap drivers in this market usually come from whether alcoholic organic beverages are included alongside non-alcoholic categories, how RTD coffee and RTD tea are treated versus broader coffee and tea, and whether the value is built from retail prices or a mix of trade and retail pricing. Currency timing and inflation handling can also move the value a lot, particularly when organic premiums are changing quickly in online retail versus supermarkets and hypermarkets. By tracking organic penetration by beverage type and refreshing price-premium assumptions with interviews, Mordor Intelligence keeps the 2026 total tied to the defined alcoholic and non-alcoholic scope and avoids inflating the market with adjacent conventional beverage revenues.
Benchmark comparison
| Source | Market Size | Gaps in Research Methodology |
|---|---|---|
| Mordor Intelligence | USD 26.48 B (2026) | |
| Global Consultancy A | USD 48.88 B (2025) | Uses a different base year and a broader category treatment for non-alcoholic beverages, where carbonated drinks and bottled water are explicitly counted, which can lift totals when organic labeling thresholds and channel pricing are applied differently. |
| Regional Consultancy B | USD 42.56 B (2024) | Builds from an earlier year and applies a faster growth pathway, and the product grouping and channel split are simplified into offline versus online, which can overstate value when premium progression is generalized across beverage types. |
Overall, the spread is mostly explained by base-year choice and how wide the product perimeter is drawn, rather than a single data source issue. Our method stays repeatable because it follows clear category boundaries, uses observable channel and packaging signals as checks, and then confirms key assumptions through primary discussions before finalizing the totals.
Key Questions Answered in the Report
What is the current value of global organic beverage sales and how fast is it growing?
Sales reached USD 26.48 billion in 2026 and are on track to expand at a 6.85% CAGR to USD 36.86 billion by 2031.
Which product segment is expanding the quickest within organic drinks?
Functional beverages, led by probiotic and prebiotic sodas, post the fastest pace at an 8.29% CAGR through 2031.
How dominant are flexible pouches and sachets compared with traditional bottles?
Bottles still hold 43.92% of 2025 volumes, yet pouches and sachets are climbing at a 8.75% CAGR, steadily eroding that lead.
Why is Asia-Pacific attracting so much attention from beverage brands?
The region combines a 7.53% CAGR forecast with supportive certification policies such as India’s upgraded NPOP, creating lucrative opportunities for certified suppliers.