
Oral Sleep Apnea Market Size and Share
Market Overview
| Study Period | 2020 - 2031 |
|---|---|
| Market Size (2026) | USD 0.88 Billion |
| Market Size (2031) | USD 1.72 Billion |
| Growth Rate (2026 - 2031) | 14.28 % |
| Fastest Growing Market | Asia-Pacific |
| Largest Market | North America |
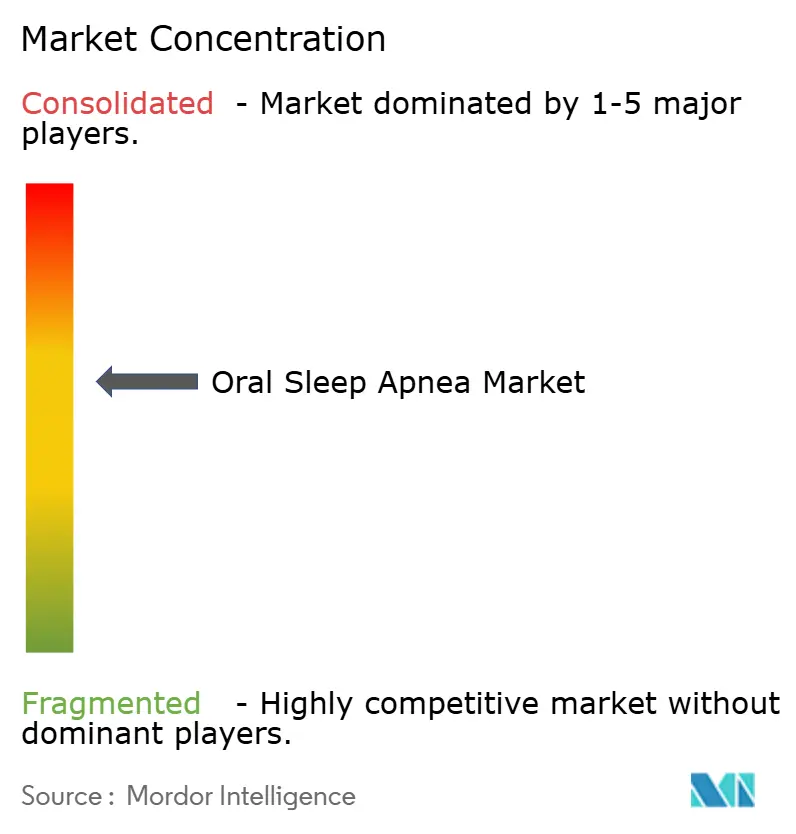
| Market Concentration | Medium |
Major Players *Disclaimer: Major Players sorted in no particular order Image © Mordor Intelligence. Reuse requires attribution under CC BY 4.0. | |
Oral Sleep Apnea Market Analysis by Mordor Intelligence
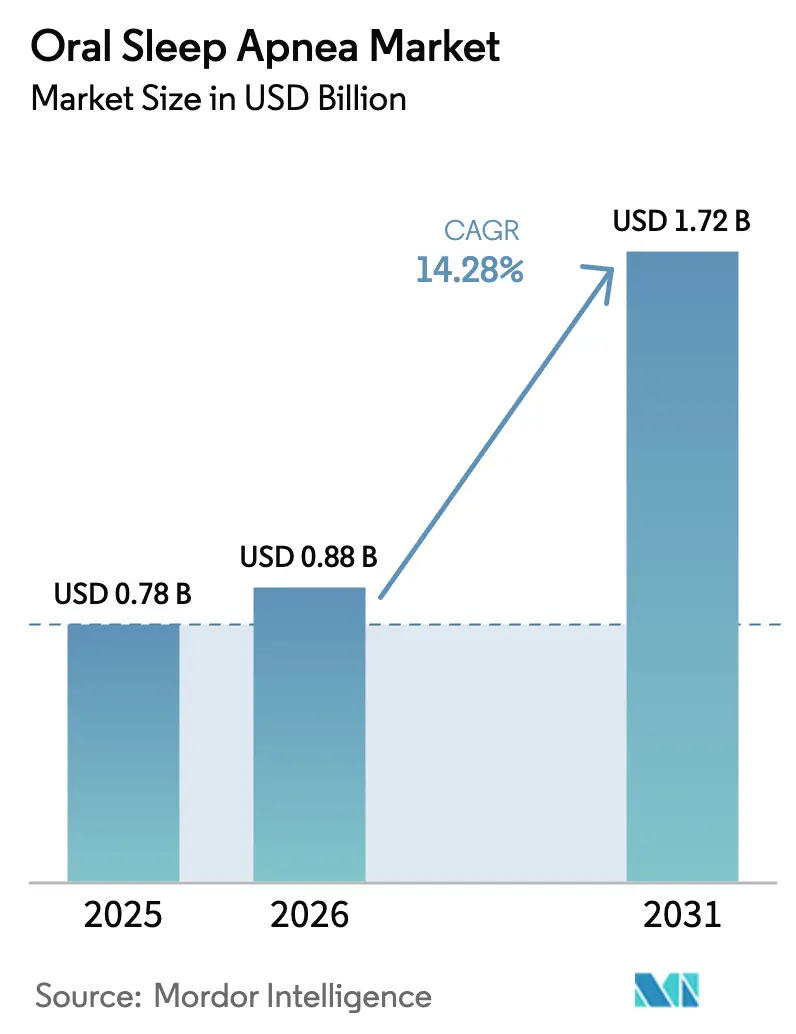
The Oral Sleep Apnea Market size is expected to increase from USD 0.78 billion in 2025 to USD 0.88 billion in 2026 and reach USD 1.72 billion by 2031, growing at a CAGR of 14.28% over 2026-2031.
Sustained double-digit growth stems from three intertwined shifts: first, guideline revisions that elevate oral appliances to first-line therapy for mild-to-moderate obstructive sleep apnea (OSA); second, rapid uptake of home sleep testing that collapses diagnosis-to-treatment timelines; and third, the diffusion of 3-D printing, which cuts device lead-times from weeks to days. Reimbursement rules in North America and Germany deliberately exclude prefabricated devices and push demand toward high-margin, digitally fabricated mandibular advancement devices (MADs). In parallel, Asia-Pacific’s vast undiagnosed OSA population drives volume for lower-priced semi-custom devices, creating a bifurcated global supply chain. Competitive strategies increasingly hinge on vertically integrated digital workflows that span intra-oral scanning, computer-aided design, and additive manufacturing, a pivot underscored by ResMed’s 2024 acquisition of Sommetrics.
Key Report Takeaways
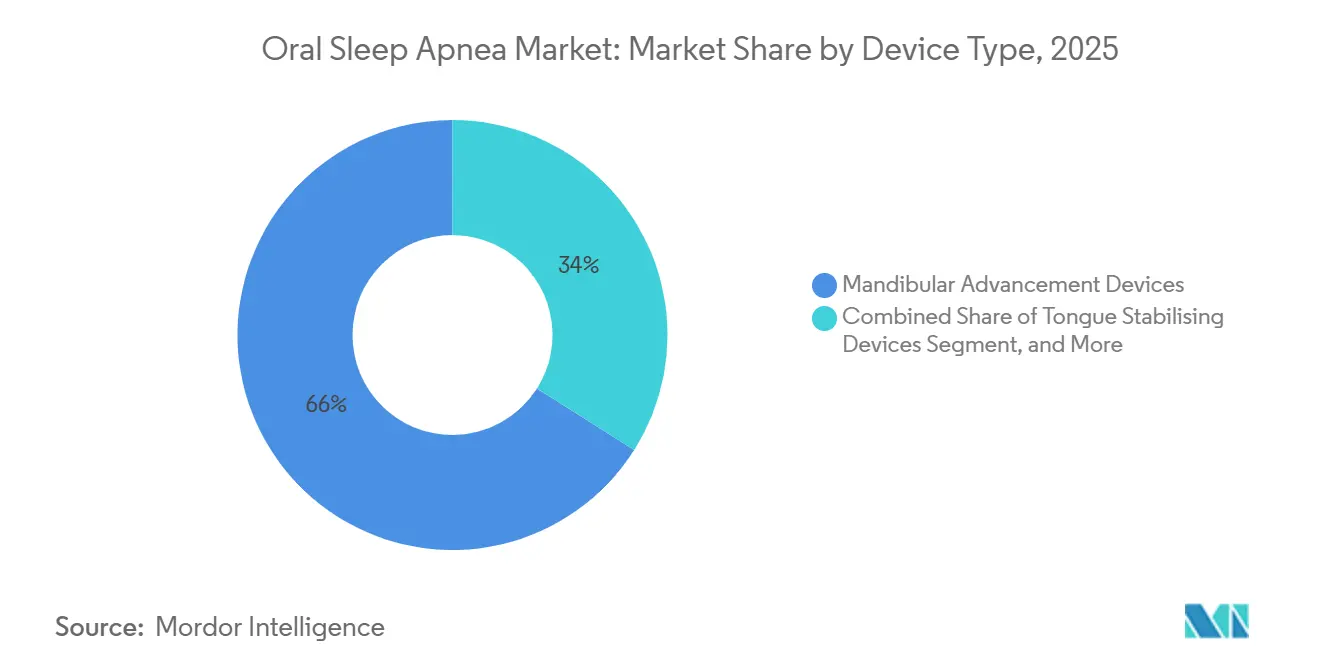
- By device type, mandibular advancement devices led with 66.02% of the oral sleep apnea market share in 2025. Tongue stabilizing devices are projected to expand at a 15.06% CAGR to 2031, the fastest among device types.
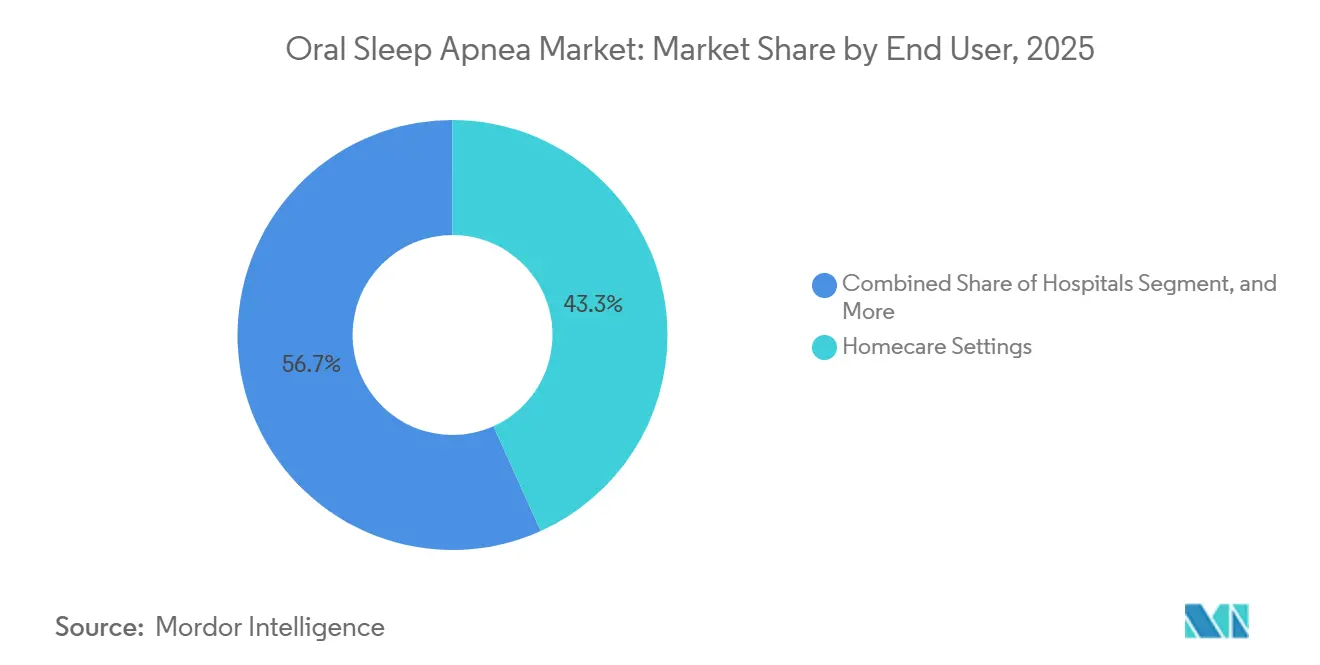
- By end user, home care settings accounted for 43.27% of revenue in 2025, while dental clinics and sleep dentistry centers are forecast to grow at 16.63% CAGR through 2031.
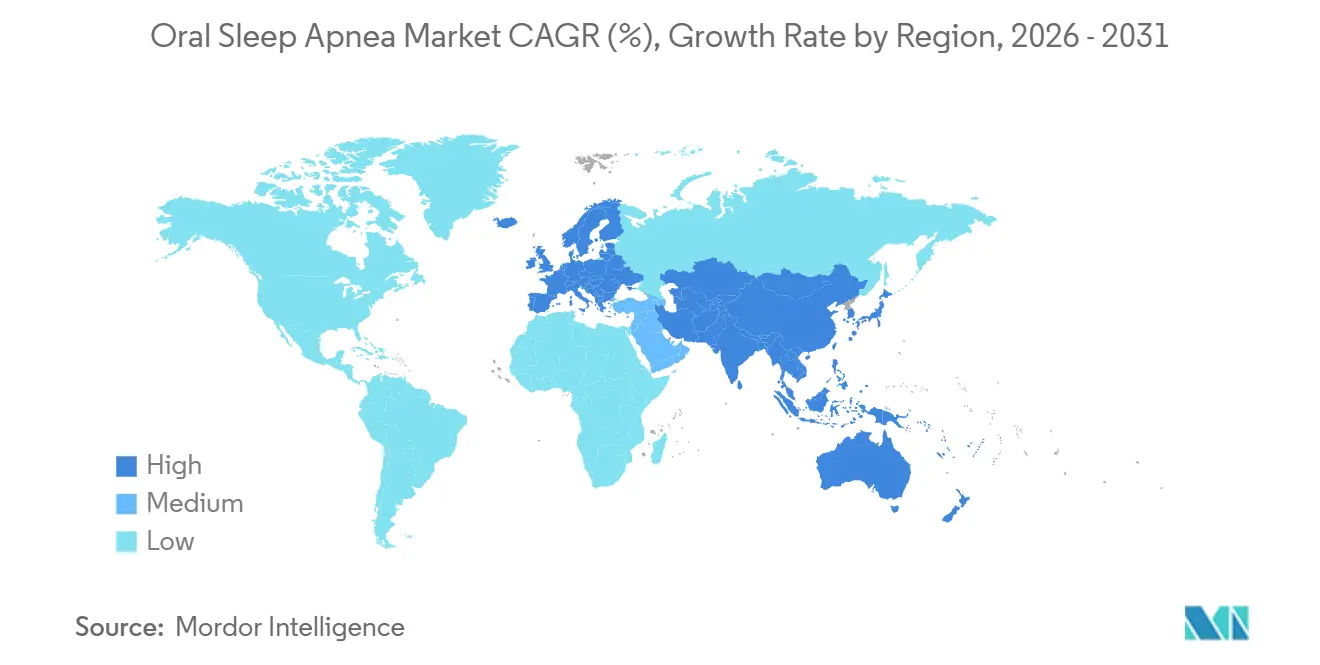
- By geography, North America captured 38.18% of 2025 revenue; Asia-Pacific is expected to advance at a 17.27% CAGR over 2026-2031.
Note: Market size and forecast figures in this report are generated using Mordor Intelligence’s proprietary estimation framework, updated with the latest available data and insights as of January 2026.
Global Oral Sleep Apnea Market Trends and Insights
Drivers Impact Analysis*
| Driver | (~) % Impact on CAGR Forecast | Geographic Relevance | Impact Timeline |
|---|---|---|---|
| Rising Prevalence of Obstructive Sleep Apnea | +3.2% | Global, acute in Asia-Pacific | Long term (≥ 4 years) |
| Increasing Diagnosis Via Home-Sleep Testing | +2.8% | North America, Europe, urban Asia-Pacific | Medium term (2-4 years) |
| Favourable Reimbursement for Oral Appliances | +2.5% | North America, Germany, parts of Europe | Medium term (2-4 years) |
| Patient Preference for Non-Invasive CPAP Alternatives | +2.1% | Global, strongest in ages 35-55 | Short term (≤ 2 years) |
| 3-D Printing Enables Mass-Customised Devices | +1.9% | North America, Europe, China, India | Medium term (2-4 years) |
| Corporate Sleep-Health Programmes Spur Demand | +1.2% | North America, nascent in Europe & GCC | Long term (≥ 4 years) |
| Source: Mordor Intelligence | |||
Rising Prevalence of Obstructive Sleep Apnea
The global prevalence of OSA reached 936 million adults in 2024, and 425 million of them already have moderate-to-severe disease, which elevates the oral sleep apnea market’s addressable base.[1]Adam P. Benjafield, “Global Prevalence of Obstructive Sleep Apnea,” The Lancet Respiratory Medicine, thelancet.com China alone hosts 176 million patients, but 90% remain undiagnosed because sleep-laboratory capacity is concentrated in tier-1 cities. Japan’s population over 65 exhibits OSA prevalence above 50%, pushing insurers to reimburse early treatment that averts cardiovascular events. This epidemiologic burden is amplifying political pressure for low-cost screening, catalyzing demand for digitally fabricated devices that can be shipped nationwide within days. Manufacturers positioning oral appliances as preventive rather than reactive fit neatly into public-health agendas that now prize cost avoidance over episodic interventions.
Increasing Diagnosis Via Home-Sleep Testing
The FDA cleared a succession of home sleep apnea tests (HSATs)—SANSA’s wearable patch, Huxley’s ring, and Withings’ ScanWatch 2 throughout 2024, enabling physicians to diagnose OSA without polysomnography.[2]U.S. Food and Drug Administration, “510(k) Premarket Notification Database,” fda.gov The United Kingdom’s December 2024 NICE guidance endorsed home testing, saving GBP 200-400 per patient and shortening diagnostic wait times from weeks to days. Faster diagnosis speeds oral appliance prescriptions, as patients bypass congested sleep centers and book same-week tele-dentistry appointments. Tele-enabled models also democratize access for rural populations, where courier-shipped devices paired with video titration replace multiple in-clinic visits. Manufacturers with direct-to-consumer logistics and digital impression kits, therefore, capture incremental volume without expanding brick-and-mortar footprints.
Favourable Reimbursement for Oral Appliances
Medicare’s LCD L33611 reimburses custom MADs (HCPCS E0486) but excludes prefabricated devices (E0485), channeling U.S. demand toward 3-D-printed, dentist-supervised products.[3]Centers for Medicare & Medicaid Services, “LCD L33611 Oral Appliances,” cms.gov Germany’s statutory health insurance mirrors this policy, though regional associations set variable tariffs that still encourage premium customization. France, Italy, and the United Kingdom reimburse selectively, steering lower-income patients to cash-pay or semi-custom variants, which in turn fosters a two-tier device portfolio strategy. Reimbursement clarity de-risks capital investment in digital production lines, prompting new entrants to focus on markets with the strongest payer signals.
Patient Preference for Non-Invasive CPAP Alternatives
Evidence from 2024-2025 cohorts shows 12-month adherence of 76-90% for oral appliances versus 46-83% for CPAP, particularly among patients aged 35-55. Travel convenience and partner acceptability tip the scales further; users avoid CPAP noise, distilled water logistics, and aesthetics that strain relationships. The American Academy of Sleep Medicine’s 2024 statement now lists oral appliances as a co-equal recommendation to CPAP for AHI < 30, legitimizing first-line use. Brands that market discreet form factors and bundle virtual coaching maximize this psychosocial edge.
Restraints Impact Analysis*
| Restraint | (~) % Impact on CAGR Forecast | Geographic Relevance | Impact Timeline |
|---|---|---|---|
| Limited Long-Term Efficacy Vs CPAP | -1.8% | Global, severe OSA | Medium term (2-4 years) |
| Poor Device Adherence & Comfort Issues | -1.3% | Global, TMJ & bruxism cohorts | Short term (≤ 2 years) |
| Shortage of Certified Dental-Sleep Practitioners | -1.1% | Rural North America, parts of Europe & Asia | Long term (≥ 4 years) |
| Regulatory Grey-Zones for Combo Devices | -0.6% | U.S., EU, Japan | Medium term (2-4 years) |
| Source: Mordor Intelligence | |||
Limited Long-Term Efficacy Vs CPAP
Meta-analyses show CPAP cuts AHI 25-30 events per hour in severe OSA, while MADs cause salivation, TMJ pain, or occlusal changes. Discontinuation is more common in bruxism or reduced protrusion ranges (< 6 mm). Multi-visit titration costs USD 100-200 per appointment, where insurance is patchy, accelerating dropout. Unlike CPAP, oral edema has an average of 10-15, leaving residual risk for cardiovascular disease. Although higher nightly adherence narrows the gap, payers still judge therapy on per-night efficacy. Germany and the Netherlands now require 5-year outcome data before broadening reimbursement, evidence that the appliance segment has yet to provide. This efficacy ceiling caps the penetration of the oral sleep apnea market in high-severity cohorts.
Poor Device Adherence & Comfort Issues
A 2025 Sleep Medicine cohort found that 15-25% of patients quit within 3 months due to symptoms recurring. Manufacturers are prototyping Bluetooth-enabled wearables that lack embedded compliance chips, so non-adherence often goes unnoticed. Time sensors, but regulatory guidance on whether these constitute a significant device modification remains unsettled.
*Our forecasts treat driver/restraint impacts as directional, not additive. The impact forecasts reflect baseline growth, mix effects, and variable interactions.
Segment Analysis
By Device Type: Mandibular Repositioning Anchors Custom Segment
Mandibular advancement devices captured 66.02% of 2025 revenue, reflecting robust reimbursement and extensive clinical validation. Custom 3-D-printed MADs priced at USD 1,500-2,500 dominate Medicare and German SHI channels, while semi-custom boil-and-bite variants at USD 300-800 appeal to cash-pay buyers in Latin America and Southeast Asia. Tongue stabilizing devices will grow at 15.06% CAGR to 2031, propelled by edentulous and limited-protrusion patients unsuited for MADs. Hybrid concepts such as Oventus Medical’s O2Vent add an airway channel that circumvents nasal obstruction, carving a small but strategic niche.
The digitally printed appliances sub-segment is the fastest mover. GoodSleepCo’s hushd Pro Avera and Airway Management’s Nylon flexTAP received clearances in 2024-2025, proving nylon’s overnight biocompatibility and supporting latticed designs impossible with thermoforming. Device files are delivered instantly to contract printers in India, Mexico, and Eastern Europe, compressing lead times and enabling same-week patient delivery. Players that straddle premium custom and low-cost semi-custom lines, such as SomnoMed’s Avant and Classic series, balance margin against volume but must orchestrate divergent supply chains. Overall, this mix of high-value and value-engineered offerings positions the oral sleep apnea market to address pay-as-you-go buyers without ceding premium reimbursements.


By End User: Homecare Gains Share from Clinical Channels
Homecare accounted for 43.27% of 2025 revenue as tele-health and mail-order fulfillment converged with smartphone-guided dental impressions. Subscription models now charge USD 50-100 monthly and bundle periodic refits plus adherence coaching, converting one-off sales into annuities. Dental clinics and sleep-dentistry centers, however, will post a 16.63% CAGR through 2031 because complex cases demand hands-on titration verified by polysomnography. Hospitals remain a niche, serving perioperative or cardiac-unit bridge therapy.
DSOs such as Aspen Dental standardize screening across hundreds of offices, negotiating rebates that pressure list prices but guarantee high volume. Tele-dentistry platforms route HSAT results directly to partner labs, shipping devices within 5-7 days. This hybrid supply map lets the oral sleep apnea market size for the homecare segment grow faster than clinic-based channels, yet clinical sites still capture high-acuity patients and premium reimbursements.
Geography Analysis
North America accounted for 38.18% of 2025 revenue, driven by Medicare reimbursement and a network of 2,000 AADSM Diplomates. The United States counts about 30 million adults with moderate-to-severe OSA, but only 6 million receive treatment, leaving a penetration gap the oral sleep apnea market can mine as HSAT expands. Canada’s patchwork provincial coverage ranges from CAD 800 reimbursements in Ontario to near-zero support in British Columbia, encouraging tiered pricing for devices. Mexico’s mostly cash-pay environment opens opportunities for semi-custom devices at USD 400-1,200.
Europe’s growth is steady but hampered by reimbursement heterogeneity. Germany reimburses under specific ICD codes yet imposes co-pays of EUR 50-150, while the United Kingdom’s NHS covers only limited cases, pushing most patients to pay GBP 800-1,500 out of pocket. France reimburses 60% of the tariff, but administrative delays can reach 8 weeks. Italy and Spain suffer from practitioner scarcity, leaving latent demand untapped. However, NICE’s 2024 home-testing endorsement should shorten diagnostic pipelines and prompt higher market penetration for oral sleep apnea in the United Kingdom.
Asia-Pacific is the growth engine, advancing at 17.27% CAGR through 2031. China’s 176 million patients drive volume for CNY 1,500-3,000 semi-custom devices, while NMPA fast-tracks imported appliances from SomnoMed and ProSomnus. Japan’s aging society and universal insurance create premium reimbursement, yet PMDA’s stringent trials delay launches 12-18 months. India remains nascent, with fewer than 200 dental-sleep practitioners, but rising corporate wellness programs and urban awareness are seeding future demand. Australia serves as an early-adopter test bed thanks to TGA’s smooth approvals and compulsory health coverage.
Middle East & Africa and South America trail behind because of scarce sleep centers and patchy insurance coverage. GCC nations are building specialty clinics, but adoption is limited to expatriate-dominated private sectors. Brazil and Argentina contend with economic volatility, nudging buyers toward lower-priced devices even as ANVISA approvals in 2024-2025 ease import barriers.

Regulatory Landscape
Oral sleep apnea devices are regulated primarily as medical devices, with market access shaped by predicate-based clearances in the United States and tighter evidence expectations in parts of Europe. In April 2026, the US Food and Drug Administration (FDA) cleared ProSomnus RPMO2 OSA Device (K252765) as a Class II medical device under 21 CFR 872.5570, reflecting continued 510(k) activity that supports iterative product upgrades and new feature sets in oral appliance therapy.
Regulation of monitoring and hybrid functions remains a key boundary for product design and claims. In October 2024, the FDA cleared SomnoMed Rest Assure for compliance monitoring, while efficacy monitoring, such as AHI measurement, required additional clinical evidence and a subsequent FDA submission. Separately, corporate continuity can affect supply assurance and post-market support, as illustrated by Oventus Medical Limited being deregistered in September 2024 after insolvency and asset liquidation. For providers that standardize around single-vendor platforms, this elevates counterparty and lifecycle-risk considerations.
Competitive Landscape
ResMed, SomnoMed, ProSomnus, Panthera Dental, and Oventus Medical collectively control significant global revenue, resulting in moderate concentration in the oral sleep apnea market. ResMed’s 2024 acquisition of Sommetrics signals diversification amid slowing CPAP growth. SomnoMed booked AUD 94.9 million (USD 63.2 million) in fiscal 2024 revenue, 69% from North America, but saw Q1 FY 2025 growth decelerate to 9.6% as core markets matured, prompting a pivot to Asia-Pacific. ProSomnus differentiates through ±0.1 mm 3-D printing tolerances and a device-as-a-service model that aligns revenue with long-term adherence.
GoodSleepCo represents the rising digital-native cohort, bypassing dental-lab channels to ship devices within 10 days at 30-40% lower prices. Vivos Therapeutics claims airway-remodeling with myofunctional therapy add-ons, though peer-reviewed durability data remain sparse. Regulatory asymmetries persist: the FDA’s predicate-based 510(k) favors incremental upgrades, whereas Europe’s MDR demands fresh clinical evidence, delaying renewals for some incumbents. Distribution likewise hinges on the 2,000 AADSM-certified dentists worldwide, creating a bottleneck that entrenched players exploit by owning field-based training teams.
Oral Sleep Apnea Industry Leaders
Oventus Medical
SomnoMed Ltd.
ProSomnus Sleep Technologies
Panthera Dental
Whole You (Mitsui Chemicals)
- *Disclaimer: Major Players sorted in no particular order

Market Opportunities and Future Outlook
Connected oral appliance therapy is emerging as a specific whitespace as manufacturers expand beyond purely mechanical mandibular advancement toward data-enabled care pathways. The April 2026 FDA Class II clearance for ProSomnus RPMO2 (K252765) shows regulatory receptivity for oral-appliance-centered systems that include multi-night physiological monitoring, which supports differentiated clinical workflows linking titration, follow-up, and chronic management through a device-led pathway.
Interoperability with telemonitoring and virtual-care ecosystems is an actionable opportunity as home sleep testing and remote follow-up reduce diagnosis-to-therapy timelines in multiple regions. In June 2026, ProSomnus and MonitAir announced a collaboration to integrate RPMO2 device data into MonitAir's tele-monitoring platform, reinforcing the demand for software connectivity, clinician dashboards, and integrated fulfillment alongside custom oral appliances. Manufacturers and dental-sleep networks that connect compliance and physiologic data streams with digital fabrication (scan-to-CAD-to-print) can compete on documented usage, faster refits, and reduced chair time, while still managing the regulatory line between compliance tracking and efficacy measurement.
Recent Industry Developments
- June 2026: ProSomnus Sleep Technologies collaborates with MonitAir to integrate data from the RPMO2 OSA device into MonitAir's tele-monitoring platform. The collaboration expands connected care integration for OSA devices and advances theragnostic care and remote monitoring capability in oral sleep-apnea therapy.
- April 2026: ProSomnus Sleep Technologies receives FDA Class II 510(k) clearance for the RPMO2 OSA device (FDA K252765). The regulatory clearance strengthens the product pipeline and market access for the RPMO2 device.
- February 2026: ProSomnus Sleep Technologies secures a strategic investment of up to $38 million from Catalio Capital Management to scale its technology-enabled sleep health platform. The funding accelerates product development and go-to-market capacity for the RPMO2 ecosystem.


Research Methodology Framework and Report Scope
Market Definition and Coverage
In this study, the oral sleep apnea market covers revenues generated from oral appliances used to manage obstructive sleep apnea, captured at the point of sale to end users across major regions.
Scope exclusions: We exclude CPAP and bilevel devices, surgical therapies, pharmaceuticals, and sleep testing and diagnosis services from this market sizing.
Segmentation Overview
- By Device Type
- Mandibular Advancement Devices (MADs)
- Tongue Stabilising Devices (TSDs)
- Hybrid / Combination Oral Appliances
- Custom 3-D-printed Devices
- By End User
- Hospitals
- Dental Clinics & Sleep Dentistry Centres
- Homecare Settings
- By Geography
- North America
- United States
- Canada
- Mexico
- Europe
- Germany
- United Kingdom
- France
- Italy
- Spain
- Rest of Europe
- Asia-Pacific
- China
- Japan
- India
- Australia
- South Korea
- Rest of Asia-Pacific
- Middle East & Africa
- GCC
- South Africa
- Rest of Middle East & Africa
- South America
- Brazil
- Argentina
- Rest of South America
- North America
Data Sources, Market Sizing, and Validation
Desk Research
We start with desk research to set the demand pool and the medical context that sits behind therapy adoption. Public sources that help here include CDC health statistics, NIH and NCBI literature, WHO health indicators, and FDA databases for clearances and safety communications, which together support prevalence and treatment pathway assumptions.
To ground the commercial side, we review company filings and investor presentations where available, along with association publications, reputed healthcare press, and conference proceedings that discuss oral appliance therapy usage. In addition, we use selected paid subscriptions for company financials and intelligence, patent databases, and import and export shipment-level data when it helps validate manufacturing footprints and cross-border supply patterns. The sources mentioned are illustrative only, and other public references were also used for data collection, cross-checking, and clarification.
Primary Interviews and Surveys
Primary work is used to check what is really being prescribed and reimbursed, and how pricing behaves by channel and country. We spoke with a mix of dental sleep medicine stakeholders, distributors, sleep clinics, and manufacturing-side experts across APAC, EMEA, and the Americas, which helped us test adoption assumptions and fill gaps left by public data.
Distribution of primary research fieldwork respondents
| Company type | Respondent position | Region |
|---|---|---|
| Top tier: 36% | CXOs: 16% | APAC: 39% |
| Mid tier: 48% | Functional/Unit leaders: 24% | EMEA: 36% |
| Smaller Players: 16% | Managers: 60% | Americas: 25% |
Market-Sizing & Forecasting
Our main sizing build uses a top-down, prevalence-to-treated-patient pathway, where the diagnosed obstructive sleep apnea pool is translated into likely oral appliance candidates and then into annual device demand. That demand is further shaped using practical inputs such as diagnosis and referral patterns, CPAP intolerance rates that redirect patients, dental sleep medicine penetration by region, replacement cycles for oral appliances, and typical price bands by channel.
After the first pass, we corroborate results with selective bottom-up approximations such as sampled average selling price multiplied by estimated unit volumes from channel checks, and supplier and distributor revenue patterns where they are disclosed. When direct unit information is missing, gaps are handled by using regional utilization proxies and interview-based ranges, then narrowed using observed price dispersion and reimbursement realities.
For forecasting, we use scenario analysis supported by short-run smoothing on the historical base so near-term noise does not over-shift the curve. The forward view is anchored on variables that interviewees repeatedly pointed to, including diagnosis expansion, growth in dental clinic participation, payer coverage movement, and the pace of patient preference shifting toward non-CPAP options.
Data Validation & Update Cycle
Validation is done through triangulation across the demand pool build, pricing checks, and independent market signals such as regulatory clearances and shipment direction, and then outliers are reviewed before sign-off. If a data point breaks expected relationships, such as a sudden price jump without an input-cost or mix explanation, we re-check sources and re-contact relevant experts to confirm what changed.
Reports are refreshed annually, with interim updates triggered by material events that can move adoption or pricing. Before delivery, a final analyst pass is completed so clients receive an updated view that reflects the latest public data and recent primary feedback.
Mordor Intelligence's Oral Sleep Apnea Market Size Compared Against Other Published Estimates
Published market sizes for oral sleep apnea often do not match because the included therapy set and revenue line items are not consistent across sources, and timing also differs. We keep the steps simple and traceable, which helps when a buyer wants to map a number back to real demand signals.
Key gaps usually come from what is counted as an oral therapy product, how replacement and follow-up device demand is treated, and whether pricing reflects real-world channel mix or a single blended assumption. Currency conversion timing, base-case versus aggressive uptake, and refresh cadence also play a role, especially when new clinical guidance or reimbursement changes alter near-term adoption.
Benchmark comparison
| Source | Market Size | Gaps in Research Methodology |
|---|---|---|
| Mordor Intelligence | USD 0.88 B (2026) | |
| Industry Association A | USD 1.12 B (2026) | Often folds in a wider sleep therapy basket, which can include adjunct anti-snoring products and related dental services, thereby lifting the value beyond device revenue alone. |
| Global Consultancy B | USD 0.67 B (2026) | Tends to apply conservative candidate and replacement assumptions, and it may rely on limited pricing checks that under-represent premium custom-fitted appliance mixes in mature markets. |
CPAP and bilevel device revenues sit outside Mordor Intelligence's scope for this report, which is why some broader sleep apnea figures look higher even when they cite the same year. The table shows that once scope is aligned and pricing and replacement logic are tied back to interview checks, the remaining spread is mainly explained by adoption pace and how channel mix is handled.


Key Questions Answered in the Report
How fast will the oral sleep apnea market grow through 2031?
Revenue is forecast to rise from USD 0.88 billion in 2026 to USD 1.72 billion by 2031, a 14.28% CAGR between 2026-2031.
Which device type dominates sales today?
Custom mandibular advancement devices held 66.02% of 2025 revenue, the largest share within all categories.
What region offers the steepest future growth?
Asia-Pacific is projected to register a 17.27% CAGR over 2026-2031, outpacing every other geography due to a vast undiagnosed patient pool.
Why are homecare channels expanding so quickly?
Home sleep testing, tele-dentistry, and mail-order delivery compressed the diagnosis-to-therapy cycle to under a week, making homecare the most convenient access point.
How are 3-D printing technologies reshaping supply chains?
Additive manufacturing cuts lead-times to 24-48 hours, supports mass customization, and allows contract printers in India, Mexico, and Eastern Europe to serve global orders.
Page last updated on:





