
Optical Wavelength Services Market Size and Share
Market Overview
| Study Period | 2020 - 2031 |
|---|---|
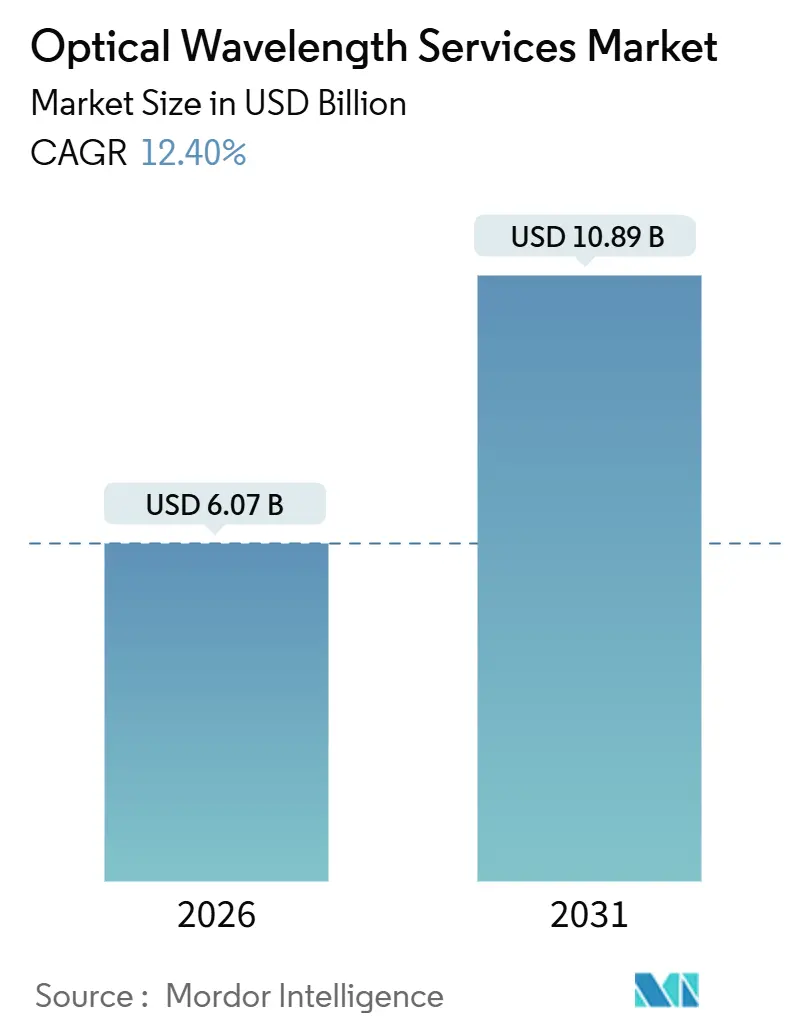
| Market Size (2026) | USD 6.07 Billion |
| Market Size (2031) | USD 10.89 Billion |
| Growth Rate (2026 - 2031) | 12.40 % |
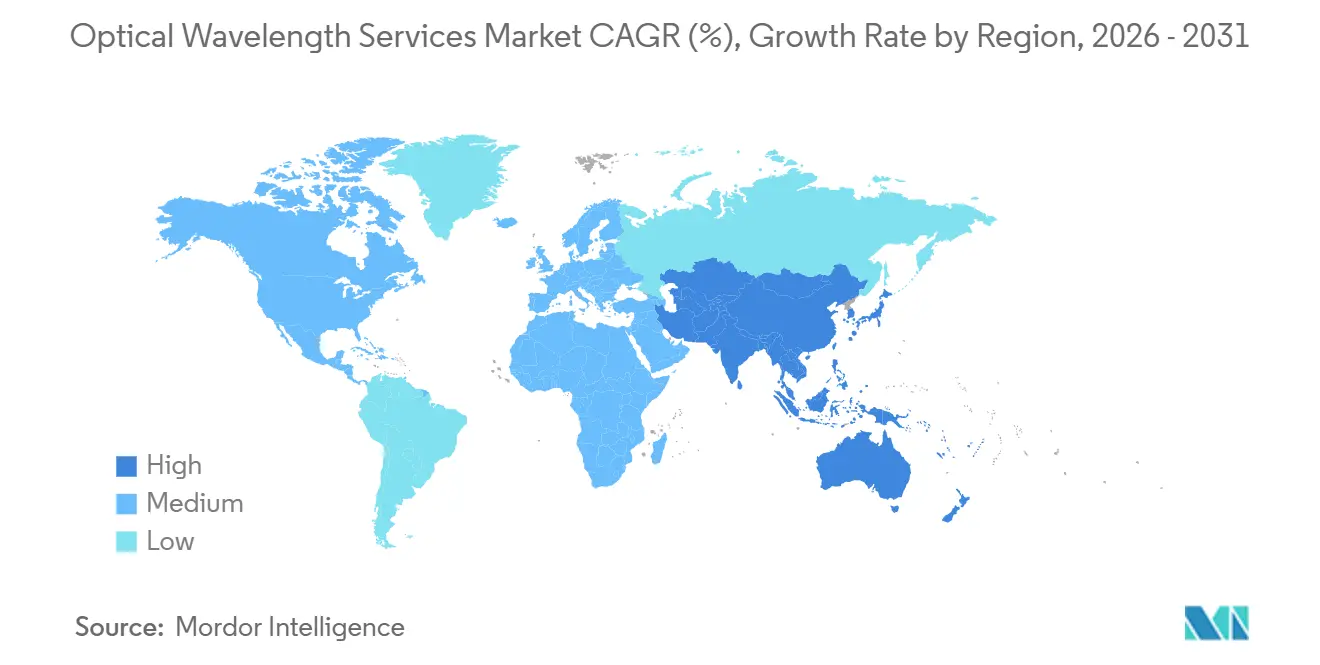
| Fastest Growing Market | Asia Pacific |
| Largest Market | North America |
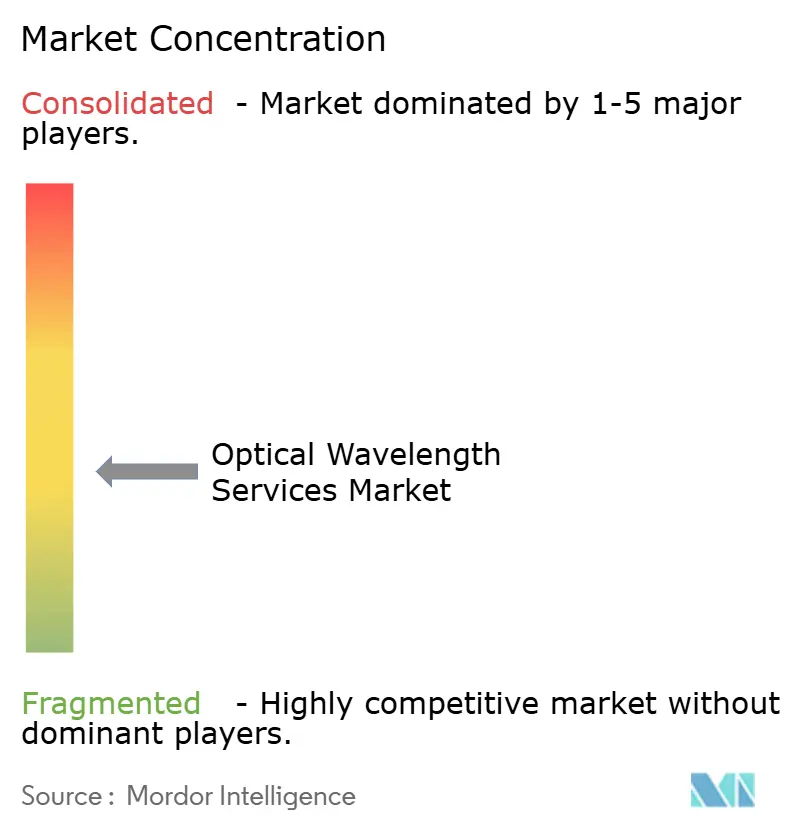
| Market Concentration | Medium |
Major Players *Disclaimer: Major Players sorted in no particular order Image © Mordor Intelligence. Reuse requires attribution under CC BY 4.0. | |
Optical Wavelength Services Market Analysis by Mordor Intelligence
The optical wavelength services market size stands at USD 6.07 billion in 2026 and is projected to reach USD 10.89 billion by 2031, registering a 12.40% CAGR over the period. The robust adoption of coherent 800 G and 1.6 T transmission, large-scale metro fiber refreshes, and widespread hyperscale data center interconnect (DCI) build-outs underpin this trajectory. Competitive differentiation increasingly revolves around automated service provisioning, open-line-system architectures, and bundled edge-compute offerings. Submarine upgrade cycles, 5G transport densification, and AI-optimized traffic engineering augment near-term demand, while sizable whitespace opportunities across Africa and secondary U.S. metros keep long-run growth prospects intact. Margin pressure for incumbents persists, however, as cloud providers self-provision dark fiber and pursue vertical integration.
Key Report Takeaways
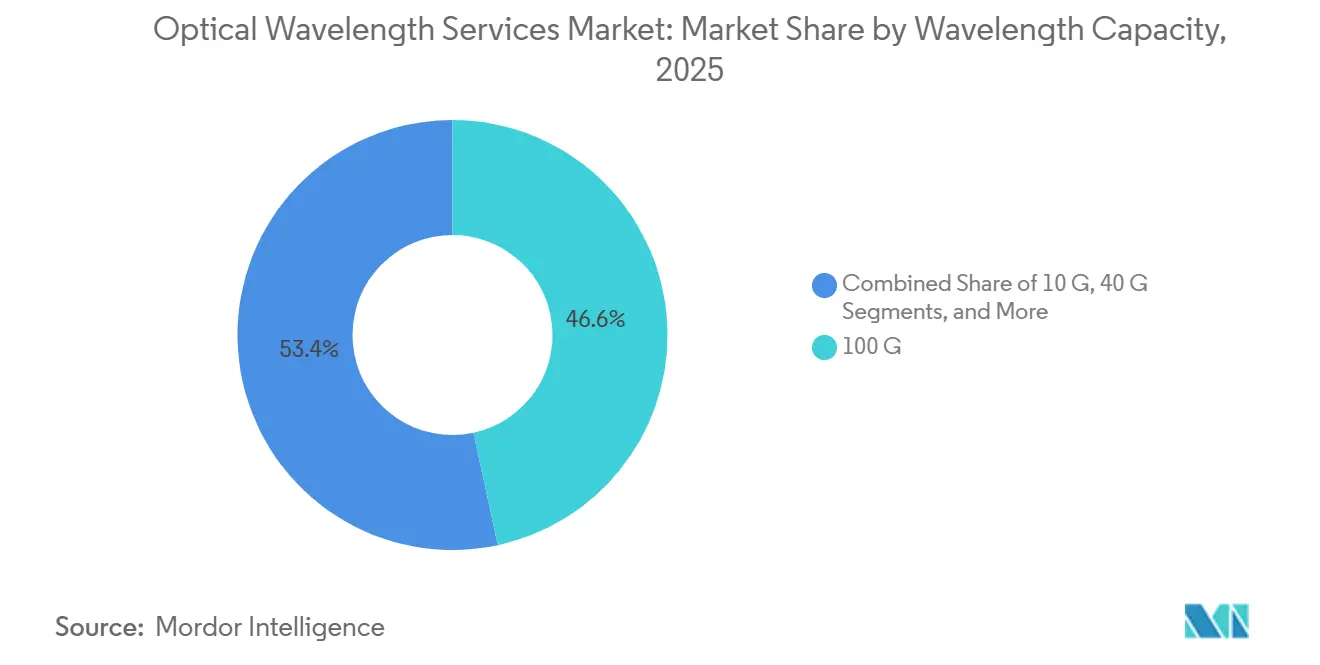
- By wavelength capacity, 100 G interfaces led with 46.63% of the optical wavelength services market share in 2025, while 800 G-and-above channels are advancing at a 13.34% CAGR to 2031.
- By service type, managed lit offerings captured 54.73% of revenue in 2025 in the optical wavelength services market; dark fiber and spectrum leasing are climbing 13.76% annually through 2031.
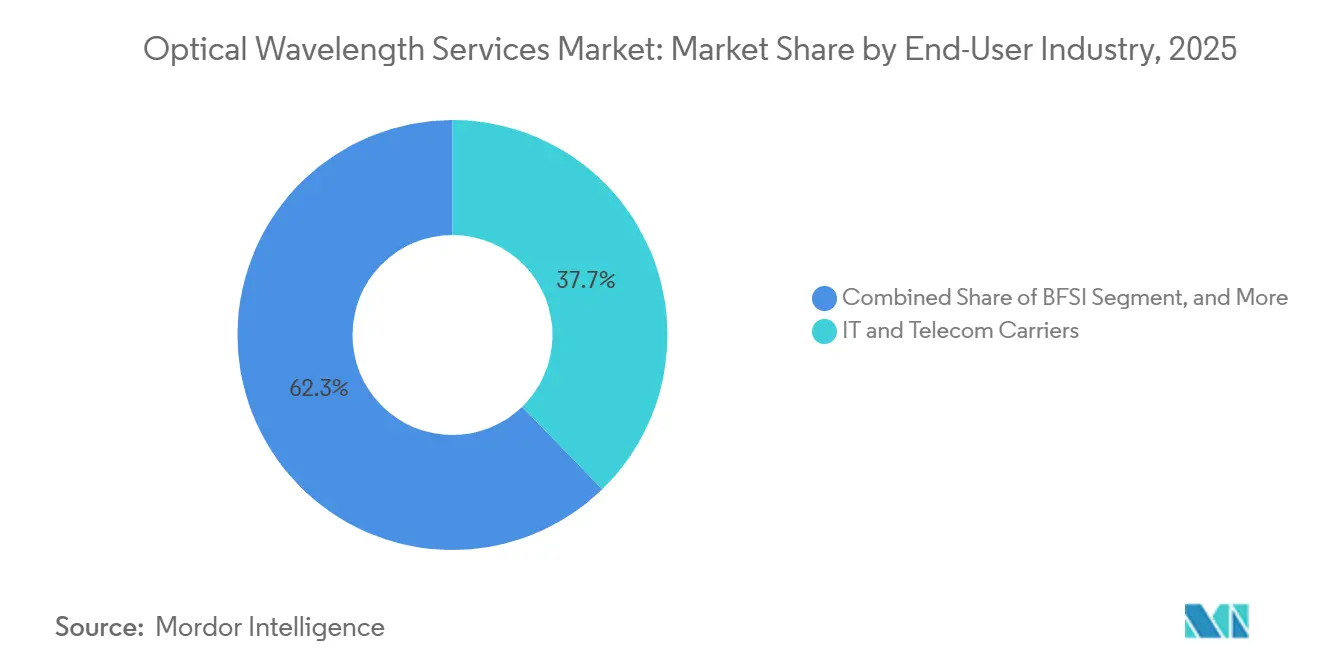
- By end-user, IT and telecom carriers held 37.73% share in 2025 in the optical wavelength services market, whereas cloud and hyperscale providers log the fastest 13.11% CAGR to 2031.
- By application, metro and access accounted for 41.82% of spending in 2025 in the optical wavelength services market; edge and inter-data-center links are scaling at a 13.33% CAGR through 2031.
- By geography, North America commanded 38.73% of revenue in 2025 in the optical wavelength services market; Asia Pacific is expanding at 13.56% a year to 2031.
Note: Market size and forecast figures in this report are generated using Mordor Intelligence’s proprietary estimation framework, updated with the latest available data and insights as of January 2026.
Market Trends and Insights
Drivers Impact Analysis of Optical Wavelength Services Market*
| Driver | (~) % Impact on CAGR Forecast | Geographic Relevance | Impact Timeline |
|---|---|---|---|
| Increasing data traffic and bandwidth demand | +2.8% | Global | Long term (≥ 4 years) |
| Surge in hyperscale and cloud DC footprints | +2.3% | North America and Asia Pacific | Medium term (2-4 years) |
| 5G backhaul and fronthaul densification | +1.9% | Global with Asia Pacific and Europe lead | Medium term (2-4 years) |
| AI-driven traffic pattern optimization | +1.2% | North America and Europe | Short term (≤ 2 years) |
| Growth of low-latency edge interconnect sites | +1.6% | Global with metro concentration | Medium term (2-4 years) |
| Sub-sea upgrade cycles to 800G-1.6T channels | +1.1% | Global submarine routes | Long term (≥ 4 years) |
| Source: Mordor Intelligence | |||
Increasing Data Traffic and Bandwidth Demand
Global IP traffic jumped from 4.8 zettabytes in 2025 to a forecast 8.2 zettabytes by 2030, pushing operators to migrate from 100 G to 400 G and 800 G coherent optics that multiply spectral efficiency.[1] Video streaming, cloud gaming, and generative-AI inference already constitute 82% of consumer traffic, while enterprise replication workloads maintain 35% annual inter-DC bandwidth growth.[2] Operators that guarantee sub-5 ms latency and 99.99% uptime, notably Lumen Technologies and Telia Carrier, are winning financial-services contracts across New York, London, and Tokyo. Deployments of Ciena WaveLogic 6 Extreme enable 1.6 Tb/s per wavelength, slashing cost per bit by 40% and reinforcing the optical wavelength services market’s value proposition. Looming 8K video, VR conferencing, and autonomous-vehicle telemetry will drive further uptake through 2031.
Surge in Hyperscale and Cloud DC Footprints
Hyperscalers commissioned 128 new data-center sites in 2025, raising the global count to 1,042 and jointly controlling 68% installed capacity. Each facility demands dedicated 400 G-800 G links for availability-zone replication and AI training clusters, compelling AWS to invest USD 15 billion, Microsoft Azure USD 12 billion, and Google Cloud in extensive subsea assets. Their vertical integration squeezes carrier margins and accelerates adoption of API-driven, on-demand wavelength platforms that the optical wavelength services market continues to monetize via value-added analytics and hybrid colocation bundles.
5G Backhaul and Fronthaul Densification
Operators deployed 2.8 million 5G base stations in 2025, a 47% lift over 2024, with each site requiring 10-100 Gb/s optical backhaul. Open RAN architectures demand sub-1 ms fronthaul, prompting Verizon, Vodafone, and China Mobile to secure 100 G-400 G wavelengths across metro fiber routes. Cost-sharing consortia in Europe and spectrum leasing in the United States shorten payback horizons and keep long-haul utilization high, supporting the optical wavelength services market’s sustained growth trajectory.
AI-Driven Traffic Pattern Optimization
Machine-learning platforms now govern 34% of optical capacity in North America and Europe, dynamically tuning modulation formats and rerouting traffic around impairments. Nokia’s Network Services Platform and Ciena’s Adaptive Network cut OPEX by up to 30%, while boosting throughput 12-18%, underscoring automation’s contribution to the optical wavelength services industry’s operating leverage. Early adopters in finance and content delivery report latency reductions below 10 ms, validating AI-optimized wavelengths as a differentiator in competitive bids.
Restraints Impact Analysis of Optical Wavelength Services Market*
| Restraint | (~) % Impact on CAGR Forecast | Geographic Relevance | Impact Timeline |
|---|---|---|---|
| High CAPEX for long-haul builds | -1.5% | Emerging markets and rural corridors | Long term (≥ 4 years) |
| Rapid wavelength-rate obsolescence | -1.0% | Global with legacy network concentration | Short to Medium term (≤ 4 years) |
| Scarcity of metro-core conduit in Tier-1 cities | -0.8% | North America, Europe, Asia Pacific metros | Medium term (2-4 years) |
| Lengthy rights-of-way permitting in emerging markets | -0.6% | Africa, South America, South Asia | Long term (≥ 4 years) |
| Source: Mordor Intelligence | |||
High CAPEX for Long-Haul Builds
A 1,000 km terrestrial route demands USD 80,000-120,000 per km in developed markets and USD 50,000-90,000 in emerging economies, while a transoceanic cable exceeds USD 300 million. Financing is becoming more challenging as the weighted average capital cost rose from 6.2% in 2023 to 8.7% in 2025, steering operators toward metro builds and slowing underserved corridor expansion. The USD 1 billion 2Africa cable, for instance, will not be cash-positive until 2029, highlighting the financing pressures in the optical wavelength services market. Vertical integration by hyperscalers further reduces addressable wholesale demand, and regulatory ambiguities in India, Brazil, and Nigeria extend permitting by up to 24 months.
Rapid Wavelength-Rate Obsolescence
The refresh cycle compressed to 5-7 years as carriers migrate from 100 G to 400 G and 800 G, stranding older assets and eroding ROI. Windstream reports 38% of its network still on sub-100 G speeds, requiring USD 1.2 billion to upgrade. With 1.6 T optics entering trials, smaller carriers risk stranded CAPEX if traffic fails to scale as projected, putting margin compression pressure on the optical wavelength services market.
*Our forecasts treat driver/restraint impacts as directional, not additive. The impact forecasts reflect baseline growth, mix effects, and variable interactions.
Optical Wavelength Services Market Segment Analysis
By Wavelength Capacity:
Coherent 800 G Pluggables Reshape EconomicsThe 100 G tier held 46.63% of optical wavelength services market share in 2025, reflecting its entrenched installed base. The 800 G and above cohort, however, is rising 13.34% annually, fueled by submarine upgrades and AI-centric DCI fabrics. The optical wavelength services market size, attributable to 400 G ports, captured 18% of shipments in 2025 and is now the de facto backbone for 5G transport. Meanwhile, 10 G and 40 G links continue a 4-6% annual decline as SONET and SDH systems are retired. The shift toward 1.6 T optics by 2028, already demonstrated on Southern Cross NEXT, suggests further suppression of legacy platform economics. Smaller operators weigh leasing wholesale 400 G-800 G wavelengths against upfront investment, tailoring decisions to traffic density and access to capital.
Upgrades are also aided by regulatory support, for instance, the FCC’s 2025 pole-attachment reforms reduced deployment costs and expedited fiber strand additions, indirectly accelerating the adoption of next-gen optics. Hyperscalers’ insatiable demand for AI training bandwidth has shifted the threshold of economic viability: capacity-hungry clusters can now justify premium coherent pluggables, solidifying 800 G as the new standard within the optical wavelength services market.

By Service Type:
Dark Fiber Gains as Hyperscalers Self-ProvisionManaged lit wavelengths delivered 54.73% of revenue in 2025 but are losing share to dark fiber and spectrum leasing, which grow 13.76% annually as cloud giants favor control over optical line systems. The optical wavelength services market size tied to Ethernet-over-wave and optical VPN offerings remains stable, catering to enterprises needing Layer-2 flexibility and hardware-level encryption.
Open-line-system advocacy from the Telecom Infra Project reduces vendor lock-in, allowing carriers to mix equipment and shave CAPEX 20-30%. Zayo’s spectrum-as-a-service and Lumen’s bundled edge colocation exemplify how incumbents innovate to retain clientele. For customers with fewer than ten sites, operational complexity keeps managed services compelling, but hyperscalers and large banks increasingly view dark fiber as strategic, accelerating vertical integration within the optical wavelength services market.
By End-User Industry:
Cloud Providers Outpace TelcosIT and telecom carriers held 37.73% demand share in 2025, yet cloud providers record the fastest 13.11% expansion as AWS, Google, and Microsoft lease or buy fiber outright. BFSI institutions, which represented 14% of revenue in 2025, deploy dedicated wavelength services to connect trading floors in New York, London, Hong Kong, and Tokyo with sub-5-millisecond latency, enabling high-frequency trading algorithms to execute arbitrage strategies across global equity and derivatives markets.
Healthcare’s tele-imaging needs and government supercomputing projects add steady incremental growth. Media players, led by Netflix and Disney, invest in dedicated routes for 4K-8K distribution, underscoring the optical wavelength services industry’s role in content delivery. Cloud players’ aggressive fiber buys foreshadow additional margin compression for traditional carriers but simultaneously enlarge the overall optical wavelength services market size as traffic scales.
By Application:
Edge Interconnect Surges Amid AI Inference DemandMetro and access use cases commanded 41.82% spending in 2025, supplying last-mile links to enterprises and 5G small cells. Edge and inter-data-center connections, however, grow 13.33% annually as AI inference workloads and CDNs migrate nearer to users. Regional and long-haul routes, which connect major metropolitan areas and cross national borders, captured most of revenue in 2025, with Telia Carrier's trans-Atlantic fiber network carrying an estimated 18% of all IP traffic between North America and Europe.
Submarine cable applications, representing 12% of demand, experienced accelerated investment in 2025, as Meta, Google, and Microsoft co-financed the Apricot subsea system, which links Japan, Taiwan, Guam, the Philippines, and Indonesia with 800G coherent transmission capability. Edge and inter-data-center wavelengths, which interconnect colocation facilities, cloud on-ramps, and distributed GPU clusters, accounted for 14% of revenue in 2025 but are expanding rapidly as generative-AI inference workloads require sustained multi-terabit bandwidth between model-serving endpoints and vector databases.
Geography Analysis
North America Optical Wavelength Services Market
North America’s 38.73% revenue share in 2025 rests on dense hyperscale footprints and 5G deployment. Verizon’s 15,000 C-band cell sites consumed around 22% of metro capacity, while AWS, Azure, and Google Cloud jointly leased more than 80,000 fiber-pair-kilometers across U.S. regions. Charter and Comcast expanded enterprise fiber routes by double digits, and Mexico’s near-shoring boom drove 9% optical growth in 2025. FCC pole-attachment reforms further bolster rural rollouts, keeping the optical wavelength services market resilient.
APAC Optical Wavelength Services Market
Asia Pacific, forecast at a 13.56% CAGR through 2031, benefits from China Telecom’s CNY 180 billion (USD 25 billion) 400 G-800 G upgrade plan and India’s INR 120 billion (USD 1.44 billion) BharatNet Phase III builds. Japan’s JPY 220 billion (USD 1.63 billion) urban deployments and twin SEA-H2X/Asia Link cables double regional subsea capacity, while South Korea’s AI-anchored data-centers escalate intra-DCI demand. Collectively, these initiatives reinforce Asia Pacific as the fastest-growing optical wavelength services market globally.
Europe Optical Wavelength Services Market
Europe’s 24% share in 2025 hinges on BT, Orange, and Telia Carrier’s metro extensions to serve 5G and cloud interconnects. The Gigabit Infrastructure Act, effective June 2025, simplifies rights-of-way and mandates infrastructure sharing, slashing project costs 18%.[3] Colt and euNetworks injected EUR 480 million (USD 542.4 million) into Frankfurt-Amsterdam-London-Paris routes, securing sub-5 ms latency for financial clients. Together, policy harmonization and private investments promise steady expansion for the region’s optical wavelength services market.
MEA and South America Optical Wavelength Services Market
Middle East and Africa represents 7% revenue but registers outsized momentum after 2Africa’s April 2025 launch. Saudi Arabia’s USD 6.4 billion national 400 G project, UAE’s AED 2.8 billion (USD 756 million) 5G backhaul investment, and Liquid Intelligent Technologies’ 22,000 km network extension collectively raise capacity and catalyze terrestrial build-outs. South America’s 6% share stems from Brazil’s 8,400 km metro expansions and Argentina’s USD 420 million Buenos Aires upgrade, illustrating spreading demand across the Southern Hemisphere.
Regulatory Landscape
Regulation affecting optical wavelength services is centered on infrastructure deployment rights, market access conditions for wholesale services, and technical interoperability standards for optical transport. In the European Union, the Gigabit Infrastructure Act (effective June 2025) is a concrete anchor shaping faster rights-of-way and infrastructure sharing. Policy debate is also shifting toward the proposed Digital Networks Act as a longer-term reform track for telecom networks and investment frameworks. In the United States, the FCC continues to push high-speed infrastructure enablement, and a March 2026 NPRM on legacy-to-all-IP transition topics (including intercarrier compensation and detariffing directions) signals ongoing changes to how legacy services are regulated as networks modernize.
Standards and compliance requirements remain important for service definitions and interconnect, with ITU-T Study Group 15 maintaining core optical transport recommendations used by equipment and service providers. Recent anchors include ITU-T G.709 Amendment 4 (July 2025) for OTN interfaces and ITU-T G.Sup85 (March 2025) addressing fgOTN service flows. Several national programs also influence backbone modernization priorities and permitting: Kenya's National Broadband Strategy 2025-2030 (published May 2026) and Lebanon's National Telecommunications and Digital Infrastructure Policy 2026-2030 (March 2026) explicitly support backbone upgrades, while the UK government issued an updated Statement of Strategic Priorities for telecommunications and spectrum in April 2026 to guide Ofcom toward secure, modern network outcomes.
Value Chain Analysis
The value chain for optical wavelength services spans fiber and conduit access (rights-of-way, poles, ducts), network build and operations (route engineering, construction, splicing, testing), optical transport equipment and software (coherent line systems, ROADMs, OTN/Ethernet switching, control and automation), and commercialization (wholesale wavelength and spectrum products, SLAs, portals/APIs, and managed services). Service providers such as incumbent carriers and specialist fiber operators package lit wavelengths, spectrum, or dark fiber, then deliver provisioning, performance assurance, and restoration across metro, regional/long-haul, and subsea routes. Demand pull is led by hyperscale DCI, 5G transport, and latency-sensitive enterprise connectivity, which increases the focus on automation platforms for faster turn-up and assurance and on open-line-system approaches to reduce lock-in.
Upstream supply dynamics increasingly shape service availability and delivery timelines, particularly for high-speed coherent optics (400G to 800G and above) and key photonics components. Supply bottlenecks in 800G/1.6T transceiver-class components and laser sources, linked to AI infrastructure demand, have pushed some vendors to diversify manufacturing and outsource more production, including to Southeast Asia. Structural shifts are also moving parts of the ecosystem toward tighter integration (silicon photonics and co-packaged optics initiatives led by major chip ecosystems), while operators and equipment partners prioritize field-ready scaling on live networks. Benchmarking and competitive positioning continue to concentrate around a handful of large providers in mature markets, with leading US wavelength service operators repeatedly cited as Lumen, Zayo, Verizon, AT&T, and Crown Castle in recent industry leaderboard assessments.
Competitive Landscape
The optical wavelength services market exhibits moderate fragmentation, with the top 10 providers, including Lumen Technologies, Verizon, AT&T, Zayo Group, and Telia Carrier, collectively controlling approximately half of global revenue in 2025, while regional operators, municipal fiber networks, and hyperscale operators' private backbones account for the remainder. Incumbent carriers face intensifying pressure from vertically integrated hyperscalers that now operate private optical networks spanning multiple continents, bypassing traditional wholesale wavelength services and compressing margins for Tier-1 providers. Lumen Technologies responded by bundling managed wavelength offerings with edge colocation and cloud on-ramp connectivity, targeting hybrid-cloud deployments that require seamless integration between on-premises data centers and public cloud regions.
Smaller pure-play fiber operators such as euNetworks and Colt Technology Services differentiate by offering sub-10-millisecond latency guarantees between financial hubs, capturing high-value accounts from investment banks and hedge funds executing high-frequency trading strategies.
White-space opportunities persist in underserved corridors, particularly intra-Africa routes where the 2Africa submarine cable's activation in 2025 opened demand for terrestrial wavelength extensions into landlocked markets, and secondary U.S. metro areas where municipal fiber networks compete with incumbent cable operators for enterprise accounts. Equipment vendors such as Nokia and Ciena are pivoting toward software-defined optical platforms and AI-driven network automation, filing over 180 patents related to coherent optics and machine-learning-based traffic engineering between 2024 and 2025.
Optical Wavelength Services Industry Leaders
-
Nokia Corporation
-
Zayo Group Holdings, Inc.
-
Verizon Communications Inc.
-
GTT Communications, Inc.
-
AT&T Inc.
- *Disclaimer: Major Players sorted in no particular order
Optical Wavelength Services Market Companies Covered in this Report
- Nokia Corporation
- Zayo Group Holdings, Inc.
- Verizon Communications Inc.
- GTT Communications, Inc.
- AT&T Inc.
- Lumen Technologies Inc.
- T-Mobile US, Inc.
- Crown Castle Inc.
- Comcast Corporation
- Charter Communications, Inc.
- Windstream Holdings, Inc.
- Colt Technology Services Group Ltd.
- Cox Communications, Inc.
- Jaguar Network SAS (Iliad)
- CarrierBid Communications
- euNetworks Group Ltd.
- Telia Carrier AB
- Exa Infrastructure Ltd.
- Ciena Corporation
- Orange S.A.
- BT Group plc
- Tata Communications Ltd.
- China Telecom Global Ltd.
- Liquid Intelligent Technologies
Market Opportunities and Future Outlook
Near-term opportunity centers on faster turn-up times and scaling 400G-to-800G service footprints where AI and cloud interconnect demand is densest, particularly on metro DCI corridors and major cloud on-ramps. The 2026 evidence points to AT&T expanding 400G wavelength availability across more than 40 US metro markets (including Ashburn, Atlanta, Chicago, and Dallas), widening the set of enterprises and content providers that need higher-capacity handoffs without bespoke builds. A second operational whitespace is service activation speed and procurement simplicity: Uniti Wholesale launched its FastWaves program in February 2026 using pre-deployed muxponders to compress delivery for 100G/400G wavelengths to under three weeks on targeted routes, supporting customers that prioritize rapid capacity adds for AI training, replication, and edge distribution.
Technology upgrades and standardization also create additional headroom for higher-capacity waves and more efficient spectrum use, even as they shorten the refresh cycle for providers. In January 2026, Colt deployed Ciena WaveLogic 6 Extreme on transatlantic and European terrestrial routes, lifting per-wave capacities (for example, from 450 Gbps to 1.2 Tbps on transatlantic links and from 600 Gbps to 1.5 Tbps on Lisbon-Madrid). This expands the practical use of wavelength services for bandwidth-intensive content and AI workloads. On the standards side, the Ethernet Alliance's 2026 Ethernet Roadmap highlights 1.6 Tbps Ethernet as an emerging interface direction and reinforces prioritization of 100G to 800G interconnects for AI-scale connectivity, strengthening the case for providers that can productize higher-rate wavelengths and integrate them with automated ordering, assurance, and flexible spectrum offerings.
Recent Industry Developments in Optical Wavelength Services Market
- June 2026: AT&T expanded its 400G wavelength service footprint across more than 40 US metro markets, including major hubs such as Ashburn, Atlanta, Chicago, and Dallas. This broadens 400G access for DCI-heavy customers and increases competitive pressure on other carriers to match higher-rate availability on metro routes.
- March 2026: Nokia partnered with Constl (a Space World Group subsidiary) to deploy a nationwide DWDM optical transport network across India. The deployment supports higher-capacity backbone modernization and supports growth in wavelength-based transport for carrier and cloud connectivity use cases.
- July 2025: Zayo completed full 400G enablement of its North American core network and added 393.6 terabits of optical capacity. The upgrade increases headroom for hyperscale and AI-driven traffic and strengthens Zayo's positioning in high-capacity wholesale wavelengths and spectrum services.
Optical Wavelength Services Market Report Scope and Research Methodology
Market Definition and Coverage
We define the optical wavelength services market as revenue earned from selling leased optical capacity over fiber networks, where customers buy dedicated wavelengths or spectrum to move high bandwidth traffic between sites.
Scope exclusions: We exclude sales of optical transport hardware, on premises switching equipment, and pure internet access or IP transit services that are billed independently of wavelength delivery.
Segments Covered in This Report
- By Wavelength Capacity
- 10 G
- 40 G
- 100 G
- 200 G
- 400 G and above
- By Service Type
- Managed (Lit) Wavelength
- Dark Fiber / Spectrum
- Ethernet‐over-Wave
- Optical VPN
- By End-user Industry
- IT and Telecom Carriers
- Cloud and Hyperscale Providers
- BFSI
- Healthcare and Life Sciences
- Government and Public Sector
- Media and Entertainment
- By Application
- Metro/Access
- Regional/Long-haul
- Sub-sea
- Edge/Inter-DC
- By Geography
- North America
- United States
- Canada
- Mexico
- South America
- Brazil
- Argentina
- Rest of South America
- Europe
- Germany
- United Kingdom
- France
- Italy
- Spain
- Rest of Europe
- Asia-Pacific
- China
- Japan
- India
- South Korea
- ASEAN
- Rest of Asia-Pacific
- Middle East and Africa
- Middle East
- Saudi Arabia
- United Arab Emirates
- Rest of Middle East
- Africa
- South Africa
- Nigeria
- Rest of Africa
- Middle East
- North America
Data Sources, Market Sizing, and Validation
Desk Research
Desk work was used to set the market boundaries, select practical demand indicators, and build starting ranges for pricing and adoption. For telecom context, we referenced public sources such as ITU indicators, OECD broadband and connectivity series, and FCC releases for US fiber and broadband context. For network and connectivity statistics outside the US, we used the European Commission and national regulators. Where trade and build activity needed cross-checking, we used UN Comtrade and national customs portals as a weak signal for network expansion, based on cross border equipment flows.
For operator and service context, we reviewed annual reports, SEC filings, investor decks, and network expansion press releases to map service portfolios and route footprints. Patents and standards references (including IEEE and IETF publications) were used to sanity check technology transitions such as 100G to 400G. We also used paid subscriptions for company financials and news screening, a patent database, and a global contracts and tenders feed to spot large wavelength deals and refresh assumptions. These sources are illustrative, and we also used other public and paid references for data collection, validation, and clarification.
Primary Interviews and Surveys
Primary work focused on interviews and structured surveys with carrier and wholesale teams, data center connectivity buyers, and network planning roles, so we could verify what is sold specifically as a wavelength service versus adjacent connectivity products. For a global view, we balanced discussions across APAC, EMEA, and the Americas, then used the feedback to tighten pricing ranges, confirm contract duration patterns, and identify where demand is moving toward higher capacity services.
Distribution of primary research fieldwork respondents
| Company type | Respondent position | Region |
|---|---|---|
| Top tier: 34% | CXOs: 17% | APAC: 47% |
| Mid tier: 47% | Functional/Unit leaders: 40% | EMEA: 34% |
| Smaller Players: 19% | Managers: 43% | Americas: 19% |
Market-Sizing & Forecasting
Sizing starts with a top-down build that reconstructs the demand pool from telecom and data traffic growth, inter-data-center connectivity needs, and the share of that demand typically served through leased wavelengths rather than IP based services. We then translate the demand pool into revenue using practical price per wavelength benchmarks, typical contract lengths, and mix shifts across 10G, 40G, 100G, 200G, and 400G and above services.
To keep the totals realistic, we corroborated results with selective bottom-up approximations. This included roll ups of service revenues disclosed by carriers where available, sampled ASP x route volume checks for major metro and long haul corridors, and channel checks on enterprise and cloud procurement patterns. When bottom-up inputs were incomplete, we handled gaps using coverage ratios (for example, disclosed versus undisclosed routes) and then cross checked those ratios with interview based utilization and win rate ranges.
Forecasting was built using scenario analysis supported by a multivariate regression view, where revenue growth is linked to indicators such as data center capacity additions, fiber route expansion activity, cloud traffic intensity, upgrades toward 400G, and relative pricing pressure over time. Assumptions were finalized after aligning the model with what interviewees described as achievable capacity adoption and pricing trends for the next planning cycle.
Data Validation & Update Cycle
We validated outputs through multiple checks, including comparing implied spend per connected site against typical enterprise and hyperscaler connectivity budgets, and testing whether modeled capacity additions align with observed network upgrade announcements. We flagged outliers when growth or pricing implied by the model drifted away from what operators and buyers described, then reworked those areas with tighter ranges.
Before sign-off, another analyst reviews the logic, key assumptions, and year over year movements so the final numbers remain consistent across regions and service types. Reports are refreshed annually, and interim updates are made when material events occur, such as large backbone expansions, major regulatory changes, or sharp pricing movements. Right before delivery, we do a final pass to ensure the latest public disclosures and market signals are reflected.
Mordor Intelligence's Optical Wavelength Services Market Size Versus Other Published Estimates
Published market sizes for optical wavelength services can vary because not every study counts the same service basket, and the same capacity can be priced differently depending on contract terms and route type. Differences also come from how studies treat bandwidth upgrades, how they convert currencies for multi-region contracts, and how frequently assumptions are refreshed.
The main gap comes from scope overlap with adjacent connectivity offerings, especially when Ethernet services, IP transit, or dark fiber are bundled into a single connectivity bucket. Some estimates also lean on aggressive capacity migration assumptions, which can inflate revenues if price declines are not modeled alongside 100G to 400G upgrades. Scope separation explains much of the spread, and in Mordor Intelligence's model, Optical VPN and Ethernet-over-Wave are counted only when the commercial construct is wavelength-based and billed as a wavelength service rather than generic enterprise networking.
Benchmark comparison
| Source | Market Size | Gaps in Research Methodology |
|---|---|---|
| Mordor Intelligence | USD 6.07 B (2026) | |
| Global Consultancy A | USD 5.42 B (2026) | Uses a narrower counting approach that leans heavily toward lit wavelength lines sold to carriers, and it appears to exclude parts of Ethernet-over-Wave and Optical VPN when bundled with broader managed networking contracts. |
| Industry Association B | USD 7.18 B (2026) | Applies a wider connectivity revenue bucket that likely pulls in dark fiber and some IP transport adjacent services, and it assumes faster mix shift to higher capacity wavelengths without fully offsetting the impact of declining unit pricing. |
The table shows that the largest differences come from what is included as a wavelength service and how price per capacity is treated as speeds scale up. By tying revenue to clear service definitions, capacity mix, and practical pricing checks, we keep the estimate traceable to inputs that can be rechecked as market conditions change.
Key Questions Answered in the Report
What is driving 12.40% CAGR for the optical wavelength services market through 2031?
Migration to 800 G-1.6 T optics, hyperscale DCI build-outs, 5G transport densification, and AI-driven automation collectively expand addressable demand.
Which regions will register the fastest growth?
Asia Pacific is projected at a 13.56% CAGR, led by China, India, Japan, and Southeast Asian submarine upgrades.
How are cloud providers changing procurement patterns?
AWS, Microsoft, and Google increasingly lease or acquire dark fiber, pushing carriers to offer flexible spectrum leasing and bundled edge services.
What risks could dampen deployments?
High long-haul CAPEX, rapid equipment obsolescence, metro conduit scarcity in Tier-1 cities, and slow permitting in emerging markets restrain rollouts.
Which capacity tier is growing the quickest?
800 G-and-above coherent pluggables, expanding 13.34% annually as operators refresh legacy 100 G networks.