
Optical Transport Network Market Size and Share
Market Overview
| Study Period | 2020 - 2031 |
|---|---|
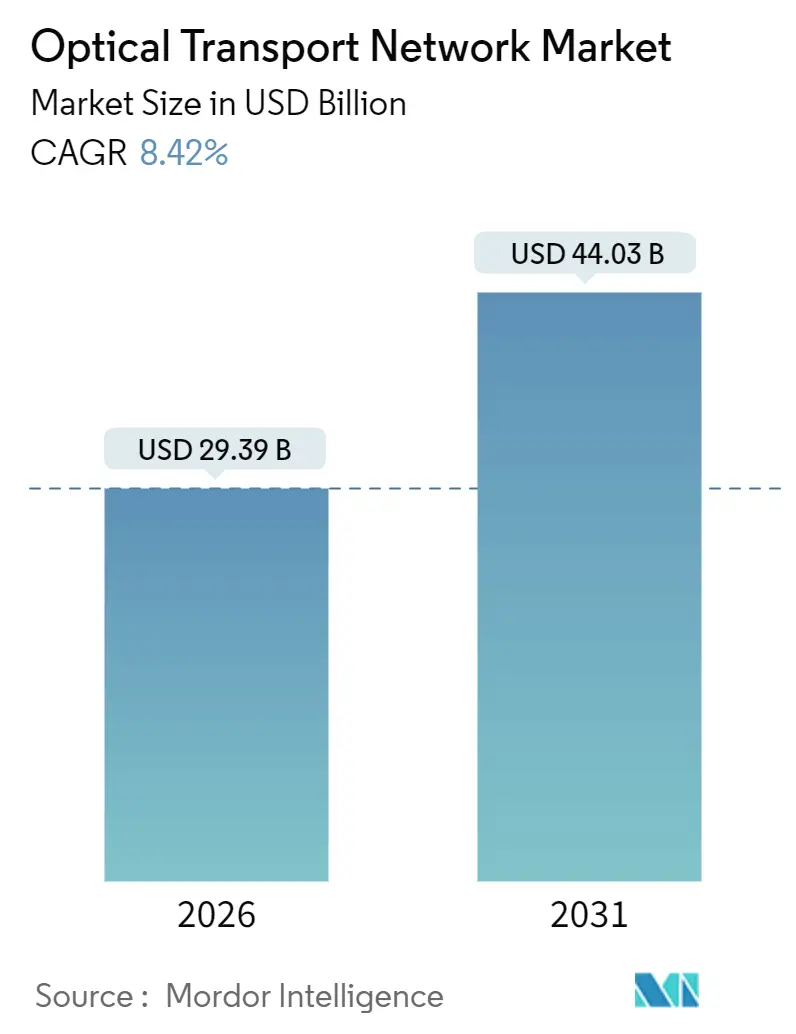
| Market Size (2026) | USD 29.39 Billion |
| Market Size (2031) | USD 44.03 Billion |
| Growth Rate (2026 - 2031) | 8.42 % |
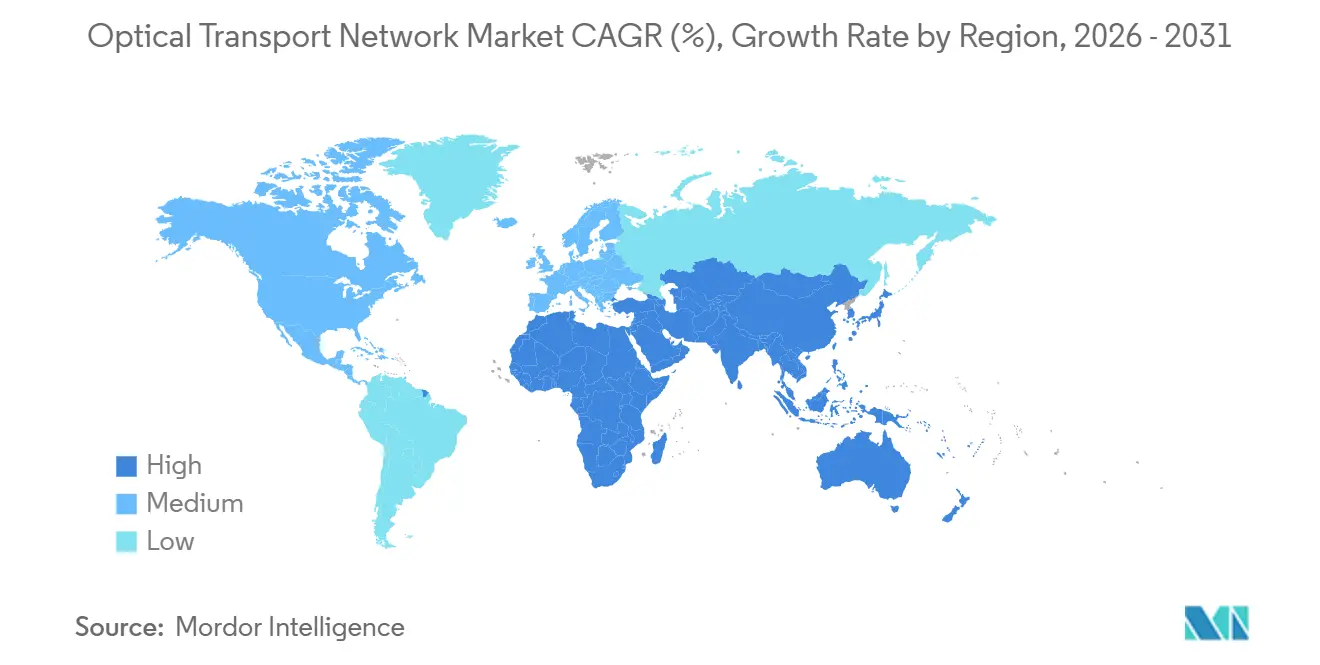
| Fastest Growing Market | Middle East |
| Largest Market | Asia Pacific |
| Market Concentration | Medium |
Major Players *Disclaimer: Major Players sorted in no particular order Image © Mordor Intelligence. Reuse requires attribution under CC BY 4.0. | |
Optical Transport Network Market Analysis by Mordor Intelligence
The optical transport network market size is USD 29.39 billion in 2026 and is forecast to reach USD 44.03 billion by 2031, advancing at an 8.42% CAGR. Momentum stems from hyperscale data-center interconnect (DCI) projects that now rival carrier long-haul upgrades, the mainstreaming of 400ZR/400ZR+ coherent pluggables, and multi-year government fiber stimulus in the United States and Europe. Equipment vendors benefit from dual demand streams, rural broadband buildouts, and hyperscaler AI cluster links that mitigate single-customer risk. Component commoditization is accelerating, yet service revenue is growing faster as carriers outsource design and integration for disaggregated open-line systems. Intensifying U.S.-China export controls, however, are fragmenting technology roadmaps and adding supply-chain risk.
Key Report Takeaways
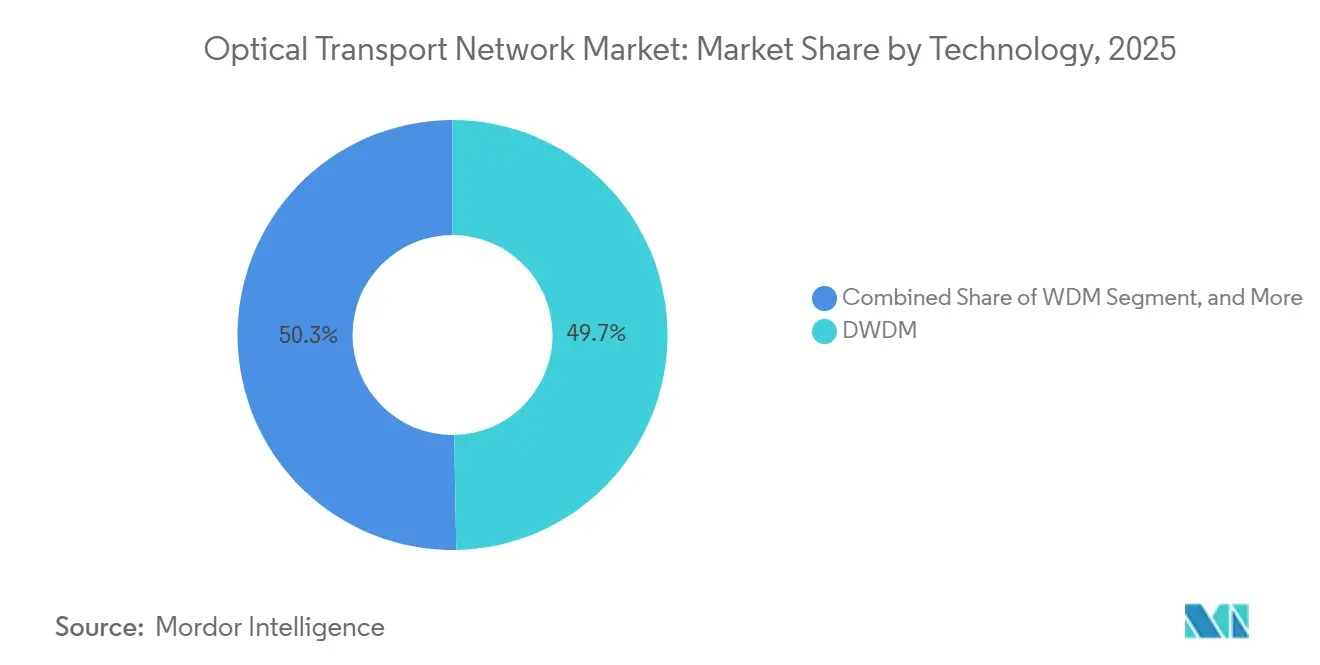
- By technology, DWDM led with 49.72% of the optical transport network market share in 2025, while WDM is projected to grow at a 9.11% CAGR through 2031.
- By offering, components accounted for 58.44% of 2025 revenue, whereas services are forecast to expand at an 8.89% CAGR over 2026-2031.
- By end-user vertical, IT and telecom operators held 43.83% of the optical transport network market share in 2025; cloud and colocation data centers are expected to log a 9.66% CAGR to 2031.
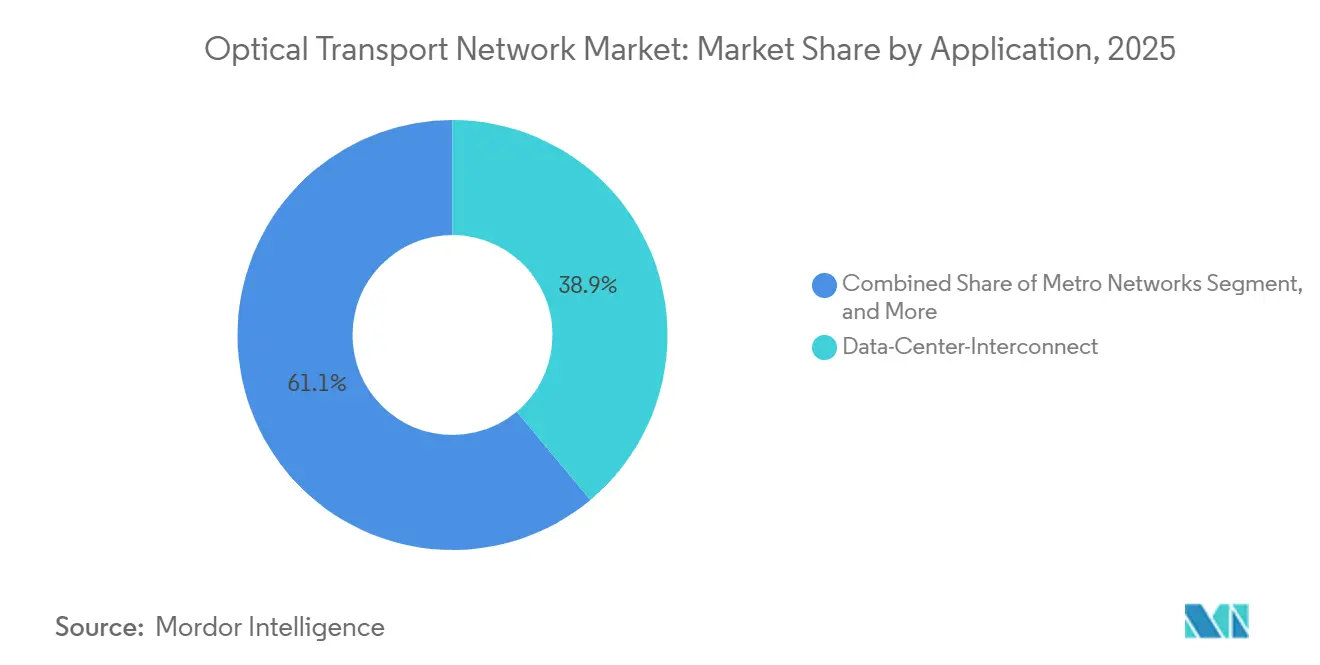
- By application, data-center interconnect captured 38.91% of 2025 revenue and is set to advance at an 8.94% CAGR through 2031.
- By data rate, wavelengths at 100-400 Gbit/s commanded 52.34% of the optical transport network market share in 2025, while beyond-800 Gbit/s systems will grow at an 8.42% CAGR.
- By geography, Asia-Pacific dominated with a 35.67% share in 2025, yet the Middle East is forecast to post the fastest CAGR of 9.47% through 2031.
Note: Market size and forecast figures in this report are generated using Mordor Intelligence’s proprietary estimation framework, updated with the latest available data and insights as of January 2026.
Market Trends and Insights
Drivers Impact Analysis of Optical Transport Network Market*
| Driver | (~) % Impact on CAGR Forecast | Geographic Relevance | Impact Timeline |
|---|---|---|---|
| Rapid 400 ZR/ZR+ Adoption for Data Center Interconnect | +1.8% | Global, led by North America and Asia-Pacific hyperscaler hubs | Short term (≤ 2 years) |
| Hyperscaler AI-Cluster Traffic Boom | +2.1% | North America, Europe, Asia-Pacific core markets | Medium term (2-4 years) |
| Government Fibre-Backhaul Stimulus | +1.3% | North America and Europe | Medium term (2-4 years) |
| Open-Line Systems Lowering Capex | +0.9% | Global, particularly North America and Europe | Long term (≥ 4 years) |
| Silicon Photonics Price Inflection | +1.0% | Global, manufacturing concentrated in Asia-Pacific | Long term (≥ 4 years) |
| Under-Sea Green-Field Cables | +0.7% | Global, spanning four continents | Long term (≥ 4 years) |
| Source: Mordor Intelligence | |||
Rapid 400 ZR/ZR+ Adoption for Data Center Interconnect
Microsoft’s Azure network surpassed 50,000 deployed 400ZR modules in 2025, proving that coherent pluggables slash footprint by 40% and power by 30% compared with legacy DWDM shelves.[1] Merchant-silicon suppliers now sell modules directly to hyperscalers, bypassing traditional optical vendors and reshaping procurement models. Ciena confirmed that pluggables accounted for 22% of WaveLogic revenue in fiscal 2025, up from 11% in the prior year. As hyperscalers standardize on 400ZR/400ZR+ for metro DCI links of 80-120 km, the optical transport network market gains a durable volume catalyst that offsets telco spending cyclicality.
Hyperscaler AI-Cluster Traffic Boom
Generative-AI training demands bandwidth dense enough to interconnect clusters of 25,000 GPUs at 400 Gbit/s, driving an unprecedented wave of DCI spending. Amazon Web Services, Microsoft Azure, Google Cloud, and Meta earmarked a combined USD 400 billion of 2026 capital outlays, roughly 35% of which targets networking infrastructure.[2] Transceiver lead times have stretched to 52 weeks for 800 Gbit/s devices, advantaging vendors with captive photonics fabs. The shift toward IP-over-DWDM architectures allows routers with integrated coherent optics to bypass OTN switching, trimming costs but lowering service-layer revenues for carriers.
Government Fibre-Backhaul Stimulus
The NTIA’s Broadband Equity Access and Deployment program injected USD 42.45 billion into U.S. rural fiber plans in November 2024, with Buy America rules prompting Corning’s USD 500 million expansion in North Carolina.[3] Europe’s Connecting Europe Facility 2 added EUR 2.07 billion (USD 2.2 billion) for cross-border fiber backhaul. Labor shortages, however, may delay deployments and compress equipment delivery windows, causing a bulge in orders during 2026-2027, followed by a possible trough.
Open-Line Systems Lowering Capex
Disaggregated architectures let operators source transponders, amplifiers, and ROADMs separately, slicing per-wavelength costs by up to 30%. Telefónica cut unit costs to USD 13,750 on its UNICA rollout in Spain and Brazil. While capex falls, integration complexity rises, spurring demand for professional services that lift overall vendor revenue even as hardware margins tighten.
Restraints Impact Analysis of Optical Transport Network Market*
| Restraint | (~) % Impact on CAGR Forecast | Geographic Relevance | Impact Timeline |
|---|---|---|---|
| Capex Freeze at Tier-2 Telcos | -1.2% | Europe, Latin America, parts of Asia-Pacific | Short term (≤ 2 years) |
| US-China Export Controls on Coherent DSPs | -0.8% | China, with regional supply-chain spillovers | Medium term (2-4 years) |
| Skilled-Labour Shortage for Fibre Installation | -0.6% | North America and Europe | Medium term (2-4 years) |
| Supply-Chain Dependency on InP Epitaxy | -0.5% | Global, concentrated in Japan and Taiwan | Long term (≥ 4 years) |
| Source: Mordor Intelligence | |||
Capex Freeze at Tier-2 Telcos (2024-2025)
Deutsche Telekom trimmed German fixed-network investment 8% year over year, while América Móvil reduced 2025 capex guidance in Brazil and Colombia by 12% in response to higher interest costs. Spending deferrals weigh on regional vendors such as ADVA, yet top suppliers partially hedge the shortfall with hyperscaler sales. Analysts expect a rebound once 5G backhaul needs and subsidy programs reignite upgrades after 2027.
US-China Export Controls on Coherent DSPs
The October 2024 Entity List action bars U.S. companies from shipping ≥600 Gbit/s coherent DSPs to China. Huawei is advancing a domestic 400 Gbit/s DSP, but performance lags Western 800 Gbit/s chips by 18 months. Dual technology roadmaps could fragment global standards and complicate multinational carrier operations.
*Our forecasts treat driver/restraint impacts as directional, not additive. The impact forecasts reflect baseline growth, mix effects, and variable interactions.
Optical Transport Network Market Segment Analysis
By Technology:
DWDM Anchors Revenue, WDM Leads GrowthDWDM systems held a 49.72% share of the optical transport network market in 2025, underscoring their dominance in long-haul and submarine corridors, where spectral efficiency dictates economics. Nokia’s PSE-6s platform shows that coherent pluggables can now serve metro access links, merging DWDM performance with WDM simplicity. WDM solutions will post a 9.11% CAGR as metro operators adopt lower-cost 5G backhaul architectures. In turn, merchant-silicon vendors capture value from this convergence, reshaping competitive dynamics.
Legacy O-band technology remains niche for campus interconnects but illustrates application-specific segmentation. Ciena reported an 18% jump in WaveLogic revenue in fiscal 2025, while its traditional OTN switching revenue fell 3%, signaling internal value migration. As coherent pluggables mature, DWDM economics extend toward edge nodes, putting pressure on smaller suppliers that lack R&D heft. The optical transport network market, therefore, faces consolidation even as technology options broaden.

By Offering:
Components Dominate, Services AccelerateComponents generated 58.44% of 2025 revenue, reflecting the large installed base of optical transport equipment. Yet services, projected to grow at an 8.89% CAGR, increasingly monetize the complexity of open-line systems. Cisco disclosed 68% gross margins for optical services, far above hardware margins, underscoring its strategic pivot toward recurring revenue.
The optical transport network market for services will expand as carriers outsource multi-vendor integration and capacity planning. Compact modular platforms such as Infinera’s GX G42 fuse switching and transport, reducing footprint and driving demand for lifecycle support over pure hardware refreshes. AI-driven diagnostics could erode some maintenance revenue, but vendors offset this by layering traffic optimization analytics on top of support contracts.
By End-User Vertical:
Cloud Providers Outpace TelcosIT and telecom operators still accounted for 43.83% of spending in 2025, yet hyperscale cloud and colocation customers will record a 9.66% CAGR, driven by AI clusters that demand low-latency links across multiple regions. Amazon’s commitment to deploy 100,000 coherent pluggables illustrates direct procurement at unprecedented scale, bypassing legacy distribution.
Government and defense buyers remain smaller yet high-value customers, favoring quantum-safe DWDM systems. Healthcare and banking invest in private optical links for compliance-driven disaster recovery, highlighting non-hyperscaler demand niches. Fragmented demand from energy, manufacturing, and retail often flows through channel partners, sustaining a long tail of integrators within the optical transport network industry.
By Application:
DCI Surges, Long-Haul MaturesData-center interconnect represented 38.91% of revenue in 2025 and will grow at an 8.94% CAGR as workload distribution intensifies. Microsoft’s Azure architecture employs 32-wavelength bundles delivering 12.8 Tbit/s per link, demonstrating DCI scale. In contrast, long-haul DWDM remains stable, driven mainly by submarine expansions, while metro networks face price pressure from dark-fiber overbuilders.
Enterprise networks increasingly rely on SD-WAN overlays, squeezing managed wavelength services, yet large campuses still justify private optical infrastructure. Vendors like Ciena package packet-optical transport and SD-WAN to capture this hybrid demand. The optical transport network market, therefore, tilts toward cloud-centric applications even as traditional carrier segments plateau.
By Data Rate/Wavelength:
100-400 Gbit/s Dominates, Above 800 Gbit/s EmergesWavelengths at 100-400 Gbit/s captured 52.34% share in 2025, reflecting both legacy 100 Gbit/s assets and the proliferation of 400ZR modules. Beyond-800 Gbit/s systems are forecast to grow at an 8.42% CAGR as silicon photonics yields improve, with Nokia demonstrating 1.6 Tbit/s over 500 km in 2025 lab trials.
Higher data rates offer 2-4× capacity at 1.5× cost, but power budgets remain challenging since 800 Gbit/s pluggables draw 22 watts. Infinera’s ICE 7 reduces this to 18 watts by monolithic integration, indicating ongoing efficiency gains. The optical transport network market size attached to 800 Gbit/s and above will rise steadily once module costs align with traffic curves after 2028.
Geography Analysis
APAC Optical Transport Network Market
Asia-Pacific held 35.67% of 2025 revenue, buoyed by China’s backbone upgrades and India’s BharatNet Phase III, which allocated INR 1.39 trillion (USD 16.8 billion) to rural fiber. China’s three state carriers installed 180,000 new 100 Gbit/s wavelengths during 2024-2025. U.S. export controls, however, could slow China’s transition to 800 Gbit/s gear, widening the technology gap with Western operators. Japan and South Korea continue to drive submarine innovation, with NEC securing a 24-fiber-pair Tokyo-Los Angeles cable supporting 400 Tbit/s.
Saudi Arabia and United Arab Emirates Optical Transport Network Market
The Middle East is projected to post the fastest CAGR of 9.47% through 2031. Saudi Arabia’s Public Investment Fund committed USD 6.4 billion to twelve hyperscale data centers in 2025, each requiring 400 Gbit/s redundant links. UAE-based Khazna Data Centers is deploying 1.6 Tbit/s WaveLogic 6 optics on the Dubai-Abu Dhabi corridor, underlining sovereign efforts to localize AI training workloads.
North America and Europe Optical Transport Network Market
North America and Europe remain the largest absolute markets thanks to legacy DWDM estates awaiting refresh. The BEAD program’s USD 42.45 billion stimulus will drive metro DWDM and coherent-pluggable demand, while Europe’s submarine projects, such as EllaLink and 2Africa, sustain long-haul orders. Capex freezes at some tier-2 European telcos temper near-term growth, yet cross-border CEF-2 funds of EUR 2.07 billion (USD 2.2 billion) should close connectivity gaps in Poland, Romania, and Greece. Regulatory oversight by the FCC and ETSI ensures interoperability, tempering vendor lock-in but potentially lengthening approval cycles.
Mordor Intelligence provides coverage of the optical transport network market across other key regional markets. Detailed country-level analysis extends to India incorporating local coverage and market participation, as required.
Regulatory Landscape
The optical transport network market is influenced by telecom modernization programs and standards-led interoperability requirements. In the United States, the Federal Communications Commission advanced all-IP transition actions in 2026, including a March 2026 Notice of Proposed Rulemaking on legacy intercarrier compensation reforms and an April 2026 Report and Order aimed at reducing barriers and costs tied to discontinuance and technology-transition rules.
On the standards side, ITU-T continues to update OTN functional architecture and interface definitions that support multi-vendor deployment. ITU-T G.872 was revised in March 2024 to expand fine-grained OTN capabilities, ITU-T G.798 received Amendment 2 in December 2024 with updates relevant to FlexO and fgOTN applications, and ITU-T G.709/Y.1331 received Amendment 4 in July 2025. In China, the publication of YD/T 6666-2026 (800 Gbit/s OTN interface technical requirements), effective June 1, 2026, establishes a domestic compliance reference point for 800G interface implementations alongside global ITU-T guidance.
Value Chain Analysis
The value chain covers upstream photonic materials and semiconductor processing, component manufacturing (lasers, modulators, coherent DSPs, photonic integrated circuits, and optical amplifiers), system integration (transponders, ROADMs, optical switches, OTN shelves, and open line systems), and downstream routes through direct hyperscaler procurement, carrier tenders, and specialist integrators providing design, deployment, and lifecycle support. Standardization and management models from ITU-T (including updates to G.872 in March 2024 and amendments to G.798 and G.875 in December 2024) apply across the chain as enabling specifications for interoperable transport functions and operations.
Supply risk clusters in a few chokepoints. Refined gallium processing is concentrated in China, InP substrate supply is controlled by a small group of vendors (for example, Sumitomo Electric and JX Advanced Metals alongside AXT), and coherent DSP supply is concentrated among a limited number of merchant silicon providers (notably Broadcom and Marvell). This concentration increases the importance of long-term sourcing, qualification across multiple component vendors, and service-led integration capabilities as operators adopt disaggregated architectures and coherent pluggables for DCI and metro transport.
Competitive Landscape
The optical transport network market exhibits moderate concentration, with Nokia, Ciena, and Huawei together controlling about 60% of DWDM line-system sales. Merchant-silicon entrants Marvell and Broadcom now supply coherent DSPs directly to hyperscalers, eroding integrated-vendor margins. Ciena’s WaveLogic modules, at 48% gross margin, trail its 62% margin on full systems, illustrating pricing pressure.
Strategic moves reflect adaptation. Nokia acquired Infinera in January 2025 for USD 2.3 billion to pool R&D and broaden its coherent portfolio. Cisco exited the component business by divesting Acacia in September 2025, pivoting to SDN and AI routing software. White-box vendors such as Ribbon and Padtec target cost-conscious tier-2 carriers with OpenROADM-compliant gear, though integration complexity limits adoption to operators with advanced engineering talent.
Patent filings show heavy investment in probabilistic constellation shaping and digital subcarrier multiplexing to raise spectral efficiency 20-30%. Compliance with ITU-T G.698.2 and OpenROADM MSAs secures baseline interoperability while permitting proprietary performance tweaks. As coherent pluggables commoditize, software orchestration and services differentiation will decide competitive advantage rather than raw optical reach.
Optical Transport Network Industry Leaders
-
Nokia Corporation
-
Ciena Corporation
-
Cisco Systems, Inc.
-
Huawei Technologies Co., Ltd.
-
Fujitsu Limited
- *Disclaimer: Major Players sorted in no particular order

Optical Transport Network Market Companies Covered in this Report
- Nokia Corporation
- Ciena Corporation
- Cisco Systems, Inc.
- Huawei Technologies Co., Ltd.
- Fujitsu Limited
- ZTE Corporation
- Infinera Corporation
- Telefonaktiebolaget LM Ericsson
- NEC Corporation
- ADVA Optical Networking SE
- Ribbon Communications Inc.
- Tejas Networks Limited
- Juniper Networks, Inc.
- Sterlite Technologies Limited
- Padtec Holding S.A.
- FiberHome Telecommunication Technologies Co., Ltd.
- Lumentum Holdings Inc.
- Coherent Corp.
Market Opportunities and Future Outlook
AI-driven DCI buildouts and faster activation models are expanding whitespace for modular optical transport, coherent pluggables, and services that compress delivery and integration cycles. A recent example is Uniti Group launching its FastWaves program in February 2026, aimed at delivering 100G and 400G wavelength services in under three weeks using pre-deployed muxponders. This reflects customer demand for pre-positioned capacity and repeatable deployment templates that pull through components, line systems, and professional services.
Higher-capacity wavelengths in long-haul and submarine corridors also create room for 800G/1T-class coherent engines and open line systems optimized for scale. In May 2026, Matrix NAP Info activated Ciena WaveLogic 6 Extreme on the Batam-Jakarta segment of the Matrix Cable System, demonstrating 1 Tb/s-per-wavelength operation on an in-service route. Large modernization programs add more addressable scope for node refresh and integration work, including Proximus commencing its NEURON project in July 2026 to modernize its nationwide DWDM network, targeting roughly 700 nodes for replacement, which supports demand for interoperable ROADMs, automation, and multi-vendor engineering services.
Recent Industry Developments in Optical Transport Network Market
- June 2026: Huawei unveiled AI-OTN and AI-FAN solutions and introduced additional AI-optical network products at MWC Shanghai 2026. The launch expands Huawei's portfolio around intelligent transport operations and higher-capacity optical layers, reinforcing competitive pressure on incumbent packet-optical and OTN vendors serving carrier backbones and DCI.
- May 2026: Matrix NAP Info activated Ciena GeoMesh Extreme, powered by WaveLogic 6 Extreme, on the Batam-Jakarta segment of the Matrix Cable System. The deployment demonstrated 1 Tb/s per wavelength on an operational submarine corridor, raising the performance baseline for subsea and long-haul upgrades and reinforcing Ciena's pull-through for coherent engines and line systems.
- November 2024: The NTIA announced USD 42.45 billion in Broadband Equity Access and Deployment (BEAD) program state allocations for rural broadband fiber buildouts. The funding program, along with domestic sourcing requirements, set up a multi-year procurement cycle for metro and access transport upgrades and supported upstream fiber manufacturing investment such as Corning's USD 500 million expansion in North Carolina.
Optical Transport Network Market Report Scope and Research Methodology
Market Definition and Coverage
For this study, the optical transport network (OTN) market is defined as the revenue earned from hardware, software, and related services used to carry high-capacity traffic over optical fiber across metro, long-haul, and data center interconnect networks.
Scope exclusions: This excludes legacy SONET/SDH equipment and purely electrical packet switching equipment that does not perform optical transport functions.
Segments Covered in This Report
- By Technology
- WDM
- DWDM
- O-Band and Other Technologies
- By Offering
- Services
- Network Maintenance and Support
- Network Design and Integration
- Components
- Optical Transport Equipment
- Optical Switch
- Optical Platform/Edge ROADM
- Services
- By End-User Vertical
- IT and Telecom Operators
- Cloud and Colocation Data Centres
- Government and Defence
- Healthcare
- Banking and Financial Services
- Other End-User Verticals
- By Application
- Long-Haul DWDM
- Data-Center-Interconnect
- Metro Networks
- Enterprise Networks
- By Data Rate / Wavelength
- 100-400 Gbit/s
- 400-800 Gbit/s
- Beyond 800 Gbit/s
- By Geography
- North America
- United States
- Canada
- Mexico
- Europe
- Germany
- United Kingdom
- France
- Russia
- Rest of Europe
- Asia-Pacific
- China
- Japan
- India
- South Korea
- Australia
- Rest of Asia-Pacific
- Middle East and Africa
- Middle East
- Saudi Arabia
- United Arab Emirates
- Rest of Middle East
- Africa
- South Africa
- Egypt
- Rest of Africa
- Middle East
- South America
- Brazil
- Argentina
- Rest of South America
- North America
Data Sources, Market Sizing, and Validation
Desk Research
Desk research was used to build a clean base of definitions, demand signals, and supply indicators before modeling was finalized. We relied on public sources such as the International Telecommunication Union (ITU) for broadband and traffic indicators, the World Bank for macro and ICT context, and national telecom regulators (including the FCC where applicable) for infrastructure and spectrum rollout direction that affects backhaul needs.
To tie the market closer to real deployments, we also reviewed sources such as OECD digital statistics, cable and fiber association publications, and peer-reviewed journals that cover optical networking trends like coherent optics and higher data-rate migration. On top of this, we screened company annual reports, earnings call transcripts, investor presentations, and credible press coverage to track product cycles, capex routing, and shipment commentary. Where needed, paid subscriptions for company financials and intelligence, patent databases, and an import-export shipment-level database were used to validate corporate exposure and trade movement signals. These sources are illustrative, and additional public and paid references were used for cross-checking, data collection, and clarification.
Primary Interviews and Surveys
Primary work was completed through expert interviews and structured surveys with network planners, product managers, channel partners, and service providers who buy, specify, or integrate OTN solutions. Since this is a global market, inputs were balanced across APAC, EMEA, and the Americas so assumptions such as pricing steps (100G to 400G to 800G), replacement cycles, and service attachment rates could be checked consistently before final totals were signed off.
Distribution of primary research fieldwork respondents
| Company type | Respondent position | Region |
|---|---|---|
| Top tier: 27% | CXOs: 14% | APAC: 42% |
| Mid tier: 54% | Functional/Unit leaders: 27% | EMEA: 35% |
| Smaller Players: 19% | Managers: 59% | Americas: 23% |
Market-Sizing & Forecasting
Sizing was built using a top-down approach where network investment signals and traffic growth indicators were reconstructed into an addressable OTN spend pool, then filtered by what portion is realistically allocated to optical transport layers. Inputs used in the model include telecom and cloud network capex direction, fiber route expansions, the mix shift toward higher line rates (such as 100-400G and 400-800G), metro versus long-haul build patterns, and the pace of coherent optics adoption that changes average system pricing over time.
Once main totals were obtained, they were corroborated using selective bottom-up checks, such as sampled ASP times estimated shipment volumes for key equipment classes, and channel checks on services-to-hardware attachment in major deployments. When sub-segment gaps appeared, proxy ranges were applied using expert-validated discount bands and typical configuration mix, and then totals were rebalanced back to the main market number.
For forecasting, we used scenario analysis supported by a simple multivariate regression layer to keep growth linked to drivers that respondents consistently pointed to, mainly traffic growth, 5G transport rollout timing, and data center interconnect expansion. The forecast also accounts for expected price erosion at mature data rates and step-ups in ASP when higher-capacity platforms become the standard in new builds.
Data Validation & Update Cycle
Validation was done through repeated cross-checks between model outputs and independent signals, including capex trends, regional build announcements, and the implied price-volume mix from interviews. Where results looked abnormal, assumptions were reopened and the relevant respondents were re-contacted so the variance could be explained, rather than averaged away.
Before sign-off, the sizing logic and calculations went through multi-step analyst reviews, where inputs, conversion factors, and year alignment were checked line by line. Reports are refreshed annually, and interim updates are triggered when material events occur, such as major spending revisions or technology inflection points. Right before delivery, a fresh review pass is completed so clients receive the most current view available at that time.
Mordor Intelligence's Optical Transport Network Market Size Measured Against Other Published Estimates
Published OTN market values often differ because each publisher draws the boundary of what counts as OTN a little differently, and they also vary in how they handle pricing erosion versus step-ups when higher line rates take over. Differences in base year alignment, currency conversion timing, and how services are treated (bundled versus separated) also create visible gaps.
A refresh-led gap is common in this market because average selling prices can move quickly when 400G and 800G platforms ramp, and then discounts deepen as deployments broaden. By re-checking currency timing and ASP progression during each update cycle, and then re-validating the implied price-volume mix with operator and integrator interviews, Mordor Intelligence reduces drift that can show up when older price points are carried forward.
Benchmark comparison
| Source | Market Size | Gaps in Research Methodology |
|---|---|---|
| Mordor Intelligence | USD 29.39 B (2026) | |
| Industry Research Publisher A | USD 25.50 B (2024) | Uses an earlier base year and shows internal inconsistency on the same page (a second 2024 value is also presented), which can shift totals when pricing and scope are not reconciled across tables and narrative. |
| Industry Research Publisher B | USD 22.40 B (2024) | Anchors the market to a different start year and growth window, and it is not fully clear how services and component bundles are valued, which can understate the spend when higher-capacity platform refresh cycles are included. |
Overall, the spread is mainly explained by year alignment and how pricing is carried through technology transitions, not by a single demand driver. The approach here keeps the total traceable to clear build and upgrade indicators, and it stays repeatable because each assumption is tied back to observable deployment and capex signals that can be checked again in the next refresh.
Key Questions Answered in the Report
How large is the optical transport network market in 2026?
The optical transport network market size is USD 29.39 billion in 2026.
What is the projected CAGR for optical transport equipment from 2026-2031?
Overall revenue is forecast to grow at an 8.42% CAGR through 2031.
Which technology segment will grow fastest?
WDM systems are forecast to post the highest 9.11% CAGR as metro operators adopt simpler architectures.
Why are hyperscalers influencing procurement patterns?
Cloud and colocation data centers need low-latency data-center interconnect links for AI workloads, driving direct purchases of coherent pluggables at scale.
How will U.S. BEAD funding affect vendor demand?
BEAD’s USD 42.45 billion allocation is set to create a multi-year procurement cycle for metro DWDM and coherent pluggable modules across rural broadband builds.
What challenges could limit market expansion?
Export controls, tier-2 telco capex freezes, and skilled-labor shortages for fiber installation all pose near-term headwinds.