
Optical Genome Mapping Market Size and Share
Market Overview
| Study Period | 2020 - 2031 |
|---|---|
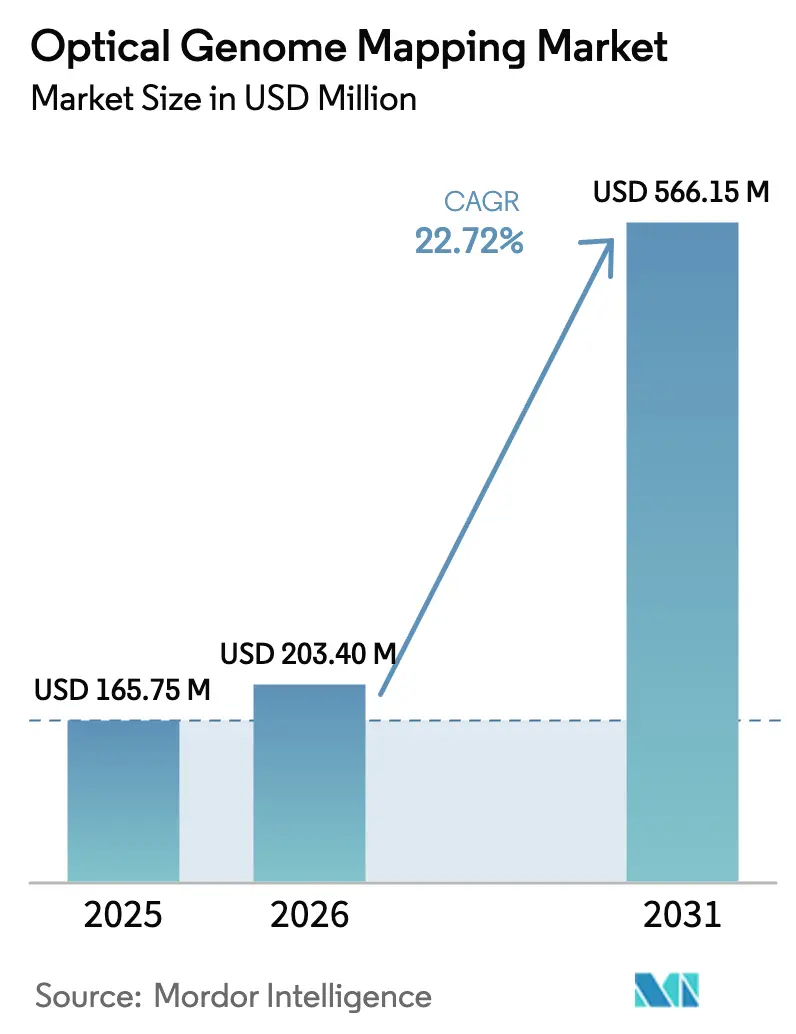
| Market Size (2026) | USD 203.4 Million |
| Market Size (2031) | USD 566.15 Million |
| Growth Rate (2026 - 2031) | 22.72 % |
| Fastest Growing Market | Asia-Pacific |
| Largest Market | North America |
| Market Concentration | Medium |
Major Players *Disclaimer: Major Players sorted in no particular order Image © Mordor Intelligence. Reuse requires attribution under CC BY 4.0. | |
Optical Genome Mapping Market Analysis by Mordor Intelligence
Optical Genome Mapping Market size in 2026 is estimated at USD 203.4 million, growing from 2025 value of USD 165.75 million with 2031 projections showing USD 566.15 million, growing at 22.72% CAGR over 2026-2031.
This solid trajectory is anchored in the technology’s ability to uncover structural variants that traditional karyotyping and fluorescence in situ hybridization routinely overlook, especially within complex or repetitive genomic regions. Clinicians appreciate that optical genome mapping delivers genome-wide resolution down to 500 base pairs in a single workflow, capturing structural variations, copy-number variants, and chromosomal rearrangements with speed and precision. Instruments constitute the dominant product class, yet escalating consumable usage signals ongoing test-volume expansion as laboratory throughput rises. Oncology remains the largest application area, whereas rare-disease diagnostics are advancing fastest due to the method’s high diagnostic yield in previously unresolved conditions. Robust adoption in biotechnology and pharmaceutical companies co-exists with accelerating uptake in research institutions; the latter reflects mounting academic investment in genomic infrastructure to support precision-medicine programs.
Key Report Takeaways
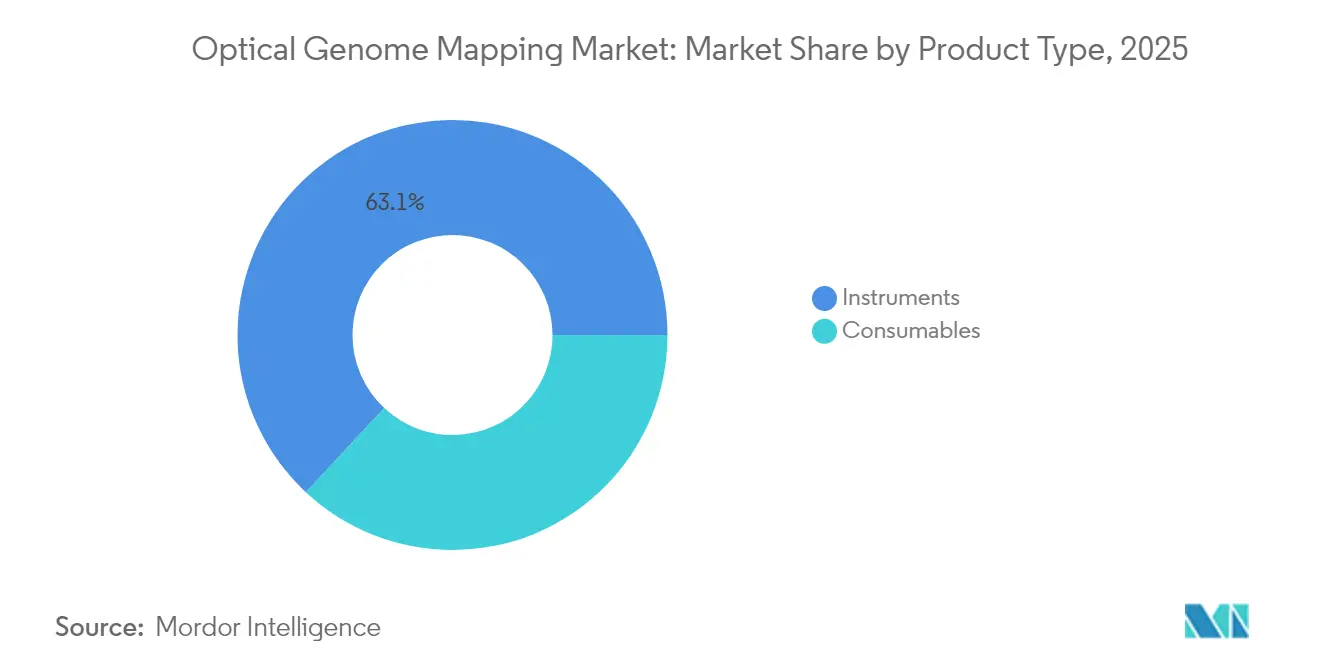
- By product type, instruments led with 63.05% of optical genome mapping market share in 2025; consumables are forecast to grow at a 25.10% CAGR through 2031.
- By application, oncology captured 29.35% revenue share in 2025, while rare-disease and constitutional genetics are projected to expand at a 27.20% CAGR to 2031.
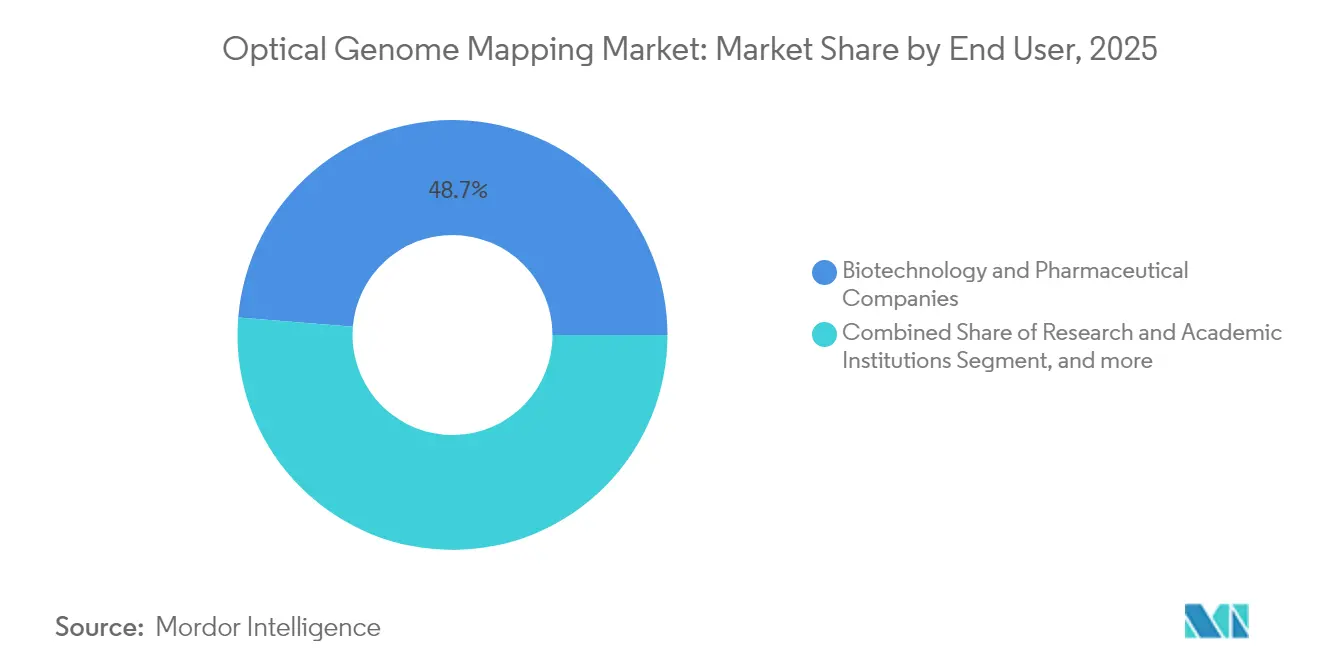
- By end user, biotechnology and pharmaceutical companies held 48.70% share of the optical genome mapping market size in 2025; research and academic institutions record the highest projected CAGR at 23.90% through 2031.
- By geography, North America commanded 41.95% share in 2025, whereas Asia is advancing at a 28.90% CAGR to 2031.
Note: Market size and forecast figures in this report are generated using Mordor Intelligence’s proprietary estimation framework, updated with the latest available data and insights as of 2026.
Market Trends and Insights
Drivers Impact Analysis of Optical Genome Mapping Market*
| Driver | (~) % Impact on CAGR Forecast | Geographic Relevance | Impact Timeline |
|---|---|---|---|
| Rising demand for advanced genomic analysis | +6.2% | Global, concentrated in North America & Europe | Medium term (2-4 years) |
| Growing prevalence of genetic disorders and cancer | +4.8% | Global, particularly Asia-Pacific emerging markets | Long term (≥ 4 years) |
| Limitations of traditional cytogenetic methods | +3.9% | Global, accelerated in developed markets | Short term (≤ 2 years) |
| Technological advancements in genomics | +3.1% | North America & Europe core, spill-over to Asia | Medium term (2-4 years) |
| Expanding applications in precision medicine | +2.7% | Global, led by North America regulatory framework | Long term (≥ 4 years) |
| Increasing collaborations and investments | +1.8% | Global, concentrated in biotech hubs | Short term (≤ 2 years) |
| Source: Mordor Intelligence | |||
Rising Demand for Advanced Genomic Analysis
Health systems acknowledge that legacy cytogenetic techniques can miss up to 40% of clinically relevant structural variants. Optical genome mapping corrects this gap, identifying additional actionable variants in 58% of hematological malignancy cases compared with current standard testing. Laboratories value the single-assay workflow that trims turnaround from weeks to days while boosting diagnostic accuracy. The prospect of Medicare reimbursement under Category I CPT coding underscores financial viability for providers, and the shift toward genomic-first diagnostics in oncology cements sustainable demand growth.
Growing Prevalence of Genetic Disorders and Cancer
Escalating cancer incidence, coupled with recognized genetic heterogeneity, fuels the need for high-resolution structural-variant profiling. Optical genome mapping detects drug-resistance mechanisms invisible to conventional methods, allowing physicians to revise therapies earlier. Rare-disease programs benefit as well; studies show detection of pathogenic variants in 15% of cases that were inconclusive with short-read sequencing.[1]Nature Research, “Optical Genome Mapping in Rare Disease,” nature.comFalling sequencing costs, expanding precision-medicine initiatives, and improved analytics reinforce optical genome mapping’s role across diverse patient cohorts.
Limitations of Traditional Cytogenetic Methods
Standard karyotyping requires dividing cells and offers limited resolution, while fluorescence in situ hybridization interrogates only known targets, leaving balanced translocations and complex rearrangements unnoticed. Optical genome mapping, by analyzing ultra-long DNA molecules without amplification bias, detects events as small as 500 bp across the entire genome.[2]Nature Research, “Optical Genome Mapping in Rare Disease,” nature.com Laboratories replace sequential testing with a single assay, streamlining workflows and reducing cumulative cost.
Technological Advancements in Genomics
Automation and AI-driven analytics now accompany optical genome mapping platforms. Bionano Genomics’ partnership with NVIDIA quadruples data-processing speed, cutting analysis from days to hours.[3]NVIDIA Corporation, “Accelerated Genomic Analysis Collaboration,” nvidia.com Variant-interpretation software such as VIA achieves full reviewer concordance, easing reliance on scarce bioinformatics specialists. These developments lower expertise barriers, enhance throughput, and improve cost-effectiveness, supporting further penetration of the optical genome mapping market.
Restraints Impact Analysis of Optical Genome Mapping Market*
| Restraint | (~) % Impact on CAGR Forecast | Geographic Relevance | Impact Timeline |
|---|---|---|---|
| High instrument costs | -2.1% | Global, particularly emerging markets | Short term (≤ 2 years) |
| Requirement for specialized expertise | -1.4% | Global, more pronounced in smaller laboratories | Medium term (2-4 years) |
| Concerns over data interpretation and standardization | -1.2% | Global, critical in clinical diagnostics | Medium term (2-4 years) |
| Regulatory and ethical considerations | -0.8% | North America & Europe primarily | Long term (≥ 4 years) |
| Source: Mordor Intelligence | |||
High Instrument Costs
Purchasing a Saphyr or high-throughput Stratys system requires significant capital outlays. Smaller laboratories, particularly in emerging markets, perceive this as a hurdle. Nonetheless, workflow consolidation offsets the burden by lowering per-sample costs and avoiding multiple complementary assays. Leasing and reagent-rental programs plus expanding reimbursement pathways gradually mitigate upfront expense concerns.
Requirement for Specialized Expertise
Comprehensive structural-variant interpretation demands advanced genomic skills beyond traditional cytogenetics curricula. Cloud-based analytics, automated variant calling, and vendor training courses are steadily reducing the expertise gap. As AI-enabled reporting gains traction, optical genome mapping becomes feasible for laboratories of varied size and complexity, supporting sustained adoption.
*Our forecasts treat driver/restraint impacts as directional, not additive. The impact forecasts reflect baseline growth, mix effects, and variable interactions.
Optical Genome Mapping Market Segment Analysis
By Product Type:
Consumables Drive Recurring Revenue GrowthThe optical genome mapping market size for instruments corresponding to 63.05% of segment revenue in 2025. Consumables, mainly nanochannel array flowcells, recorded the highest momentum and are forecast to climb at a 25.10% CAGR, benefiting from each incremental test run. Flowcell shipments totaled 8,058 units in Q4 2024, indicating healthy utilization across 371 installed systems.
Capital equipment sales hinge on periodic technology cycles. Stratys, launched in January 2024, produces four times the data of earlier systems and processes up to 12 samples concurrently, spurring replacement demand among high-throughput clinical labs. Instrument revenue also accrues from software licenses and maintenance, reinforcing a hybrid model of upfront and recurring streams. The resonance of these dynamics underscores why consumables pace overall growth even as instruments anchor platform stickiness.


By Application:
Rare-Disease Diagnostics Emerge as Growth DriverOncology delivered 29.35% of optical genome mapping market share in 2025, reflecting entrenched use in hematological malignancies where diagnostic accuracy reaches 98.2% concordance with conventional approaches while unveiling extra clinically actionable variants in 58% of samples. Looking forward, rare-disease and constitutional genetics exhibit the steepest climb at a 27.20% CAGR, buoyed by optical genome mapping’s capacity to identify pathogenic structural variants that short-read sequencing misses.
The optical genome mapping market size for rare-disease diagnostics is projected to double between 2025 and 2030 as family-based studies, neurodevelopmental assessments, and undiagnosed-diseases programs incorporate the technology. Prenatal testing, microbial genomics, and agricultural genomics also expand the total addressable opportunity by extending structural-variant detection to broader research and clinical contexts.
By End User:
Research Institutions Accelerate AdoptionBiotechnology and pharmaceutical firms accounted for 48.70% of optical genome mapping market share in 2025, applying the platform to biomarker discovery, target validation, and companion-diagnostic development. Drug developers exploit ultra-long-read data to parse tumor heterogeneity, refine patient stratification, and monitor clonal evolution.
Research and academic institutions represent the fastest-growing cohort at 23.90% CAGR. Government grants, precision-medicine consortia, and philanthropic funding drive purchases as universities establish centralized genomic cores. Clinical laboratories add optical genome mapping to replace sequential cytogenetic arrays, while contract research organizations bundle the technology into multi-omics service portfolios, widening commercial exposure.
Geography Analysis
North America Optical Genome Mapping Market
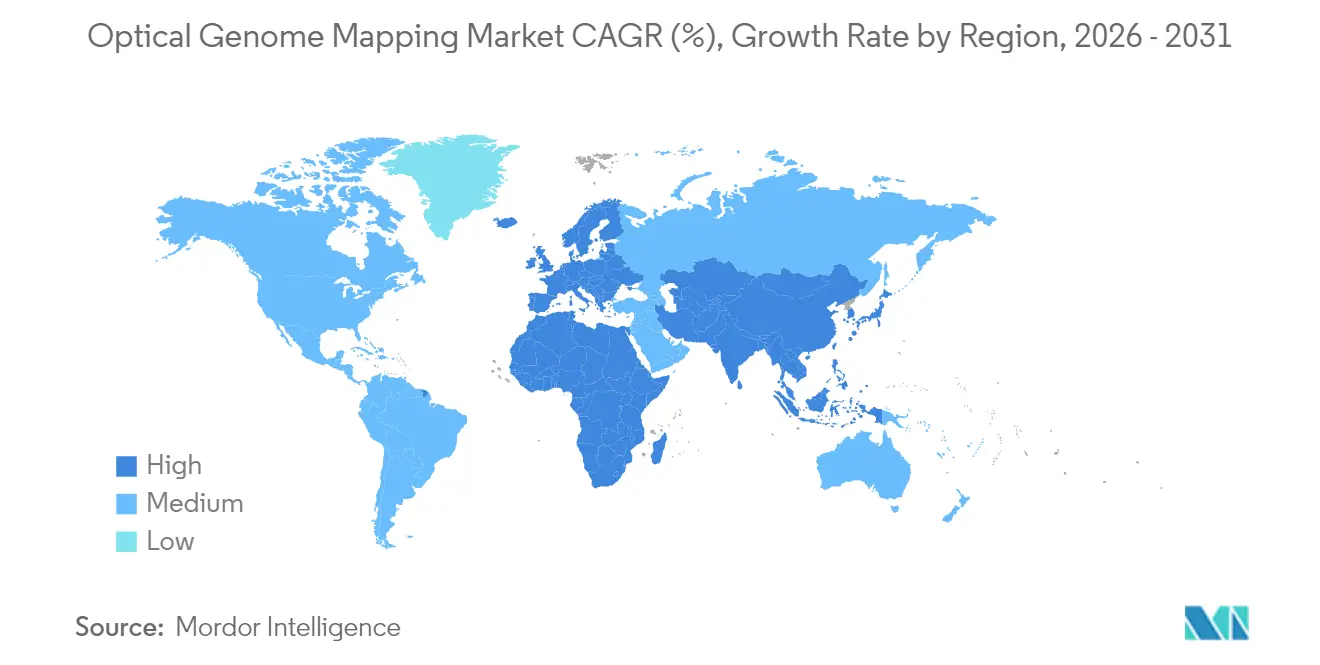
North America retained leadership in the optical genome mapping market with 41.95% revenue contribution in 2025. Category I CPT codes for hematological malignancy testing and the FDA’s heightened oversight of laboratory-developed tests provide regulatory certainty that favors validated platforms. Academic medical centers and genomic-research enterprises proliferate system placements, and Medicare’s ongoing coverage deliberations could unlock broader hospital adoption.
APAC Optical Genome Mapping Market
Asia Pacific is the fastest-growing region, projected at a 28.90% CAGR through 2031. China’s 15-year precision-medicine initiative is sequencing millions of genomes, fostering demand for structural-variant-centric technologies. Japan’s TOP-GEAR program aligns genomic analysis with national cancer-control strategies, and partial insurance coverage for gene-panel testing sets precedent for wider reimbursement. Regional biotechnology clusters collaborate with international vendors to localize manufacturing, training, and support, helping spur adoption beyond tier-one urban centers.
Europe, LATAM and Middle East Optical Genome Mapping Market
Europe exhibits steady uptake underpinned by public health-care systems, pan-European research consortia, and a mature laboratory network. Latin America and the Middle East are earlier in adoption curves yet show interest through pilot programs and academic partnerships as health-care modernization accelerates.

Regulatory Landscape
In the United States, optical genome mapping in clinical diagnostics is increasingly anchored to billing and device-framework signals. As of 2026, two Category I CPT codes are in effect for OGM use cases, including 81195 for hematologic malignancies and 81354 for constitutional genetic disorders, supporting standardized claims submission and payer evaluation. CMS updated payment under the 2026 Clinical Laboratory Fee Schedule with a 47% increase for CPT 81195 (effective January 1, 2026), reinforcing the shift from research use toward routine clinical testing economics.
On the device side, FDA regulations covering chromosomal copy number variation detection systems (21 CFR 866.5920, updated May 18, 2026) define intended-use boundaries and emphasize interpretation alongside other clinical findings rather than standalone diagnosis. Laboratory quality requirements are also tightening through external assessment infrastructure, with the College of American Pathologists (CAP) planning proficiency testing for OGM in hematologic malignancies in 2026, adding a practical mechanism for standardization as laboratories validate and scale OGM workflows.
Competitive Landscape
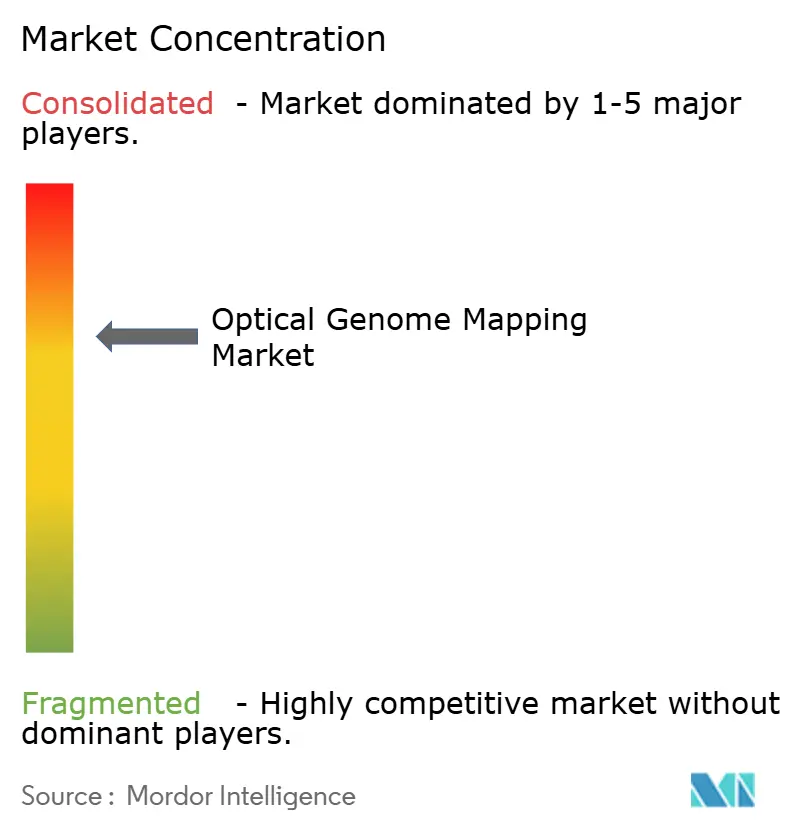
The optical genome mapping market is moderately consolidated. Bionano Genomics anchors the field with 371 deployed instruments worldwide as of Q4 2024, leveraging a focused R&D roadmap and extensive clinical-validation portfolio. Large genomics vendors such as Illumina, Thermo Fisher Scientific, and Oxford Nanopore Technologies pursue adjacency strategies: they integrate optical genome mapping–style readouts or partner on AI accelerators to expand workflow breadth.
Competitive differentiation revolves around resolution, throughput, automation, and software sophistication. Stratys underscores Bionano’s response to high-volume clinical labs, whereas Illumina’s multi-omics innovations promise complementary read technologies potentially bridging short reads and structural-variant mapping. Thermo Fisher’s acquisition of purification assets illustrates vertical integration aimed at end-to-end sample-to-answer solutions. Start-ups are emerging with cloud-native analytics, streamlined sample prep, and consumption-based pricing, making the optical genome mapping market more accessible to mid-sized laboratories.
Long-term success depends on clinical-utility evidence, seamless bioinformatics, and reimbursement alignment. Vendors that combine automated platforms, AI-guided interpretation, and collaborative research ecosystems are likely to shape market share trajectories through 2030.
Optical Genome Mapping Industry Leaders
Bionano Genomics
OpGen
Nabsys
PerkinElmer, Inc.
Nucleome Informatics
- *Disclaimer: Major Players sorted in no particular order
Optical Genome Mapping Market Companies Covered in this Report
- Bionano Genomics
- OpGen
- Nabsys
- Nucleome Informatics
- PerkinElmer
- Agilent Technologies
- Thermo Fisher Scientific
- Illumina
- Roche Sequencing Solutions
- QIAGEN
- Pacific Biosciences
- Revvity
- Genetron Holdings
- Berry Genomics
- Dante Genomics
- Bio-Rad Laboratories
- Oxford Nanopore Technologies
- Gene by Gene
- Stratec SE
- CN Life Sciences Instruments
- Novogene

Market Opportunities and Future Outlook
Clinical reimbursement and standardization are creating whitespace for broader clinical deployment beyond early-adopter centers, especially where OGM consolidates multi-test cytogenetic workups into a single workflow. In the United States, the availability of Category I CPT codes for hematologic malignancies (81195) and constitutional genetic disorders (81354), together with the CMS 47% payment increase for 81195 implemented January 2026, supports the business case for clinical diagnostic laboratories to move from pilot testing toward higher-throughput routine use.
Evidence generation is also expanding into adjacent clinical segments that can broaden addressable use cases within the report scope, including rare disease, reproductive health, and prenatal/constitutional genetics. Bionano reported a 56% increase in peer-reviewed publications describing OGM utility in rare diseases in Q1 2026 versus Q1 2025, and it also highlighted 12 OGM studies at the 2026 ACMG Annual Clinical Genetics Meeting (a two-fold increase over 2025), reinforcing ongoing clinical validation activity. Consortium and professional-body work on validation and quality frameworks, including discussion points for clinical implementation in hematologic malignancies and CAP proficiency testing initiatives, further supports opportunities for laboratories to standardize interpretation and QC, which helps address a key adoption friction point in clinical-scale rollouts.
Recent Industry Developments in Optical Genome Mapping Market
- June 2026: Bionano Genomics reported 67% year-over-year growth in studies featuring optical genome mapping at the European Society of Human Genetics (ESHG) 2026 meeting. The update points to expanding utilization across international research and clinical communities, supporting downstream lab validation activity.
- May 2026: Bionano Genomics announced publication of a Modern Pathology study described as the largest OGM study in T-cell acute lymphoblastic leukemia, reporting OGM detection of genomic abnormalities in 97.8% of cases versus 55% with conventional cytogenetic analysis. The results strengthen clinical-utility positioning in hematologic malignancy workflows where conventional testing can miss complex structural variation.
- August 2024: Hitachi High-Tech Corporation acquired a majority interest in Nabsys, making it a consolidated subsidiary and positioning the OhmX electronic genome mapping platform for broader commercialization support. The deal links a specialized genome mapping developer to a larger instrumentation organization with resources for scaling installations and applications development.


Optical Genome Mapping Market Report Scope and Research Methodology
Market Definition and Coverage
In this methodology, the optical genome mapping market covers revenue generated from instruments, proprietary consumables, workflow-linked software, and related services used to create genome-wide structural variant maps from ultra-high-molecular-weight DNA for research and clinical use.
Scope exclusions: We exclude routine short-read sequencing kits, generic bioinformatics tools that are not OGM-specific, and lab services that do not operate optical mapping instruments.
Segments Covered in This Report
- By Product Type
- Instruments
- Consumables
- By Application
- Oncology
- Rare-Disease & Constitutional Genetics
- Prenatal & Reproductive Health
- Microbial & Pathogen Genomics
- Agricultural & Plant Genomics
- By End User
- Biotechnology & Pharmaceutical Companies
- Research & Academic Institutions
- Clinical Diagnostic Laboratories
- Contract Research Organizations
- By Geography
- North America
- United States
- Canada
- Mexico
- Europe
- Germany
- United Kingdom
- France
- Italy
- Spain
- Rest of Europe
- Asia-Pacific
- China
- Japan
- India
- Australia
- South Korea
- Rest of Asia-Pacific
- Middle East & Africa
- GCC
- South Africa
- Rest of Middle East & Africa
- South America
- Brazil
- Argentina
- Rest of South America
- North America
Data Sources, Market Sizing, and Validation
Desk Research
Desk research was first used to set the boundary of what should be counted as optical genome mapping revenue and what should not be counted, so the model stays consistent across regions and end users. We reviewed public clinical and genomics references such as FDA databases for clearances where relevant, CDC materials on genetic conditions, NIH and PubMed publications that show adoption in structural variant use cases, and OECD or World Bank indicators that help explain country level research and healthcare capacity.
To put numbers into context, we also used sources such as company annual reports, investor presentations, and press releases to understand product mix, geographic emphasis, and pricing direction. In addition, paid subscriptions for company financials and intelligence, news and financials, and patent databases were used selectively to track fundraising, partnerships, and pipeline signals that can affect purchasing and utilization. These desk sources are not exhaustive, and many other public references were reviewed to collect data, validate assumptions, and clarify open questions.
Primary Interviews and Surveys
Primary discussions were used to check what share of demand is coming from research versus clinical diagnostic labs, and how purchasing decisions differ between established genomics centers and newer adopters. We spoke with a balanced mix of instrument and consumable stakeholders, lab directors, procurement focused managers, and domain experts across APAC, EMEA, and the Americas so assumptions around utilization, replacement cycles, and service attachments could be tested before finalizing the model.
Distribution of primary research fieldwork respondents
| Company type | Respondent position | Region |
|---|---|---|
| Top tier: 34% | CXOs: 17% | APAC: 44% |
| Mid tier: 48% | Functional/Unit leaders: 35% | EMEA: 29% |
| Smaller Players: 18% | Managers: 48% | Americas: 27% |
Market-Sizing & Forecasting
Sizing starts with a top-down build that reconstructs the demand pool using signals like installed base of OGM systems, expected annual throughput per system, and the consumables needed per run, which are then translated into revenue at typical factory gate pricing. We then corroborate the totals with selective bottom-up checks such as sampled ASP multiplied by unit shipments for instruments, plus channel checks on reagent pull-through to avoid overcounting.
A few inputs that matter a lot in this market are instrument placement rates, utilization intensity (runs per system per year), consumables pull-through per run, regional mix (because pricing and budgets differ), and the pace of clinical adoption in oncology and rare disease workflows. Where public shipment or placement details are incomplete, gaps are handled with conservative ranges validated through expert calls, and the midpoint is used only after it fits observed demand signals.
For forecasting, we use scenario analysis supported by simple multivariate relationships, where adoption and utilization move in line with research funding direction, clinical lab onboarding, and expected pricing changes for instruments and consumables. Once the path is built, the forecast is stress-tested with interview feedback on procurement cycles and with reasonableness checks versus adjacent cytogenetics and genomics spending trends.
Data Validation & Update Cycle
Validation is done by triangulating the modeled revenue against independent signals such as installed base growth, consumable usage patterns, and disclosed capacity expansion or geographic rollout activity, and then checking whether the implied utilization looks realistic. We also run variance checks across regions and end users so unusual spikes can be investigated and, if needed, assumptions are revisited through follow-up outreach.
Before sign-off, the model is reviewed in steps by analysts who did not build the first draft, which helps catch scope creep and unit conversion issues early. The report is refreshed annually, and interim updates are done when there are material events that can shift pricing, adoption, or supply. Prior to delivery, a final update pass is completed so the numbers reflect the latest available disclosures and market signals.
Mordor Intelligence's Optical Genome Mapping Market Sizing Compared With Other Published Estimates
Published market sizes for optical genome mapping can look far apart because the counting rules and timing choices are not always aligned. Differences usually come from what is included (only instruments versus instruments plus consumables and software), which end users are assumed to adopt first, and whether values are stated at factory gate pricing or at downstream selling prices.
A second reason is how updates are handled, since this space changes quickly with new placements, pricing bundles, and utilization learning curves. When average selling prices are rolled forward using fresh quotes and currency conversion timing is kept consistent with the measurement year, the estimate stays closer to what labs actually pay and use in practice, which is the refresh-led choice applied by Mordor Intelligence.
Benchmark comparison
| Source | Market Size | Gaps in Research Methodology |
|---|---|---|
| Mordor Intelligence | USD 203.4 M (2026) | |
| Trade Media Bulletin A | USD 162.27 M (2025) | Uses an earlier measurement year and tends to mix press-release pricing and broad growth claims, which can miss the step change in installed base and consumables pull-through that occurs after placements ramp. |
| Industry Newsletter B | USD 270.0 M (2025) | Often applies aggressive ASP and utilization progression without enough validation from lab adoption and procurement cycles, and it may bundle adjacent genomics tools that are not OGM-specific. |
Overall, the spread in published figures is explained by year alignment, pricing treatment, and whether the model is anchored to observable placement and consumable usage signals. By keeping scope boundaries clear and updating pricing and currency assumptions in a repeatable way, the market size becomes easier to trace and compare across regions and use cases.


Key Questions Answered in the Report
What is the current size of the optical genome mapping market?
The optical genome mapping market was valued at USD 203.4 million in 2026 and is forecast to reach USD 566.15 million by 2031, growing at a 22.72% CAGR during the forecast period (2026-2031).
Which product segment is expanding fastest?
Consumables are the fastest-growing product segment, advancing at a 25.10% CAGR as laboratories run more tests on the expanding installed base of instruments.
Why are rare-disease diagnostics important for optical genome mapping?
Optical genome mapping identifies pathogenic structural variants that short-read sequencing misses, delivering definitive diagnoses in 15% of previously unresolved rare-disease cases.
Which region shows the highest growth potential?
Asia Pacific leads in growth with a projected 28.90% CAGR through 2031, driven by China’s precision-medicine program and Japan’s TOP-GEAR cancer-genomics initiative.
How does optical genome mapping improve oncology testing?
The technology achieves 98.2% concordance with standard cytogenetic methods while revealing additional actionable variants in 58% of hematological malignancy samples, guiding more precise therapy selection.
What is the main barrier to wider adoption?
High upfront instrument costs remain the primary obstacle, although leasing models, reimbursement progress, and workflow-consolidation savings are steadily lowering this barrier.
Page last updated on:


 Your data is secure and never sold or shared.


