
Market Overview
| Study Period | 2020 - 2031 |
|---|---|
| Forecast Data Period | 2026 - 2031 |
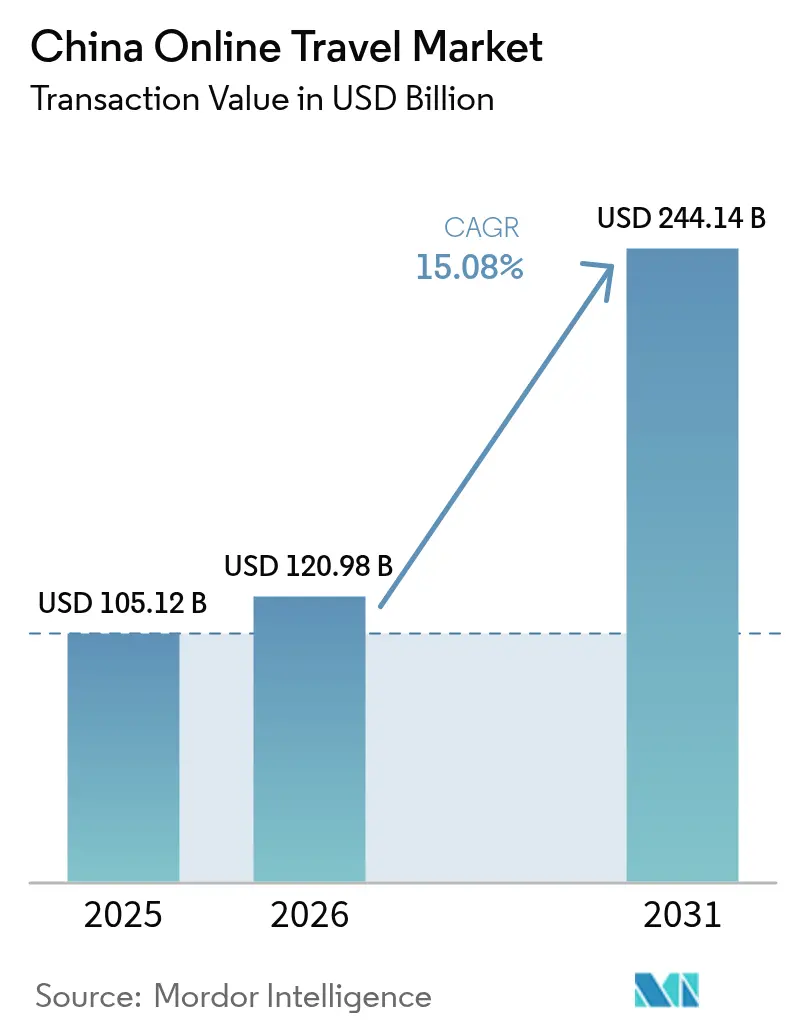
| Base Year Market Size (2025) | USD 105.12 Billion |
| Market Size (2026) | USD 120.98 Billion |
| Market Size (2031) | USD 244.14 Billion |
| Growth Rate (2026 - 2031) | 15.08 % |
| Market Concentration | High |
Major Players *Disclaimer: Major Players sorted in no particular order Image © Mordor Intelligence. Reuse requires attribution under CC BY 4.0. | |
China Online Travel Market Analysis by Mordor Intelligence
The China online travel market size was valued at USD 105.12 billion in 2025 and estimated to grow from USD 120.98 billion in 2026 to reach USD 244.14 billion by 2031, at a CAGR of 15.08% during the forecast period (2026-2031). Rising digital literacy, a nationwide pivot toward mobile commerce, and supportive tourism policies collectively keep the growth curve steep. Tier-3 to Tier-5 cities, where first-time travelers now transact almost entirely through super-apps, add a fresh layer of momentum. Established online travel agencies (OTAs) reinforce their positions through AI-powered personalization, dynamic pricing, and bundled lifestyle offerings that raise user stickiness. Relaxed visa regimes and expanded airlift unlock outbound demand, while domestic tourism benefits from high-speed rail connectivity and government-funded destination upgrades.
Key Report Takeaways
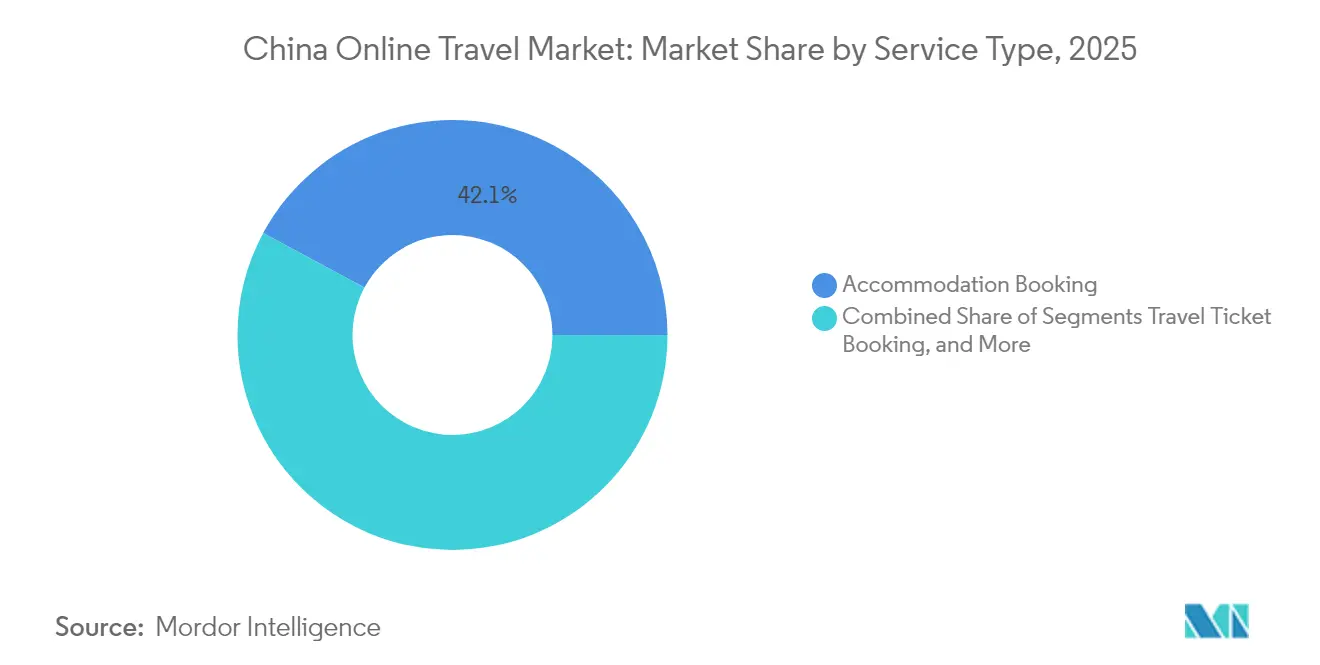
- By service type, accommodation booking led with 42.14% of the China online travel market share in 2025; holiday package booking is forecast to advance at a 16.61% CAGR through 2031.
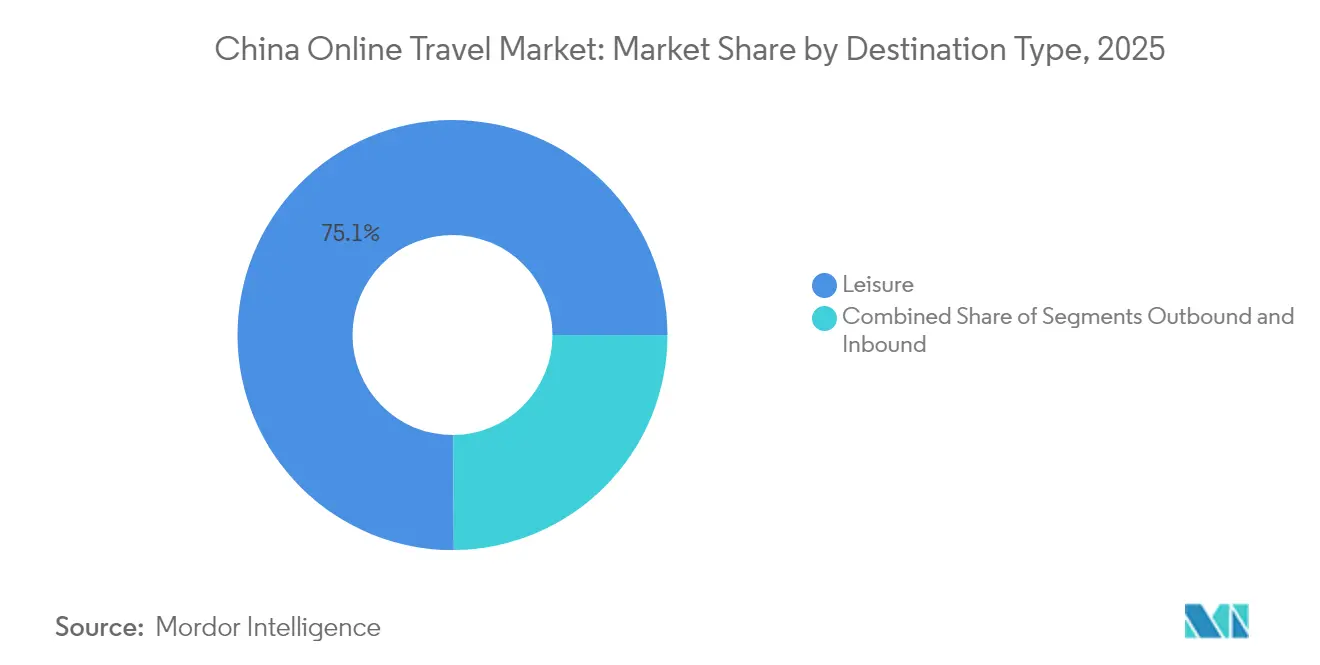
- By traveler type, leisure travelers held 75.10% of the China online travel market in 2025, whereas business travel is set to rise at a 12.41% CAGR.
- By mode of booking, OTAs and travel agents commanded a 68.10% share of the China online travel market in 2025, while supplier direct booking is on track for a 17.32% CAGR.
- By destination type, domestic travel represented 80.05% of the China online travel market size in 2025, and outbound travel is poised to accelerate at a 20.15% CAGR.
- By age group, millennials accounted for 45.52% of the China online travel market in 2025, and Gen Z is projected to expand at an 17.65% CAGR.
- By region, East China holds largest market share around 37.62% and Southwest China are expanding at 7.32% of CAGR to 2031.
- The top five players are Trip.com Group, Meituan-Dianping, Tongcheng-Elong, Qunar.com, and Fliggy which collectively holds significant market share in 2025.
Note: Market size and forecast figures in this report are generated using Mordor Intelligence’s proprietary estimation framework, updated with the latest available data and insights as of 2026.
China Online Travel Market Trends and Insights
Drivers Impact Analysis*
| Driver | (~)% Impact on CAGR Forecast | Geographic Relevance | Impact Timeline |
|---|---|---|---|
| High Internet and Smartphone Penetration | +3.2% | National, with stronger impact in Tier 3-5 cities | Short term (≤ 2 years) |
| Government Support for Domestic Tourism | +2.8% | National, with emphasis on cultural and historical destinations | Medium term (2-4 years) |
| Dominance of Super Apps and Travel Platforms | +2.5% | National, with higher adoption in Tier 1-2 cities | Medium term (2-4 years) |
| Growth in Middle-Class and Disposable Income | +2.1% | National, with concentration in eastern coastal regions | Long term (≥ 4 years) |
| Expansion of High-Speed Rail and Domestic Flights | +1.8% | National, connecting previously isolated regions | Medium term (2-4 years) |
| Strong Recovery of Group and Independent Travel | +1.5% | National, with emphasis on popular tourist destinations | Short term (≤ 2 years) |
| AI-Powered Personalization and Dynamic Pricing | +1.2% | National, with higher implementation in Tier 1-2 cities | Medium term (2-4 years) |
| Growth of Tier 2and Tier 3 City Travelers | +0.9% | Central and Western provinces | Long term (≥ 4 years) |
| Source: Mordor Intelligence | |||
High Internet and Smartphone Penetration
Smartphone subscriptions now exceed 1.7 billion, and 5G coverage is near-ubiquitous. This connectivity removes physical barriers to booking, especially in smaller cities where brick-and-mortar agencies were scarce. Ubiquitous mobile wallets such as Alipay and WeChat Pay compress checkout times to seconds, even for first-time travelers. Younger cohorts translate that convenience into spontaneous weekend trips, while platforms harvest clickstream data to refine real-time recommendations. The virtuous cycle of wider access, better personalization, and simplified payment keeps the China online travel market on a steep uptake curve.
Government Support for Domestic Tourism
Beijing’s three-year plan for cultural tourism established 19 May as China Tourism Day and bundles tax concessions with bank-subsidized travel coupons to spur local trips. Provincial governments replicate the model with heritage-themed festivals and transport subsidies that lift mid-week hotel occupancy. Policy clarity reduces operator risk, prompting sustained investment in cloud-based reservation systems and data analytics. By directly linking subsidies to digital transactions, authorities funnel incremental traffic toward online platforms, reinforcing the structural shift away from offline channels.
WeChat Mini Programs, Alipay Life Services, and Meituan unify messaging, payments, and reservations in a single user flow. Linking loyalty points to daily coffee purchases and flight seats increases cross-sell potential. Built-in social feeds let travelers crowd-source itineraries, embedding peer validation within the purchase path. For platforms, that ecosystem raises switching costs and shields margins from new entrants. Super-app architecture also underpins voice-activated search and QR-code ticketing, compressing the journey from inspiration to transaction into minutes.
Per-capita disposable income in urban areas reached USD 7,700 in 2025, and nearly 60% of households now fall into the upper-middle-income bracket. This demographic seeks quality upgrades, moving from budget hotels to design-led boutique properties and curated small-group tours. Spending elasticity allows OTAs to bundle insurance, lounge access, and in-destination activities, lifting average order values. The trend is particularly visible along the eastern seaboard, but inland cities such as Chengdu and Xi’an record double-digit increases in premium package bookings.
Restraints Impact Analysis*
| Restraint | (~) % Impact on CAGR Forecast | Geographic Relevance | Impact Timeline |
|---|---|---|---|
| Regulatory Crackdowns on Tech and Data | -1.9% | National, with emphasis on major tech hubs | Medium term (2-4 years) |
| Economic Uncertainty and Consumer Caution | -1.7% | National, with stronger impact in Tier 1 cities | Short term (≤ 2 years) |
| Competition from Offline and Direct Channels | -1.4% | National, with emphasis on traditional tourist areas | Medium term (2-4 years) |
| Rising Customer Acquisition Costs | -1.2% | National, with higher impact in saturated markets | Medium term (2-4 years) |
| Overdependence on Domestic Tourism | -1.0% | National, particularly affecting international gateway cities | Long term (≥ 4 years) |
| Disruptions from Public Health or Geopolitical Risks | -0.8% | Global, with varying regional impacts | Short term (≤ 2 years) |
| High Platform Commission Fees | -0.7% | National, affecting smaller service providers | Medium term (2-4 years) |
| Fragmentation of User Preferences | -0.5% | National, with stronger impact in younger demographics | Long term (≥ 4 years) |
| Source: Mordor Intelligence | |||
Regulatory Crackdowns on Tech and Data
The Cross-border Data Flow Provisions require security assessments for outbound data deemed sensitive, compelling OTAs to localize servers and deploy encryption. Compliance outlays erode smaller players’ margins and slow feature roll-outs. Yet clarified guidelines are also reducing gray zones, letting well-capitalized incumbents incorporate privacy-preserving AI models with government-approved safeguards. Long-run effects, therefore, skew toward consolidation rather than outright contraction.
Economic Uncertainty and Consumer Caution
Property-sector volatility and subdued wage growth temper discretionary spending, notably in Tier 1 cities where living costs bite hardest. Travelers pivot toward value-driven “all-in” bundles that cap per-trip expenses. OTAs respond with flexible payment plans and algorithmic discounts. While macro headwinds shave growth in premium categories, pent-up wanderlust in lower-tier markets cushions overall demand, leaving the China online travel market expansion intact though slightly moderated.
*Our forecasts treat driver/restraint impacts as directional, not additive. The impact forecasts reflect baseline growth, mix effects, and variable interactions.
Segment Analysis
By Service Type: Platforms Broaden Lodging and Package Portfolios
Accommodation booking steered 42.14% of the China online travel market in 2025, translating to deep commission pools that fund aggressive loyalty campaigns. AI-powered filters parse guest reviews and real-time rate parity to surface room types aligned with individual budgets and amenity priorities. That granular targeting keeps cancellation rates low, boosting hotel-OTA alignment. Holiday package booking, projected to grow at 16.61% CAGR, appeals to new travelers from Tier 3 cities who prefer turnkey itineraries that bundle transport, lodging, and insurance under one QR code.
The accommodation subsector now spills into alternative inventory: homestays, serviced apartments, and pop-up “glamping” pods in lesser-known scenic zones. Major OTAs integrate user-generated micro-videos to preview properties, converting inspiration to booking within the same scroll cycle. Meanwhile, add-on services are airport transfers, local SIM cards, and attraction e-tickets to create ancillary revenue streams that move platforms closer to one-stop lifestyle ecosystems.

By Traveler Type: Leisure Dominates, Business Travel Recovers
Leisure accounted for 75.10% of the China online travel market in 2025, buoyed by social-media storytelling and flash-sale channels that spark impromptu getaways. Short-distance “micro-vacations” drive weekday demand spikes, smoothing seasonality for operators. Business travel, growing at 12.41% CAGR, rebounds as corporations resume in-person deal-making. Digital travel-management dashboards cum expense platforms integrate policy compliance, decision support, and live rebooking, letting finance teams track carbon output and per-diem metrics.
Hybrid “bleisure” itineraries blur segment lines: executives tack a weekend onto a client visit, swelling average stay lengths and cab ride receipts. OTAs curate bundles that align corporate hotel caps with leisure upgrade options, such as spa credits or attraction passes financed through employee wellness budgets.
By Mode of Booking: OTAs Retain Lead as Direct Channels Scale
OTAs and travel agents held 68.10% of bookings in 2025, anchoring the China online travel market through expansive inventory breadth and tiered membership benefits. Machine-learning engines re-rank search results based on loyalty status and price sensitivity, boosting cross-sell from rail to hotels to car rentals. Supplier direct channels, expected to rise at 17.32% CAGR, harness brand apps and mini-programs to reclaim distribution margins.
Hotels lure users with mobile check-in, digital room keys, and breakfast credits unavailable on OTAs, while airlines deploy branded credit cards and tier-match promotions. The tug-of-war stimulates product innovation: OTAs add “best price guarantee” refunds issued instantly to wallet balances, and suppliers partner with fintechs for zero-interest installment plans, ensuring frictionless payment even on big-ticket itineraries.
By Destination Type: Domestic Still Rules, Outbound Takes Flight
Domestic trips represented 80.05% of the China online travel market size in 2025, propelled by high-speed rail lines that place 70% of the population within 3 hours of a coastal city. Provincial subsidies fund museum admissions and rural homestay renovations, further encouraging internal exploration. Outbound travel, forecast to surge at 20.15% CAGR, gains traction as 15-day visa-free entry to Thailand, Malaysia, and Singapore rolls out.
OTAs pre-package international SIM cards and airport lounge passes into one-click “Smart Departure” kits that simplify border crossings. On the inbound side, duty-free expansions in Hainan and Guangdong attract overseas visitors who leverage Chinese e-wallets, creating two-way traffic that strengthens airline route economics.
By Age Group: Gen Z Pushes Digital-First, Millennial Wallets Still Heaviest
Millennials own 45.52% of the China online travel market, combining mid-career incomes with digital familiarity. They respond to sustainability badges and flexible cancellation more than rock-bottom prices. Gen Z, projected to compound at 17.65% CAGR, treats travel as a live-stream moment: 60-second destination reels translate directly into booking clicks. Platforms integrate augmented-reality previews, letting users visualize street-food tours or ski runs before paying, aligning tightly with Gen Z’s immersive expectations.
Gen X prefers family-centric packages with stroller rentals and theme-park fast passes, while boomers show willingness to spend when health-focused perks such as 24-hour tele-consult lines are included. This demographic layering compels OTAs to maintain multi-modal engagement—from customer-service chatbots for Gen Z to phone-hotline concierges for seniors, avoiding one-size-fits-all approaches.
Geography Analysis
The China online travel market geography displays a multi-centered pattern rather than the traditional coastal skew. Tier 1 cities remain revenue leaders but face near-full penetration, prompting OTAs to shift marketing budgets inland. Chengdu, Chongqing, and Wuhan post the fastest booking growth thanks to expanded airport hubs and localized advertising on short-video platforms. Digital wallets backed by local banks lower payment friction, helping first-time users who distrust credit cards.
East China commands the largest regional market share at 37.62% in 2025, establishing itself as the dominant geographic segment in China's tourism and hotel market. This region encompasses major economic powerhouses, including Shanghai, Jiangsu, Zhejiang, Anhui, Fujian, Jiangxi, and Shandong provinces, which collectively represent China's most developed and internationally connected areas.
Southwest China, while representing a smaller current market share, is experiencing rapid expansion at 7.32% CAGR, making it the fastest-growing regional segment. This region includes Sichuan, Yunnan, Guizhou, Chongqing, and Tibet, areas that have benefited from significant government investment in infrastructure development and tourism promotion. The region's growth is driven by its unique combination of natural attractions, ethnic cultural diversity, and emerging urban centers that are attracting increasing numbers of domestic tourists seeking authentic experiences beyond traditional coastal destinations.
Regulatory Landscape
China online travel is governed by an increasingly formalized tourism-market supervision framework led by the Ministry of Culture and Tourism (MCT), with standardization and consumer-protection measures tightening around how OTAs and agencies sell, price, and document trips. In May 2025, MCT approved a set of tourism industry standards effective August 19, 2025, including the Service Specifications for Online Travel Platform Accommodation Booking (LB/T 094-2025) and Big Data Evaluation Indicators for Tourism Service Quality (LB/T 095-2025). These standards reinforce clearer service requirements and quality measurement for digital travel transactions.
In 2026, policy action shifted further toward contract standardization, complaint handling, and graded supervision. MCT and the State Administration for Market Regulation (SAMR) jointly released the 2026 Model Group Travel Contract (Standard Text), effective nationwide from March 31, 2026. The standard text covers domestic, outbound, and study-tour group contracts, raising expectations for itinerary changes, pricing disclosures, and dispute resolution. MCT also issued updated Tourism Complaint Handling Measures effective March 15, 2026, replacing the 2010 version, and requiring unified information systems and data sharing. Separately, a travel agency credit evaluation pilot launched in May 2026 across 12 regions, including Beijing, Zhejiang, and Guangdong, running through December 31, 2026, and linking supervision intensity more directly to compliance history.
Competitive Landscape
The China online travel market concentrates power in a handful of ecosystems. Trip.com Group fuses flights, hotels, rail, and corporate travel onto one backend, cross-selling insurance underwritten by Ping An. Meituan turns dining coupons into travel triggers, sending restaurant customers hotel flash deals within the same app session. Tongcheng-Elong leverages Tencent traffic, while Qunar optimizes metasearch across affiliate partners. Fliggy, backed by Alibaba, embeds travel into Taobao’s live-commerce sessions, letting key opinion leaders showcase hotel rooms via shoppable livestreams.
Strategic skirmishes intensify around content commerce. Xiaohongshu and Douyin convert influencer trip diaries into one-click reservations, forcing incumbents to nurture creator communities via revenue-share programs. AI is the common weapon: recommendation engines analyze not only past bookings but also ride-hailing logs and food-delivery orders to infer taste profiles. White-space innovation surfaces in luxury rail journeys and wellness retreats, segments where middle-aged professionals seek privacy and exclusive add-ons.
China Online Travel Industry Leaders
-
Trip.com Group Ltd
-
Meituan-Dianping
-
Tongcheng-Elong Holdings Ltd
-
Qunar.com
-
Fliggy (Alibaba)
- *Disclaimer: Major Players sorted in no particular order

Market Opportunities and Future Outlook
Policy-driven digitalization and inbound priorities create whitespace for platforms and suppliers to productize standardized, transparent travel and to connect with local smart-tourism infrastructure. The State Council approved and released the Tourism Powerhouse Construction 15th Five-Year Plan (2026-2030) in July 2026, explicitly prioritizing digital transformation, inclusive tourism, and inbound travel. It adds momentum to investments in interoperable booking, multilingual servicing, and compliant data practices across OTAs, super-app channels, and suppliers. The same direction is reflected in the State Council’s 2025 supervision emphasis on regulating online travel operators and prohibiting big data price discrimination, which supports demand for auditable pricing, clearer merchandising logic, and electronic-contract retention across accommodation, transport, and package products.
Smart-tourism deployments also point to near-term opportunity in AI-assisted trip planning and in bringing destination inventory into online channels, particularly beyond tier-1 hubs where first-time travelers depend on mobile flows. In April 2026, Dalian’s culture and tourism authority cited an AI-powered mini-program that reached nearly 430,000 users for personalized itinerary planning, highlighting room for OTA, super-app, and destination collaborations that turn inspiration into transactable itineraries. With domestic travel remaining the larger booking base (80.05% share in 2025) and outbound travel growing from a smaller starting point, platforms can expand higher-value bundles, such as transport plus lodging plus activities, and roll out compliance-ready group products aligned with the 2026 model contract. Suppliers and regional bureaus can also use standardized data and content requirements to improve distribution, reduce disputes, and lift conversion in lower-tier city demand pockets.
Recent Industry Developments
- July 2026: Trip.com Group announced a global partnership with Seat Unique Group to add official premium live-event experiences, including hospitality and VIP packages, onto its platforms. The announcement expands Trip.com’s sellable inventory beyond flights and hotels into higher-margin experiences that can be bundled into city breaks and outbound itineraries.
- May 2026: Tongcheng Travel released its unaudited consolidated results for the three months ended March 31, 2026, including reported revenue from its tourism business line. The update points to continued scaling in its travel segment and supports further investment in acquisition and service features aimed at travelers from lower-tier cities.
- May 2025: Trip.com announced a strategic alliance with ITB China to pilot generative-AI itinerary builders across its domestic platforms, with a stated goal of reducing trip-planning time. By embedding AI planning into the booking funnel, the partnership targets higher stickiness and stronger cross-sell for packages, insurance, and in-destination add-ons.
Research Methodology Framework and Report Scope
Market Definition and Coverage
This market covers the value of travel bookings made through internet-based channels in China, including apps and websites used to reserve transport, lodging, and trip-related services. We treat the market as the transaction value tied to completed bookings, not website traffic.
Scope exclusions: We exclude bookings made fully offline, such as walk-in agency sales and counter purchases at hotels or transport terminals.
Segmentation Overview
- By Tourism Type
- Domestic Tourism
- Inbound Tourism
- Outbound Tourism
- By Purpose
- Leisure & Adventure & Eco-Tourism
- Business / MICE
- By Traveler Age
- Generation Z (18-24)
- Millennials (25-40)
- Generation X (41-56)
- Baby Boomers (57+)
- By Booking Channel
- Online Travel Agencies (OTAs)
- Direct Hotel Websites & Apps
- Offline Travel Agencies
- By Hotel Category
- Economy / Budget Hotels
- Mid-scale Hotels
- Upscale Hotels
- Luxury Hotels
- Serviced Apartments & Long-Stay
- By Ownership / Branding
- Independent Hotels
- Domestic Chain-Affiliated Hotels
- International Chain-Affiliated Hotels
- By Region
- Central China
- East China
- North China
- Northeast China
- Northwest China
- South China
- Southwest China
Data Sources, Market Sizing, and Validation
Desk Research
Desk work starts with building the demand backdrop for travel in China, so the model does not grow faster than the activity it depends on. We review public releases such as Ministry of Culture and Tourism statistics, Civil Aviation Administration of China traffic series, National Bureau of Statistics household and service indicators, and China Tourism Academy publications, then we supplement with airport and railway operator disclosures where available.
Next, we use company filings and investor decks from listed platforms and travel suppliers to understand booking mix, commission patterns, and how reported revenue maps to booking value. For hard-to-find checks, we also use paid subscriptions for company financials and intelligence, news and financials feeds, and patent databases to track product shifts like app-based booking and digital fulfillment. The sources listed here are illustrative, and we also used other public documents to collect, verify, and clarify specific data points.
Primary Interviews and Surveys
Primary work is used to stress-test assumptions that are not readable directly from public data, especially booking conversion behavior, supplier commission ranges, and the category mix across air, lodging, and packaged trips. We speak with OTAs, travel suppliers, channel partners, and travel managers so the sizing logic reflects how bookings are actually placed and fulfilled within China.
Distribution of primary research fieldwork respondents
| Company type | Respondent position |
|---|---|
| Top tier: 32% | CXOs: 20% |
| Mid tier: 47% | Functional/Unit leaders: 21% |
| Smaller Players: 21% | Managers: 59% |
Market-Sizing & Forecasting
Our core model uses a top-down demand pool reconstructed from travel activity and the share of bookings shifting to online channels, and then translated into transaction value. The starting point is travel volumes and spend signals visible in official series, and once these are set, the online portion is derived using adoption and booking-behavior inputs from interviews.
To keep totals realistic, we corroborate the results with selective bottom-up approximations such as sampled booking value by trip type, platform take-rate logic, and a reasonableness roll-up from major supplier categories where disclosures exist. Inputs that often move the outcome include domestic and international passenger trips, air capacity and the load-factor direction, hotel room nights and occupancy movement, the mix of air versus lodging versus packages, and average booking value changes during peak periods and major promotions. Where a direct data point is missing, we handle it with bounded ranges anchored on interview consensus, then narrow the range using consistency checks against public travel indicators.
For forecasting, we run scenario analysis supported by simple multivariate relationships between travel activity (trips and capacity), online penetration, and average booking value progression. The final forecast path is adjusted when expert feedback indicates step changes, such as policy shifts affecting travel, changes in supplier pricing posture, or faster app adoption.
Data Validation & Update Cycle
Validation is done in layers so that one optimistic input does not drive the whole outcome. Model outputs are checked against independent signals like passenger traffic trends, lodging utilization direction, and reported performance markers from public companies, and then any outliers are rechecked before internal sign-off.
If a large variance appears, analysts revisit definitions, rerun currency and timing conversions, and in some cases re-contact sources to confirm whether the shift is structural or temporary. Reports are refreshed annually, and interim updates are made when material events occur, followed by a final pre-delivery pass so clients receive the latest updated view.
Mordor Intelligence's China Online Travel Market Size Measured Against Other Published Estimates
It is normal to see different published market sizes for online travel in China, even when the titles look similar. The main reasons are different base years, the choice to report booking value versus revenue, and whether the scope counts only OTA transactions or also includes direct supplier online bookings.
Here, the spread mostly comes from how online travel is defined at the transaction level and how domestic, inbound, and outbound booking flows are treated when they are placed on China-based online channels. Some estimates also mix in reservations that are paid offline after an online order, or they use conservative growth cases without checking them against travel volumes and booking-value movement.
Benchmark comparison
| Source | Market Size | Gaps in Research Methodology |
|---|---|---|
| Mordor Intelligence | USD 105.12 B (2025) | |
| Industry Portal A | USD 43.84 B (2024) | Uses an earlier base year and a narrower booking scope that appears closer to online booking services, which can leave out parts of packaged trips and ancillary add-ons that are counted in broader online travel transaction value. |
| Industry Institute B | USD 154.95 B (2023) | Reported as transaction scale in local currency and may include bookings where payment happens offline after an online reservation, which can raise totals once converted to USD and compared across different timing assumptions. |
Across the three figures, the biggest swing comes from what counts as an online travel transaction and how offline-paid reservations are treated, followed by base-year choice and currency timing. When the sizing is tied back to passenger trip signals, hotel utilization direction, and category mix checks, the market total stays closer to real demand. The inclusion and validation rules are applied in the same way as in Mordor Intelligence.
Key Questions Answered in the Report
What is the current size of the China online travel market in 2026?
The market stands at USD 120.98 billion in 2026 and is on a 15.08% CAGR growth path toward USD 244.14 billion by 2031.
Which segment holds the largest China online travel market share?
Accommodation booking leads with 42.14% share, reflecting the essential nature of lodging in any itinerary.
How fast is outbound travel from China expected to grow?
Outbound bookings are projected to accelerate at a 20.15% CAGR between 2026 and 2031, driven by visa-free policies and expanding airlift.
Who are the major players in the China online travel industry?
Trip.com Group, Meituan-Dianping, Tongcheng-Elong, Qunar.com, and Fliggy collectively control 89% of revenue, making the landscape highly concentrated.
What role do super-apps play in China’s travel ecosystem?
Super-apps such as WeChat and Alipay integrate payment, social sharing, and booking functions, raising user convenience and platform stickiness while heightening barriers for standalone newcomers.