
Online Strategy Games Market Size and Share
Market Overview
| Study Period | 2020 - 2031 |
|---|---|
| Market Size (2026) | USD 23.45 Billion |
| Market Size (2031) | USD 36.74 Billion |
| Growth Rate (2026 - 2031) | 9.39 % |
| Fastest Growing Market | Asia-Pacific |
| Largest Market | North America |
| Market Concentration | Medium |
Major Players *Disclaimer: Major Players sorted in no particular order Image © Mordor Intelligence. Reuse requires attribution under CC BY 4.0. | |
Online Strategy Games Market Analysis by Mordor Intelligence
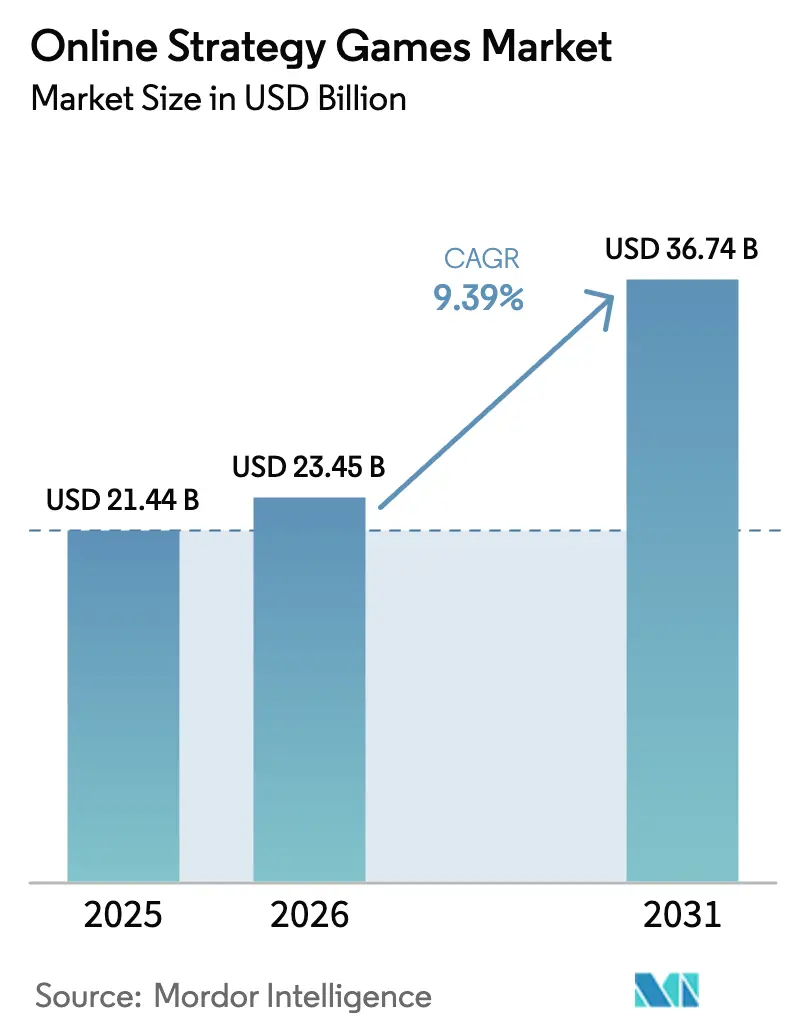
The online strategy games market size was valued at USD 21.44 billion in 2025 and estimated to grow from USD 23.45 billion in 2026 to reach USD 36.74 billion by 2031, at a CAGR of 9.39% during the forecast period (2026-2031). This growth reflects the shift from PC-centric releases toward cloud-native, AI-enhanced titles that exploit 5G connectivity, edge computing, and cross-platform engines. Strategic consolidation, exemplified by Microsoft’s USD 69 billion purchase of Activision Blizzard, has reshaped competitive dynamics even as entertainment conglomerates such as Disney inject new capital into game platforms. Cloud distribution lowers upfront infrastructure costs for developers, while 5G rollouts support low-latency real-time strategy play that expands mobile engagement.[1] Generative-AI tools reduce content-update costs, supporting faster iteration cycles and personalized experiences that boost retention. These forces collectively position the online strategy games market for sustained, technology-led expansion despite margin pressure from rising user-acquisition costs and platform fees.
Key Report Takeaways
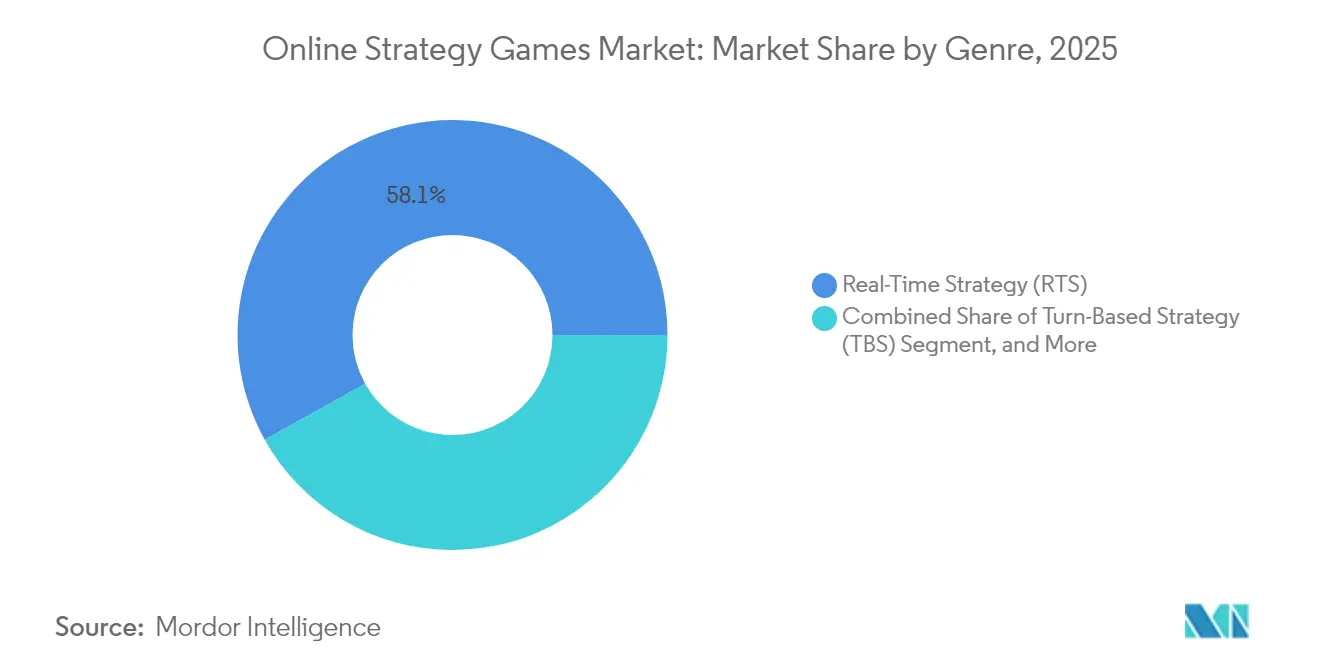
- By genre, real-time strategy led with a 58.10% revenue share in 2025 in the online strategy games market, whereas auto-battler is forecast to compound at 10.36% CAGR through 2031.
- By platform, mobile accounted for 47.10% of the 2025 total in the online strategy games market, while cloud gaming is set to grow fastest at 10.21% CAGR as infrastructure matures.
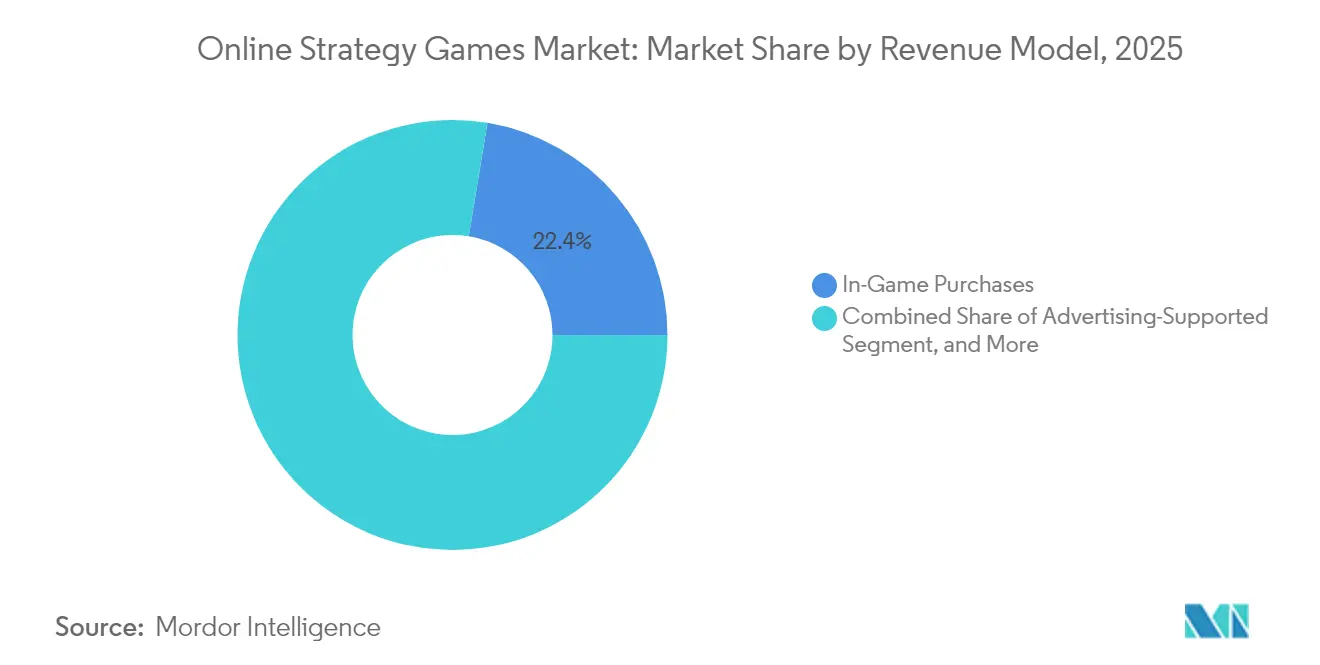
- By revenue model, in-game purchases captured 22.40% in 2025 in the online strategy games market; subscriptions are expected to advance at a 9.82% CAGR to 2031.
- By player mode, MMO/4X titles held 40.20% in 2025 in the online strategy games market, whereas esports-focused releases are projected to escalate at 10.11% CAGR through 2031.
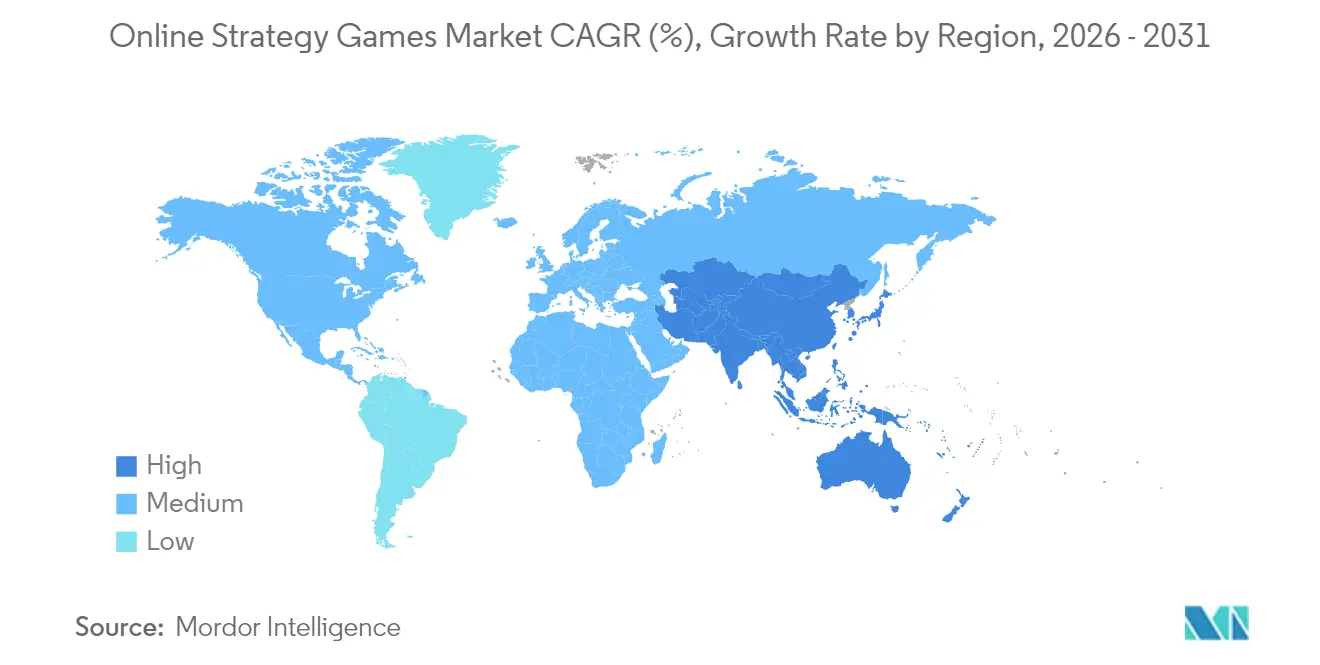
- By geography, North America retained 39.30% of 2025 sales in the online strategy games market, but Asia-Pacific is poised for a 9.95% CAGR, outpacing all other regions.
Note: Market size and forecast figures in this report are generated using Mordor Intelligence’s proprietary estimation framework, updated with the latest available data and insights as of 2026.
Market Trends and Insights
Drivers Impact Analysis of Online Strategy Games Market*
| Driver | (~) % Impact on CAGR Forecast | Geographic Relevance | Impact Timeline |
|---|---|---|---|
| Cloud-native distribution lowering entry barriers | +1.8% | Global, with stronger impact in North America and Europe | Medium term (2-4 years) |
| 5G rollouts enabling low-latency mobile RTS | +2.1% | APAC core, spill-over to North America and Europe | Long term (≥ 4 years) |
| Esports monetization expanding real-time strategy viewership | +1.4% | Global, concentrated in North America, Europe, APAC | Medium term (2-4 years) |
| Generative-AI tools cutting content-update costs | +1.9% | Global, early adoption in North America and Europe | Short term (≤ 2 years) |
| Cross-play engines broadening addressable base | +1.3% | Global, with emphasis on mobile-PC integration | Medium term (2-4 years) |
| Rising VC funding for mid-core mobile strategy titles | +1.1% | North America and Europe primarily, expanding to APAC | Short term (≤ 2 years) |
| Source: Mordor Intelligence | |||
Cloud-Native Distribution Lowering Entry Barriers
Cloud delivery removes hardware and retail constraints, enabling a flood of new titles and allowing smaller studios to reach global audiences without a physical footprint.[2] Over 15,000 browser-based strategy games launched in H1 2025, a 4.9-fold increase versus H1 2023, demonstrating how low entry costs energize creative competition. Unity’s 55% share of browser development underscores middleware’s role in accelerating launch cycles. Platform providers such as Amazon GameLift Streams extend scalable back-end services, letting developers prioritize gameplay innovation over server maintenance. Regulatory fragmentation, however, means compliance requirements vary widely, demanding legal vigilance across jurisdictions.
5G Rollouts Enabling Low-Latency Mobile RTS
Commercial 5G deployments have cut end-to-end lag to 70–100 ms, while 5G-A test networks show 5–10 ms radio latency and 100 Mbps downlink potential. These parameters allow console-grade real-time strategy experiences on smartphones and tablets, especially in Asia-Pacific where mobile-first adoption dominates. Edge facilities shorten data paths, preserving frame-sync integrity for competitive play. The performance leap expands addressable demographics among users lacking high-end PCs, although operators must still manage variable indoor coverage and data tariffs that influence session length.
Esports Monetization Expanding Real-Time Strategy Viewership
Esports revenue streams now span ticketing, sponsorships, in-client item sales, and media rights, shifting reliance away from publisher-run leagues. Brands such as Mercedes-Benz and Mastercard sponsor tournaments, widening exposure for strategy titles. Fnatic’s EUR 5.91 million 2023 digital-item takings, up 121% year-on-year, showcase scalable, high-margin income channels. Tournament APIs enable developers to automate bracket management, while Web3 assets promise future pathways for fan engagement subject to regulatory clarity.
Generative-AI Tools Cutting Content-Update Costs
Microsoft’s Muse model illustrates AI’s capacity to generate contextual map layouts and mission scripts on demand. Industry surveys indicate 49% of studios adopt generative AI, citing shorter art-pipeline loops and personalized narratives that sustain daily active users. Edge inference solutions from providers like Gcore achieve sub-50 ms response, enabling real-time AI adaptation during competitive matches. Intellectual-property protection remains critical; studios therefore implement process controls to avoid dataset contamination and mitigate legal exposure under emerging global AI policy regimes.
Restraints Impact Analysis of Online Strategy Games Market*
| Restraint | (~) % Impact on CAGR Forecast | Geographic Relevance | Impact Timeline |
|---|---|---|---|
| Rising user-acquisition (UA) CPMs post-IDFA privacy changes | -1.6% | Global, concentrated impact in North America and Europe | Short term (≤ 2 years) |
| App-store policy fees squeezing developer margins | -1.2% | Global, particularly affecting mobile-first developers | Medium term (2-4 years) |
| Cloud-gaming bandwidth throttling in emerging markets | -0.8% | Emerging markets in South America, MEA, and rural APAC regions | Long term (≥ 4 years) |
| Deep-fake and botting risks eroding competitive integrity | -0.7% | Global, with heightened impact in esports-focused markets | Medium term (2-4 years) |
| Source: Mordor Intelligence | |||
Rising User-Acquisition CPMs Post-IDFA Privacy Changes
Apple’s identifier-for-advertisers deprecation raised CPMs and diluted targeting precision, complicating recoupment of long-tail lifetime values prevalent in strategy genres. Studios respond by reinforcing first-party data collection, via opt-in gameplay telemetry, and by adopting contextual ad placements anchored to genre affinity. Scale remains vital; without large user cohorts the statistical power of these alternative approaches diminishes, keeping acquisition costs elevated in the near term.
App-Store Policy Fees Squeezing Developer Margins
Standard 30% commissions on in-app payments erode profitability, particularly for free-to-play titles reliant on high-frequency micro-transactions. Legislative scrutiny under the EU Digital Markets Act has initiated fee-reduction debates, yet practical relief could lag until 2026 or later. To mitigate exposure, publishers test progressive-web-app distribution and cloud gaming gateways, but user-onboarding friction outside centralized stores still restricts near-term reach.
*Our forecasts treat driver/restraint impacts as directional, not additive. The impact forecasts reflect baseline growth, mix effects, and variable interactions.
Online Strategy Games Market Segment Analysis
By Genre:
RTS Leadership Confronts Auto-Battler MomentumReal-time strategy titles represented 58.10% of 2025 revenue, an outperformance anchored by evergreen franchises and spectator-friendly esports ecosystems. Auto-battler innovation, however, is pulling new demographics through accessible mechanics and shorter match loops, giving the sub-category a forecast 10.36% CAGR. Players migrate fluidly across genres, prompting developers to blend real-time decision loops with auto-resolved combat modules that conserve session time without sacrificing depth. Successful hybrids can tap both hardcore and casual cohorts, broadening lifetime value and diversifying competitive metas. The online strategy games market therefore witnesses experimental genre convergence as studios apply AI-driven procedural systems to prototype new archetypes rapidly, reinforcing pipeline agility while mitigating budget risk.
Second-order effects include a rising e-commerce aftermarket for cosmetic assets that transcend individual genres, reinforcing monetization through interoperable skins and avatars. RTS publishers, meanwhile, leverage cross-progression between PC and cloud platforms to anchor their installed bases. Auto-battler startups exploit lightweight mobile builds to reach emerging economies, using low-bandwidth footprints and regional language packs to accelerate adoption. Provided regulatory guardrails on loot boxes remain stable, both segments expect incremental spend-per-paying-user to hold above mid-single-digit USD levels through 2030.

By Platform:
Mobile Scale Faces Cloud Gaming AccelerationMobile captured 47.10% in 2025 on the back of high smartphone penetration and intuitive touch controls, confirming the device’s position as the primary on-ramp to the online strategy games market. Yet cloud gaming’s 10.21% projected CAGR indicates shifting infrastructure economics: low-powered devices gain access to high-fidelity titles without discrete GPUs. Operators combine adaptive bitrate streaming with instant-resume state management to remove patch downloads, shrinking churn associated with friction at first launch. Developers build control-scheme abstraction layers to support controller, keyboard-mouse, and gesture input concurrently, reinforcing cross-play viability.
Browser games, fueled by WebAssembly and WebGPU, collected more than 15,000 launches in H1 2025; they illustrate how zero-install access counters app-store fees while aiding global reach. PC and console remain staples for competitive ladders that mandate precision inputs, with multi-monitor data overlays giving high-skill players marginal advantages. The platform mix is therefore fluid: consumer loyalty fragments across devices, challenging publishers to optimize social graphs, leaderboards, and virtual-economy sync in near real-time.
By Revenue Model:
Subscriptions Rise Amid In-Game Purchase DominanceIn-game purchases held 22.40% in 2025, cementing their status as the economic backbone for free-to-play design. Subscriptions, expected to rise at 9.82% CAGR, appeal to cost-conscious players who value predictable spending and bundled content libraries. Xbox Game Pass’s target of USD 5.5 billion 2025 revenue exemplifies how tiered membership tiers can fund AAA development while spreading risk across multiple releases. Hybrid monetization prevails; operators weave battle-passes and item shops into subscription frameworks, capturing both whales and mid-tail spenders.
Advertising support intensifies within mid-core mobile strategy games through rewarded videos and playable ads that preserve immersion. Premium pay-once models persist mainly among niche 4X and grand-strategy audiences who emphasize mod support and offline play. Regulatory inquiry into randomized loot tables continues to encourage transparent, direct-sale mechanics, pushing studios to disclose rarity odds and cap spending to retain compliance.
By Player Mode:
MMO Stability Meets Esports UpswingMMO/4X modes maintained a 40.20% slice in 2025, leveraging persistent worlds that foster long-run retention via guild structures and territorial competition. Esports-oriented formats look to a 10.11% CAGR, buoyed by infrastructure improvements such as automated anti-cheat and global spectator servers. Developers are embedding tournament APIs at launch, enabling community organizers to host seasonal circuits without publisher intervention.
Cross-play is widening player pools, lowering queue times, and boosting matchmaking accuracy, yet it requires identical balance patches across all clients, raising coordination overhead. Meanwhile, single-player campaigns exploit AI companions to deliver dynamic narrative arcs, enhancing perceived value for time-scarce users. Asynchronous multiplayer remains attractive in bandwidth-limited markets, offering strategic depth without concurrency requirements.
Geography Analysis
North America Online Strategy Games Market
North America’s leadership in the online strategy games market stems from sophisticated payment rails that support diverse monetization, from premium purchases to recurring passes, while esports arenas in Los Angeles and Dallas act as broadcast hubs for global tournaments. Cloud-infrastructure ownership by U.S. hyperscalers grants developers direct access to scalable GPU clusters, accelerating iterative live-ops cycles. Regulatory focus on antitrust within digital storefronts signals possible commission relief but introduces legal uncertainty that may delay investment decisions.
APAC Online Strategy Games Market
Asia-Pacific’s acceleration reflects a convergence of factors: China’s regulatory stabilization after prior licensing freezes, the popularity of mobile-first strategy titles, and state-backed esports infrastructure expansion. Domestic studios refine cultural localization, enabling titles to resonate in Southeast Asia while preserving monetization hooks optimized for WeChat Pay and Alipay. Japanese publishers leverage strong character IP and cross-media partnerships to differentiate amidst rising domestic competition, whereas South Korean firms pioneer 5G-native cloud releases with integrated broadcast overlays.
EMEA and South America Online Strategy Games Market
European developers navigate GDPR restrictions by deploying on-device analytics and explicit consent flows. Established PC modding communities in Germany and Poland cultivate long-tail engagement for grand-strategy titles. Middle Eastern sovereign-wealth funds invest in esports venues, eyeing tourism spill-overs, while African telecom operators bundle low-cost data passes for mobile games. South America’s dominant markets such as Brazil observe growing export potential for locally themed strategy content, although high import tariffs on gaming hardware constrain console adoption.
Regulatory Landscape
Regulation affecting online strategy games continues to focus on player safety, data governance, and monetization disclosures, with jurisdictions increasingly separating entertainment and esports titles from gambling-like real-money gaming. In the United States, H.R. 6265 (Safer GAMING Act) was introduced in November 2025 to require stronger parental control safeguards for minors in interactive online video games, and non-compliance is framed as an unfair or deceptive act under FTC jurisdiction. This direction raises compliance expectations for account controls and age-appropriate design.
In April 2026, India notified the Promotion and Regulation of Online Gaming Rules, 2026 (effective May 1, 2026), creating the Online Gaming Authority of India and formalizing registration and oversight that can affect how publishers handle esports and social games alongside other online gaming categories. In Brazil, Lei 14.852 (May 2024) established a legal framework for electronic games covering manufacturing, importation, development, and commercial use, reinforcing the need for publishers and distributors to manage country-specific compliance across product classification and commercialization.
Value Chain Analysis
The value chain for online strategy games begins with IP creation and design (studios, engines, art and audio vendors), then progresses to build and test, including live-ops tooling and anti-cheat. From there, games move into distribution and monetization through mobile app stores, PC storefronts, browsers, and cloud gaming gateways. Cloud back ends, including matchmaking, telemetry, persistence, and payments, along with community layers such as guild systems, esports tournament operations, and creator ecosystems, influence retention, while platform policies and privacy constraints affect user acquisition and measurement.
Partnerships are increasingly connecting developers to specialized scaling and distribution nodes. Immutable partnered with MetaGravity in January 2025 to bring the Edge of Chaos franchise into the Immutable ecosystem using the HyperScale Engine, underscoring how infrastructure providers are becoming important for large-session or high-concurrency strategy experiences. Distribution also runs through community networks, for example Animoca Brands Anichess launching a public alpha and partnering with Yield Guild Games in October 2024 for Southeast Asia reach. Competitive ecosystems are reinforced through esports and media partners as well, such as NIP Group partnering with The9 Limited (via China Crown Technology) in November 2024 to develop MIR M into a competitive esports title.
Competitive Landscape
The online strategy games market exhibits moderate concentration as tech conglomerates pursue vertical integration while independent studios gain traction through cloud distribution. Microsoft’s post-merger portfolio now spans server infrastructure, subscription distribution, and marquee franchises; its USD 5.5 billion Game Pass revenue target for 2025 illustrates diversified monetization. Disney’s USD 1.5 billion stake in Epic Games underscores entertainment-gaming convergence that threatens traditional publisher gatekeepers.
AI adoption differentiates competitors by cutting dev-cycle times; studios that integrate model-as-a-service pipelines accelerate content drops and maintain retention peaks. Cloud-native newcomers sidestep legacy engine constraints, releasing iterative season updates without client downloads. Conversely, established publishers wield large compliance teams that tackle global age-rating, privacy, and loot-box laws, sustaining advantage in regulated regions.
Browser-based entrants capitalize on low acquisition costs, leveraging social-media virality rather than paid installs. Still, network effects favor incumbents that operate cross-IP meta-platforms offering unified identity and wallet services. The competitive landscape will therefore reward firms capable of synchronizing content, infrastructure, and community ecosystems while managing multicultural regulatory demands.
Online Strategy Games Industry Leaders
-
Mircosoft Coroporation
-
Paradox Interactive AB (publ)
-
Take-Two Interactive Software, Inc.
-
Relic Entertainment Inc.
-
Amplitude Studios SAS
- *Disclaimer: Major Players sorted in no particular order

Online Strategy Games Market Companies Covered in this Report
- Microsoft Corporation
- Tencent Holdings Ltd.
- NetEase Inc.
- Electronic Arts Inc.
- Activision Blizzard, Inc.
- Take-Two Interactive Software, Inc.
- Paradox Interactive AB (publ)
- Relic Entertainment Inc.
- Firaxis Games, Inc.
- Riot Games, Inc.
- SEGA Corporation
- Square Enix Holdings Co., Ltd.
- Supercell Oy
- Amplitude Studios SAS
- FunPlus International AG
- Lilith Games Co., Ltd.
- IGG Inc.
- KIXEYE Inc.
- Goodgame Studios GmbH
- Wargaming Group Limited
- Subset Games LLC
- Madruga Works Ltd.
- A Sharp LLC
Market Opportunities and Future Outlook
Opportunities are forming around cost-efficient production and cross-platform reach as publishers adapt to higher user-acquisition friction and platform fees. Browser-based and cloud delivery provide alternate go-to-market paths that reduce reliance on app-store economics, supported by the evidence cited in the market context of rapid browser-title proliferation (over 15,000 browser-based strategy games launched in H1 2025) and the broader shift toward cloud-native operations.
Capital availability and portfolio activity are also shaping whitespace in tooling, live-ops infrastructure, and monetization technology, not only new title acquisition. Drake Star Partners reported that Q2 2026 saw USD 2.5 billion raised across 96 private financing rounds, which points to active funding conditions for studios and enabling technologies that can support strategy-game pipelines, including AI-assisted content workflows, backend scalability, and ad-tech optimization. At the same time, PocketGamer.biz reported mobile strategy revenue of USD 9.1 billion in H1 2026 with a year-on-year decline, which increases the focus on retention-led monetization such as subscriptions, battle passes, and expansion-pass style content, along with operational efficiency enabled by generative-AI-enabled live-ops rather than relying primarily on paid growth.
Recent Industry Developments in Online Strategy Games Market
- July 2026: Relic Entertainment launched Company of Heroes 3: Final Stand as a standalone roguelite wave-defense experience for PC. The release extends monetization via new playable content around an established strategy IP, supporting sustained engagement outside the base game lifecycle.
- June 2026: Paradox Interactive launched the Nomads expansion alongside the 4.4 Pegasus update for Stellaris. Continued cadence of paid expansions paired with free updates reinforces Paradox's live-service style DLC model in core strategy franchises and keeps the active player base aligned for multiplayer and mod ecosystems.
- May 2024: Relic Entertainment partnered with UK-based investment firm Emona Capital to operate as an independent developer after its separation from Sega. The move reshaped Relic's operating model and capital backing, supporting continued development of owned strategy IP while retaining flexibility for major publishing partnerships.
Online Strategy Games Market Report Scope and Research Methodology
Market Definition and Coverage
The online strategy games market is measured as revenue earned from strategy-focused video games that are played over the internet, across PC, console, and mobile. Revenue is counted from full game sales, subscriptions, and in-game purchases that are directly tied to these titles.
Scope exclusions: We exclude offline-only strategy games and general gaming hardware. We also keep esports media rights and betting out unless they are booked as in-game or subscription revenue for strategy titles.
Segments Covered in This Report
- By Genre
- Real-Time Strategy (RTS)
- Turn-Based Strategy (TBS)
- 4X / Grand Strategy
- Tower-Defense and Auto-Battler
- By Platform
- PC
- Mobile
- Console
- Browser-based
- Cloud Gaming
- By Revenue Model
- In-Game Purchases
- Advertising-Supported
- Subscription / Battle-Pass
- Premium (Paid Download)
- Hybrid
- By Player Mode
- Single-Player
- Asynchronous Multiplayer
- Real-Time Multiplayer
- Massively Multiplayer Online (MMO/4X)
- Esports-Focused
- By Geography
- North America
- United States
- Canada
- Europe
- Germany
- United Kingdom
- France
- Netherlands
- Spain
- Italy
- Rest of Europe
- Asia-Pacific
- China
- Japan
- South Korea
- India
- Rest of Asia-Pacific
- South America
- Brazil
- Argentina
- Mexico
- Rest of South America
- Middle East and Africa
- Middle East
- United Arab Emirates
- Saudi Arabia
- Rest of Middle East
- Africa
- South Africa
- Nigeria
- Rest of Africa
- Middle East
- North America
Data Sources, Market Sizing, and Validation
Desk Research
Desk research starts by mapping the access conditions that make online play possible, and then linking those conditions to how strategy titles monetize. We reviewed public statistics and publications such as the International Telecommunication Union for broadband adoption, World Bank indicators for income and population trends, and national telecom regulators for internet quality and pricing signals.
To convert those macro indicators into a games-specific view, we used sources such as the Entertainment Software Association, app store transparency pages, and platform policy notes that explain subscription structures and in-app purchase rules. We also reviewed company filings, earnings call transcripts, investor decks, and reputable press coverage to track live service launches, content cadence, and pricing changes. Where needed, paid databases were used for company financials and news screening, plus patent databases to confirm themes like cloud gaming and network optimization. These desk sources are illustrative rather than exhaustive, and we used other public references for cross-checks and clarification.
Primary Interviews and Surveys
Primary work focused on checking how revenue is actually earned by strategy titles across regions, and how monetization differs by platform and player mode. We spoke with publishers, developers, distribution partners, and community or product leaders, then used surveys to validate typical ARPPU ranges, churn patterns, and the timing of content updates across APAC, EMEA, and the Americas.
Distribution of primary research fieldwork respondents
| Company type | Respondent position | Region |
|---|---|---|
| Top tier: 39% | CXOs: 13% | APAC: 41% |
| Mid tier: 46% | Functional/Unit leaders: 31% | EMEA: 37% |
| Smaller Players: 15% | Managers: 56% | Americas: 22% |
Market-Sizing & Forecasting
Sizing is built using top-down and bottom-up logic that meet in the middle. On the top-down side, the revenue pool is reconstructed by starting from digital gaming spend, then applying strategy-genre share and online play penetration, and pressure-testing the result using platform mix. We then corroborate the totals using selective bottom-up approximations such as sampled title revenue ranges, observed price points, and volume proxies from engagement and install rankings.
Key inputs used in the model include active player base by platform, in-game purchase attach rates, subscription participation, average monthly spending per payer, and the cadence of major content updates that typically lifts short-term revenue. We also track regional internet quality and device capability trends because they affect match stability and session length for real-time formats. When a direct data point is missing for a smaller geography or niche sub-genre, we fill gaps using peer-market ratios and then re-check the outcome with interview feedback.
For forecasting, scenario analysis is applied around monetization and access variables, including pricing changes, regulation on loot-style mechanics, and platform fee shifts, then we use exponential smoothing for near-term seasonality around major updates and holiday periods. Assumptions are kept simple and revised only when multiple sources point to the same direction.
Data Validation & Update Cycle
Validation is done through several checks so the numbers stay tied to observable market signals. We compare model outputs against independent indicators such as platform revenue disclosures, major title performance milestones referenced in filings, and regional connectivity trends that can explain sudden demand changes.
Outliers are reviewed by a second analyst who re-checks inputs, currency conversions, and year alignment. If needed, we take questionable assumptions back to respondents. Reports are refreshed annually, and interim updates are made when material events occur, including major policy changes, large acquisitions, or monetization model shifts. Before delivery, a final analyst pass is completed so clients receive the latest aligned view.
Mordor Intelligence's Online Strategy Games Market Estimate Compared With Other Published Estimates
Published market values for online strategy games can look far apart because the word strategy is interpreted differently, and some studies combine online and offline play without making the boundary clear. Differences also come from how revenue is counted, since some numbers reflect consumer spend while others use publisher net revenue after platform fees.
Esports tournament revenue and streaming advertising are common add-ons in some estimates, but those are outside Mordor Intelligence scope for this title. This keeps the model tied to game revenue only and helps avoid double counting across media. Another driver is how mobile is treated, since some sources fold in broader casual strategy categories and then inflate totals using aggressive payer growth and fast ARPPU expansion. Currency timing also matters, because fast-moving regions can swing totals when exchange rates are taken from a single month rather than annual averages.
Benchmark comparison
| Source | Market Size | Gaps in Research Methodology |
|---|---|---|
| Mordor Intelligence | USD 21.44 B (2025) | |
| Trade Journal A | USD 19.60 B (2025) | Uses a narrower definition centered on PC and console strategy, and it treats mobile strategy as mostly casual gaming, which reduces the counted revenue pool. |
| Industry Blog B | USD 28.90 B (2025) | Broadly includes adjacent categories like MOBA and some esports and streaming monetization, and it applies optimistic payer growth without clear checks against platform policy and fee treatment. |
The spread mainly reflects category boundaries and revenue accounting, not simple math differences. When the scope is kept to online strategy titles and revenue lines that can be traced back to game monetization, the final number becomes easier to explain, replicate, and update as the market changes.
Key Questions Answered in the Report
How large is the online strategy games market in 2026?
The online strategy games market size reached USD 23.45 billion in 2026 and is forecast to USD 36.74 billion by 2031 at a 9.39% CAGR.
Which genre leads revenues within online strategy titles?
Real-time strategy maintained a 58.10% share in 2025, remaining the largest genre.
What platform is growing fastest for strategy games?
Cloud gaming is projected to expand at 10.21% CAGR through 2031, outpacing all other platforms.
Which revenue model is gaining traction?
Subscriptions are the fastest-growing monetization model, expected to rise at 9.82% CAGR.
Which region will add the most new spending by 2031?
Asia Pacific is forecast for a 9.95% CAGR, placing it as the leading contributor to incremental revenue.