
Online Casual Games Market Size and Share
Market Overview
| Study Period | 2020 - 2031 |
|---|---|
| Market Size (2026) | USD 22.68 Billion |
| Market Size (2031) | USD 29.51 Billion |
| Growth Rate (2026 - 2031) | 5.41 % |
| Fastest Growing Market | Middle East |
| Largest Market | Asia Pacific |
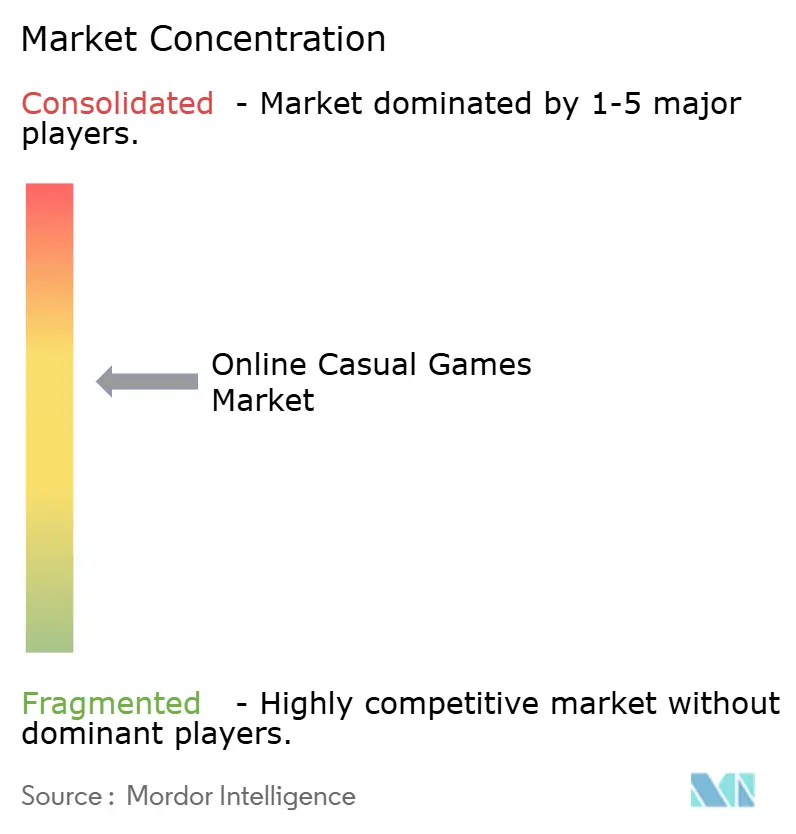
| Market Concentration | Medium |
Major Players *Disclaimer: Major Players sorted in no particular order Image © Mordor Intelligence. Reuse requires attribution under CC BY 4.0. | |
Online Casual Games Market Analysis by Mordor Intelligence
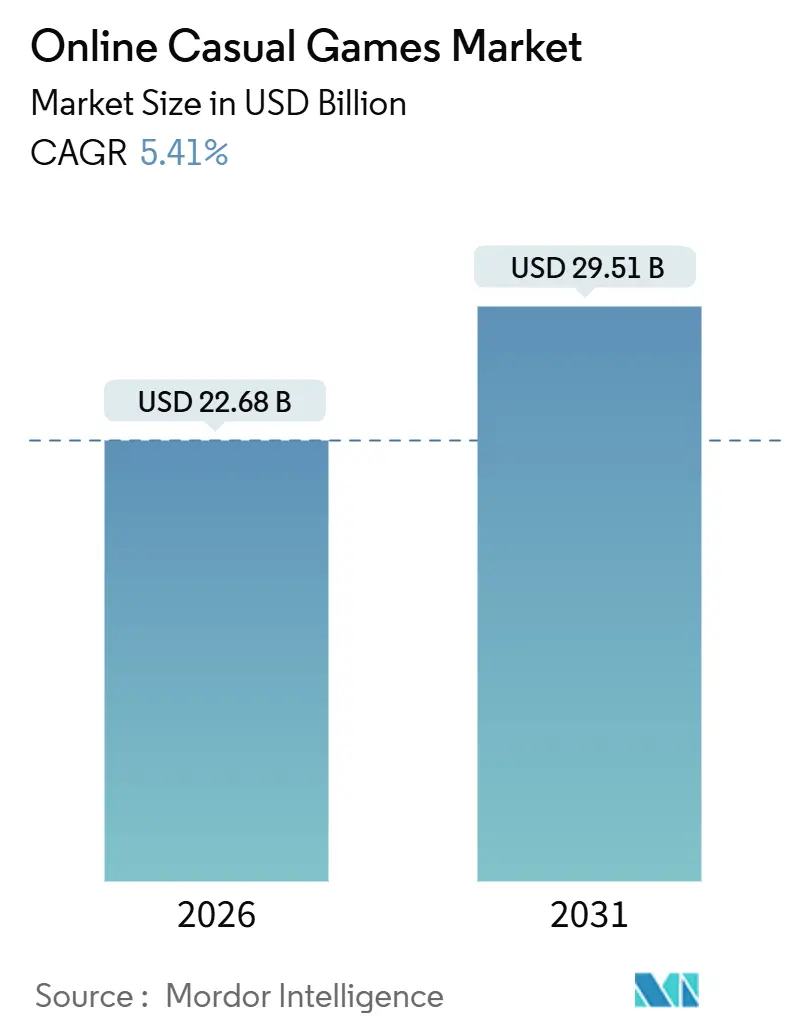
The online casual games market was valued at USD 22.68 billion in 2026 and is projected to reach USD 29.51 billion in 2031, translating into a 5.41% CAGR over the forecast period. This expansion underscores a strategic pivot from single-channel monetization toward hybrid models that blend in-app purchases with rewarded advertising, a mix that captures discretionary micro-spends while preserving free access for price-sensitive users. Rising 5G coverage, sovereign investment funds that underwrite local studio formation, and privacy rules that push publishers toward first-party data loops collectively reinforce the sector’s resilience. Regulatory pressure on loot-box mechanics is steering design toward transparent battle-pass systems that stabilize lifetime value, while direct-to-consumer web shops in Europe are compressing platform fees and boosting average revenue per paying user. Competitive dynamics remain fluid because cross-platform engines have reduced development costs to the point where teams of three or four can launch globally polished titles.
Key Report Takeaways
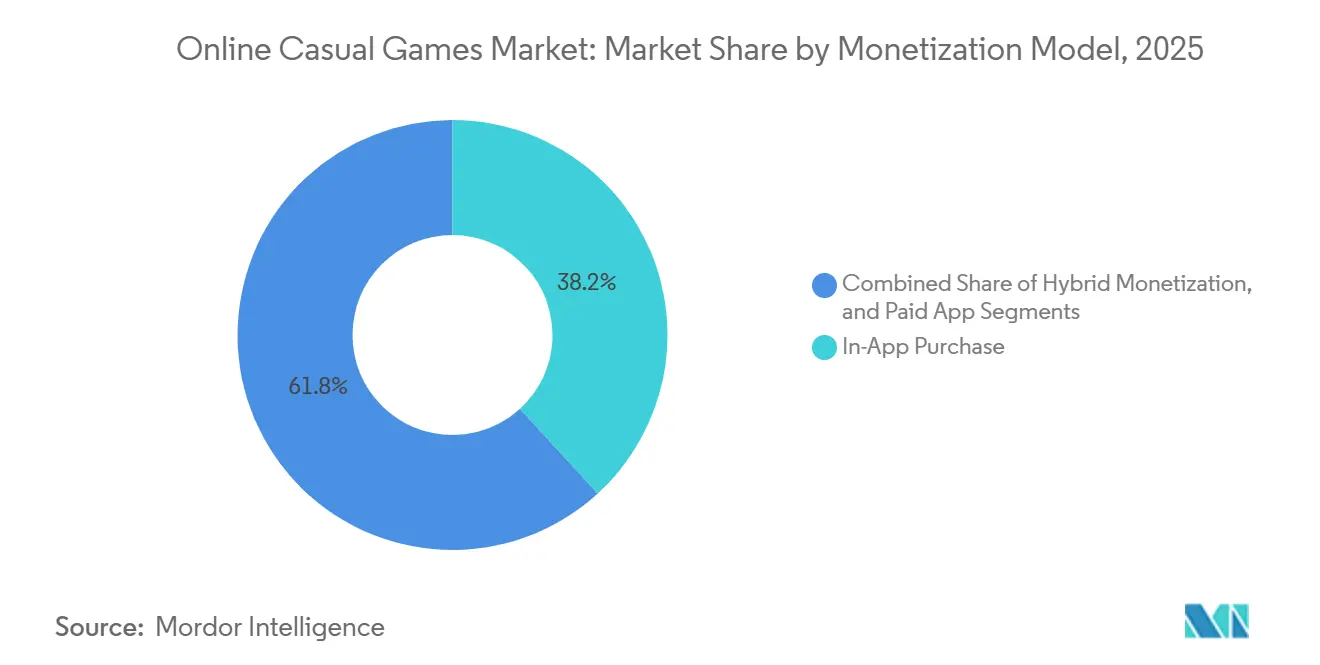
- By monetization model, in-app purchases led with 38.19% of revenue in 2025, while hybrid monetization is projected to advance at a 5.89% CAGR to 2031.
- By platform, smartphones accounted for 72.11% of the online casual games market share in 2025 and are forecast to grow at a 6.16% CAGR through 2031.
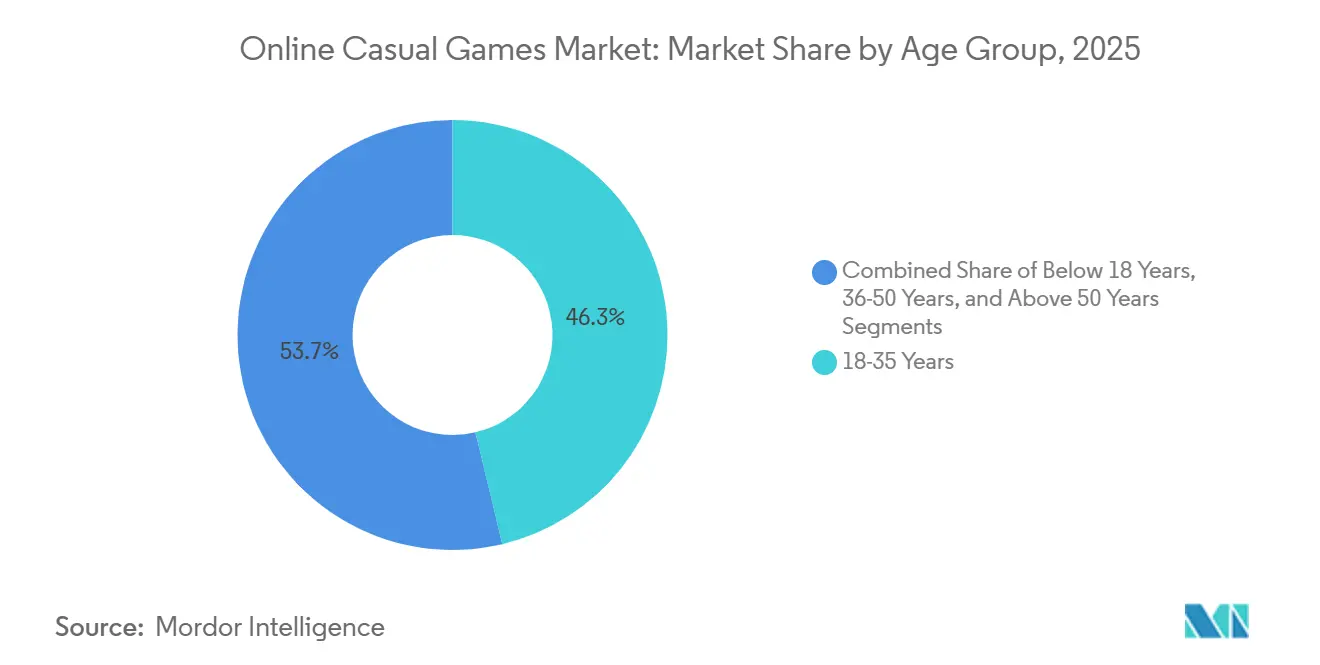
- By age group, the 18-35 cohort accounted for 46.29% of revenue in 2025, while the under-18 segment is set to expand at a 5.58% CAGR during the outlook period.
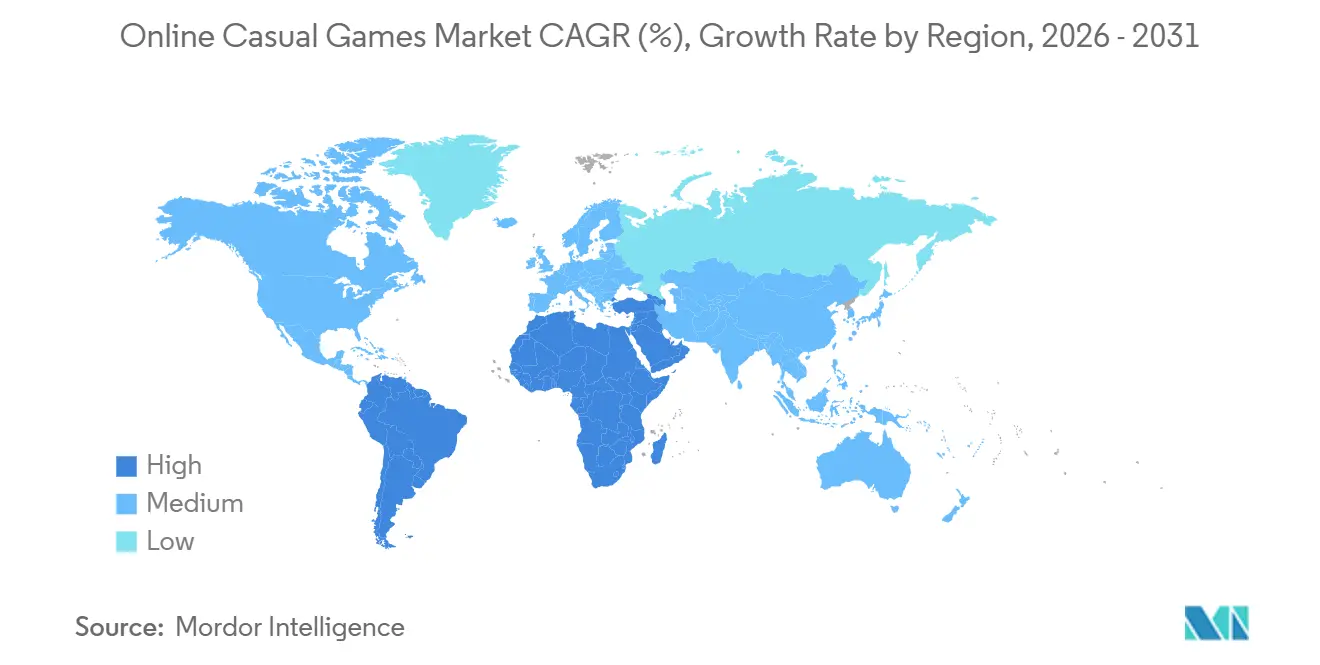
- By geography, Asia Pacific accounted for 35.48% of revenue in 2025, while the Middle East is expected to post the fastest CAGR of 5.92% through 2031.
Note: Market size and forecast figures in this report are generated using Mordor Intelligence’s proprietary estimation framework, updated with the latest available data and insights as of January 2026.
Market Trends and Insights
Drivers Impact Analysis of Online Casual Games Market*
| Driver | (~) % Impact on CAGR Forecast | Geographic Relevance | Impact Timeline |
|---|---|---|---|
| Growing 5G smartphone penetration is accelerating mobile gaming adoption | +0.8% | Asia Pacific, Middle East, South America | Medium term (2-4 years) |
| Expansion of reward-based advertising networks is boosting casual title monetization | +0.9% | North America and Europe, spreading worldwide | Short term (≤ 2 years) |
| Cloud-streaming integration lowers hardware barriers in Southeast Asia | +0.6% | Core Southeast Asia, spill-over to South Asia | Medium term (2-4 years) |
| Cross-platform engines are slashing development costs for indie studios | +0.7% | Emerging markets in South America and Africa, global reach | Short term (≤ 2 years) |
| Direct-to-consumer web shops are reducing platform fees in Europe | +0.5% | Europe, early adoption in North America | Medium term (2-4 years) |
| AI-powered creative optimization is lowering CPI for hyper-casual titles | +0.4% | Middle East and North Africa, expanding into the Asia Pacific | Short term (≤ 2 years) |
| Source: Mordor Intelligence | |||
Growing 5G Smartphone Penetration Accelerating Mobile Gaming Adoption
Low-latency radio networks enable real-time multiplayer on handsets priced under USD 200, allowing publishers to port PC-quality assets without alienating budget buyers. Indonesia alone counts 155 million gamers who rely almost exclusively on mobile access, and sub-20-millisecond latency enables cloud-rendered experiences previously locked behind discrete GPUs. Tencent’s Dungeon and Fighter Mobile demonstrated the commercial upside by surpassing CNY 10 billion (USD 1.4 billion) in its first two post-launch months. As edge nodes extend into tier-2 cities, the performance gap between premium and entry-level devices narrows, democratizing access to content and expanding the online casual games market.
Expansion of Reward-Based Advertising Networks Boosting Casual Titles Monetization
Opt-in video ads have matured into the highest-yield format for casual games, with click-through rates averaging 8.2% in Q4 2024 compared with 1.1% for static banners. Completion rates exceed 90% because users receive guaranteed in-game value, a tradeoff that resonates with 18-35-year-olds who typically budget USD 5-15 a month for virtual goods. Server-side bidding by Google AdMob and Unity Ads now auctions impressions in real time, lifting average revenue per daily active user by up to 25% as higher-yield networks compete for each view.[1] European publishers are layering rewarded ads beneath optional USD 4.99 subscriptions, creating three-tier models that capture spend across income bands without eroding free-to-play reach.
Cloud-Streaming Integration Lowering Hardware Barriers in Southeast Asia
Tencent Cloud Gaming surpassed 500 million registered users in 2024, and 60% of sessions originate from devices with less than 4 GB of RAM. In Indonesia, the Philippines, Vietnam, and Thailand, mobile game downloads totaled 1.93 billion and generated USD 625 million in Q1 2025, with cloud-streamed titles already accounting for 12-15% of playtime. Streaming trims the USD 2-5 per-gigabyte data expense tied to asset downloads in prepaid markets, but rural latency, still 45-60 milliseconds in parts of the Philippines, pushes studios to release downloadable lite editions to preserve retention.
Cross-Platform Engines Slashing Development Costs for Indie Studios
Unity’s September 2024 rollback to a seat-based subscription at USD 2,040 per Unity Pro seat removed variable per-install charges that rattled small studios. Epic Games complements this pivot through its USD 100 million Unreal Engine Mega Grants program, which supports casual and hyper-casual teams without taking equity. A three-person outfit can now bring a polished prototype to market for USD 8,000-12,000 annually, roughly half the pre-2024 total cost of ownership. Cross-platform export shrinks production cycles from 9-12 months to 4-6 months, a tempo advantage in genres where engagement peaks within 90 days.
Restraints Impact Analysis of Online Casual Games Market*
| Restraint | (~) % Impact on CAGR Forecast | Geographic Relevance | Impact Timeline |
|---|---|---|---|
| Stringent loot-box regulations in Germany and Belgium | -0.3% | Europe, monitoring in North America, and the Asia Pacific | Long term (≥ 4 years) |
| Latency issues in rural India are hindering cloud-casual adoption | -0.2% | South Asia, similar gaps in rural Africa and Latin America | Medium term (2-4 years) |
| Rising energy costs are increasing server opex for ad-supported web casual games | -0.3% | Global, most acute in Europe and parts of the Asia Pacific | Medium term (2-4 years) |
| ATT privacy changes are compressing attribution data for mid-tier publishers | -0.4% | Global, strongly felt in iOS-first markets | Short term (≤ 2 years) |
| Source: Mordor Intelligence | |||
ATT Privacy Changes Compressing Attribution Data for Mid-Tier Publishers
Apple’s AdAttributionKit replaces device-level identifiers with aggregated cohorts, reducing post-install event visibility for advertisers by up to 60%. Casual titles with many purchasable SKUs lose the precision needed to bid aggressively for high-value users, prompting a 25-35% budget shift toward organic tactics such as influencer collaborations and in-app cross-promotion. Larger publishers mitigate the data gap by pooling events across multiple franchises, a scale benefit unavailable to single-game studios. The restraint weighs most heavily on puzzle and hyper-casual teams that rely on granular optimization to keep CPI below USD 1 in saturated Western markets.
Rising Energy Costs Increasing Server Opex for Ad-Supported Web Casual Games
Data-center electricity demand is forecast to double between 2025 and 2030, driven by AI workloads that power real-time ad auctions. Publishers of web-based casual titles report that server expenses per thousand impressions rose 12-18% since 2024 in Ireland, Amsterdam, and Singapore. Higher rack densities raise cooling requirements and expose smaller studios to quarter-over-quarter cost swings exceeding 20%. Some publishers relocate workloads to renewable-heavy regions such as Scandinavia or negotiate fixed-rate power contracts, but many indie teams lack the volume to secure favorable terms, pressuring margins on titles that already depend on high-frequency ad inventory.
*Our forecasts treat driver/restraint impacts as directional, not additive. The impact forecasts reflect baseline growth, mix effects, and variable interactions.
Online Casual Games Market Segment Analysis
By Monetization Model:
Hybrid Adoption Leads GrowthHybrid frameworks now sit at the vanguard of the online casual games market, expanding at a 5.89% CAGR through 2031. In-app purchases maintained a 38.19% share of 2025 revenue, sustained by franchises like Candy Crush Saga, yet their share is gradually ceding ground to approaches that combine micro-transactions, rewarded ads, and optional USD 4.99 monthly passes. Roblox’s USD 919 million Q3 2024 revenue illustrates how layered models can monetize both free users and high spenders.[2] Rewarded videos act as a safety valve, letting non-payers progress without hard locks and keeping retention high enough to convert a minority into payers. The online casual games market for subscription-driven word and puzzle titles is modest today, but is projected to expand as players seek ad-free convenience.
Hybrid design also buffers developers against privacy-related swings in user acquisition efficiency. When attribution visibility narrows, teams lean on engagement loops rather than precision targeting, a hedge that has gained salience since Apple’s privacy changes. Small starter packs priced at USD 0.99 amplify initial conversion by reducing sticker shock, while battle passes introduce predictable revenue arcs over four-week cycles. Paid-only apps are relegated to niche board-game adaptations because free alternatives and rapid content inflation discourage upfront fees.

By Platform:
Smartphones Remain the Center of GravitySmartphones generated 72.11% of 2025 spending and are forecast to grow at 6.16% annually, ensuring mobile remains the backbone of the online casual games market. Sensor Tower logged 1.93 billion Southeast Asian downloads in Q1 2025, underscoring mobile’s gravitational pull. Tablets appeal to younger learners, especially under-18s, who use 10-inch screens for gamified lessons, yet replacement cycles stretch well beyond those of smartphones. Browser-based experiences are re-emerging because WebGL enables near-native performance without installing apps, and Europe’s Digital Markets Act removed distribution friction by forcing Apple and Google to tolerate alternative app stores.
Cross-platform engines further soften platform boundaries by letting studios export a single build to iOS, Android, and WebGL. Roblox’s October 2024 PlayStation launch raised quarterly engagement hours to 18.7 billion, proving that device-agnostic inventories deepen networks and extend play sessions. The online casual games market on PCs and browsers is smaller but growing steadily in idle genres, where players keep tabs open during work hours. Carrier billing and e-wallets, dominant in Indonesia and other emerging economies, cement the smartphone’s lead by simplifying micro-payments unavailable on desktop storefronts.
By Age Group:
Under-18s Accelerate, Adults Still Monetize MostThe under-18 cohort is poised for a 5.58% CAGR, driven by parental acceptance of gaming as an educational tool and a screen-time management tool. Age-gated storefronts and family-sharing functions reduce purchase friction, making it easier for minors to secure permissioned access to USD 0.99 booster packs. Adults aged 18-35 retained 46.29% of 2025 revenue, leveraging higher disposable income and mobile immersion during commutes. As this group continues to dominate in engagement minutes, it shapes update cadences and live-ops calendars across the online casual games market.
Players aged 36-50 gravitate toward asynchronous puzzle loops, valuing pause-friendly mechanics that fit around work obligations. Those above 50 represent the smallest but highest-spending slice, averaging more than USD 20 per paying user each month in social casino formats, a segment that often surpasses youthful cohorts in monetization density. Upcoming European rules requiring real-money equivalents for virtual currencies may alter the offerings for minors, but developers are already piloting separate cosmetic-only stores to pre-empt compliance mandates. Overall, demographic diversification cushions revenue volatility and ensures steady gains for the online casual games industry.
Geography Analysis
APAC Online Casual Games Market
Asia Pacific commanded 35.48% of spending in 2025, anchored by China’s partial regulatory thaw that cleared NetEase to launch Marvel Rivals and helped Tencent post CNY 51.8 billion (USD 7.3 billion) in Q3 2024 gaming revenue. Southeast Asia’s 1.93 billion Q1 2025 downloads and USD 625 million in receipts highlight the potential unlocked by inexpensive Android devices and carrier billing integrations. India’s rural teledensity is 58.8%, compared with 125.3% in urban areas, so metropolitan gamers stream high-fidelity titles, while villagers gravitate toward lightweight downloadable games that cache assets locally. Japan and South Korea remain revenue-dense but slower-growing, the latter setting a template for alternative payment models after passing its in-app billing choice legislation in 2024.
MEA Online Casual Games Market
The Middle East is on course for a 5.92% CAGR, powered by Saudi Arabia’s USD 38 billion gaming investment program and its USD 4.9 billion Scopely acquisition. Vision 2030 targets USD 13.3 billion in gaming GDP contribution, supported by the Qiddiya Gaming District and Dubai’s 10-year Gaming Visa. With 420 million Arabic speakers worldwide, the addressable pool for localized titles is vast, and AI-driven asset generation now compresses translation costs enough for mid-tier studios to pursue the opportunity. Africa’s emerging markets lag due to smartphone affordability and fragmented payment rails, but mobile money services such as M-Pesa are widening the funnel in East Africa.
North America and Europe Online Casual Games Market
North America and Europe collectively delivered roughly 45% of 2025 revenue. The United States still leads on absolute spend, though growth tapers as CPI inflation meets Apple’s privacy policy constraints. Canada and Mexico expand faster, with Mexico’s 50 million gamers serving as a gateway into Spanish-speaking South America. Europe’s Digital Markets Act is already shifting spend to web shops that bypass 30% platform fees, boosting average revenue per paying user by as much as 18% without raising prices.[3] Germany and Belgium’s loot-box prohibitions accelerate cosmetic-only monetization, forcing studios to maintain region-specific builds but also smoothing retention by removing perceived pay-to-win features.
Regulatory Landscape
Regulation for online casual games is tightening around player protection, data use, and monetization transparency, pushing publishers toward clearer purchase disclosures and age-gated design. In the United States, the amended COPPA rule became enforceable on April 22, 2026, raising the compliance bar for child-directed or mixed-audience casual titles by requiring separate parental consent for targeted advertising and certain third-party disclosures. Brazil added monetization-specific constraints via Lei 15.211/25 (Felca Law), effective March 17, 2026, which bans paid loot boxes in games accessible to minors and elevates requirements for age verification and parental controls, reinforcing the shift from randomized rewards toward battle passes and cosmetic-only stores already visible in Europe.
Market access is also being shaped by platform and consumer-protection policy. The European Commission is preparing the Digital Fairness Act (DFA), scheduled for Q4 2026, aimed at manipulative interface design and virtual-currency disclosures, while the UK Digital Markets, Competition and Consumers Act (DMCCA) has flagged harmful choice architecture (dark patterns) as an enforcement priority, raising risk for aggressive funnel mechanics in casual games. In India, the Promotion and Regulation of Online Gaming Act, 2025 and associated Rules took effect on May 1, 2026, establishing the Online Gaming Authority of India and formalizing distinctions between online money games and social/casual games, creating a clearer compliance pathway for casual publishers operating in one of the world’s largest mobile-first user bases.
Value Chain Analysis
The online casual games value chain is digital-first, spanning concept and design, development and live-ops production, distribution and discovery, monetization execution, and ongoing analytics-led optimization. Creation typically blends internal studios with outsourced art, QA, localization, and user-acquisition creative production, increasingly supported by cross-platform engines that compress build and porting cycles across iOS, Android, and web. Cloud infrastructure and tooling (hosting, CDNs, identity, anti-fraud, and telemetry) underpin live-service operations, and publishers coordinate with ad-tech intermediaries for rewarded video and programmatic demand while maintaining privacy-safe first-party data loops as mobile attribution becomes more constrained.
Downstream, distribution power concentrates in mobile platforms and major discovery surfaces, but alternative routes are gaining relevance through direct-to-consumer web shops and web-based gameplay enabled by modern browser graphics stacks. Payment processing and compliance (age gates, consent, and virtual-currency disclosures) have become core value-chain capabilities as rules tighten across regions. The sector also exhibits cooperative, contract-driven economics, where operators and supply-side partners align investment levels (content updates, quality, and performance) with revenue-sharing mechanisms across ads, in-app purchases, and subscriptions, making analytics and retention operations as critical as initial development for margin capture.
Competitive Landscape
Roughly 40% of global revenue resides with the top 10 publishers, confirming moderate concentration that still leaves room for breakout hits. Tencent’s Honor of Kings now clears 100 million daily actives, yet the publisher wrestles with mounting acquisition costs and Chinese regulatory oversight. NetEase leverages Marvel Rivals to court Western audiences while offsetting domestic license bottlenecks. Microsoft integrated King into the Xbox Game Pass framework after finalizing its USD 68.7 billion Activision Blizzard deal, but Candy Crush revenue, while sturdy at USD 727 million in Q3 2024, grows only in single digits.
Voodoo, having surpassed 7 billion lifetime downloads, pivots toward hybrid-casual models that extend 30-day retention by layering meta-progression loops on traditionally throwaway mechanics. White-space opportunities cluster around older demographics, underserved languages, and fragmented payment terrains. The over-50 cohort’s willingness to pay USD 20 per month for social casino titles remains largely unmet by mainstream publishers. The 420 million-strong Arabic audience still has limited catalogue depth, and Latin America’s mélange of carrier billing, e-wallets, and cash vouchers rewards studios that localize checkout flows for Mercado Pago or OXXO.
AI-powered creative pipelines compress cost-per-install by up to 35%, allowing nimble indie teams to iterate 50-100 ad variants a week and outmaneuver slower, committee-bound corporations. Roblox’s user-generated economy, which paid developers USD 1.2 billion over the year to Q3 2024, redefines competition by turning players into creators and lowering the platform owner's content acquisition risk.
Online Casual Games Industry Leaders
-
Zynga Inc.
-
Microsoft Corporation
-
Konami Digital Entertainment
-
Apple Inc.
-
Ubisoft Entertainment SA
- *Disclaimer: Major Players sorted in no particular order
Online Casual Games Market Companies Covered in this Report
- Tencent Holdings Ltd.
- Activision Blizzard Inc.
- King Digital Entertainment Plc
- Playrix Holding Ltd.
- Zynga Inc.
- Moon Active Ltd.
- Ubisoft Entertainment SA
- Microsoft Corporation
- Apple Inc.
- Konami Digital Entertainment
- Sega Corporation
- Sony Interactive Entertainment
- Nintendo Co., Ltd.
- Bandai Namco Entertainment Inc.
- Rovio Entertainment Corporation
- NetEase Games
- Supercell Oy
- Miniclip SA
- Roblox Corporation
- Scopely, Inc.
- Voodoo SAS
- Playtika Holding Corp.
Market Opportunities and Future Outlook
Opportunity areas concentrate where publishers can monetize without relying on opaque mechanics and where localization and payments are still under-served. The move away from loot boxes in markets such as Brazil (Felca Law effective March 17, 2026) and continued scrutiny in Europe increases whitespace for transparent progression monetization (battle passes, cosmetics, and clearly priced bundles) that can be deployed with region-specific compliance settings. In India, the online gaming framework effective May 1, 2026 distinguishes social/casual games from online money games and creates a more defined operating lane for compliant casual publishers, supporting investments in local language content, age-appropriate design, and domestic payment methods.
Commercial whitespace is also opening in distribution and monetization infrastructure rather than only in new titles. Europe’s momentum toward direct-to-consumer web shops, alongside the industry’s pivot to hybrid monetization, increases demand for secure web payments, customer support, fraud prevention, and privacy-safe CRM stacks that help publishers retain value when attribution signals are weaker. On the product side, Q2 2026 market reviews highlight that casual titles sustaining revenue increasingly integrate deeper social layers (gifting, co-op events, and leaderboards), which favors studios that can operate live-ops calendars and community tooling at scale, including for underserved languages such as Arabic where catalog depth remains limited.
Recent Industry Developments in Online Casual Games Market
- July 2026: Zynga - Partnered with PubMatic to integrate the OpenWrap SDK into Zynga's mobile gaming inventory, enabling agentic advertising and commerce-enabled creative formats. The integration expands Zynga's advertising and monetization capabilities across its mobile inventory, enabling dynamic advertising formats.
- July 2026: Tencent/Playtika - Reported negotiations for Tencent to acquire SuperPlay, a developer of titles including Disney Solitaire and Dice Dreams, in a deal valued between $1 billion and $1.5 billion. The negotiations center on Tencent acquiring SuperPlay, a developer of Disney Solitaire and Dice Dreams, for 1 to 1.5 billion dollars. The move broadens Tencent's footprint in the casual games segment and expands cross platform reach.
- June 2026: Zynga - Announced new champions and in-game events for Game of Thrones: Legends and Game of Thrones: Slots to coincide with the June 21 season premiere of HBO’s House of the Dragon. Zynga unveiled new champions and events for GOT titles in alignment with the House of the Dragon premiere. The timing leverages a major cultural moment to drive engagement and extend monetization opportunities.
Online Casual Games Market Report Scope and Research Methodology
Market Definition and Coverage
For this study, the market covers revenue generated from casual games that are played online across mobile, PC, and console, including spending on in-game items and paid access, plus advertising-led monetization where it is tied to gameplay.
Scope exclusions: This sizing excludes offline-only casual games and revenue from hardware, accessories, and live streaming or esports media rights.
Segments Covered in This Report
- By Monetization Model
- Advertising
- In-App Purchase
- Paid App
- By Platform
- Smartphone
- Tablet
- PC / Web
- By Age Group
- Below 18 Years
- 18-35 Years
- 36-50 Years
- Above 50 Years
- By Geography
- North America
- United States
- Canada
- Mexico
- South America
- Brazil
- Argentina
- Rest of South America
- Europe
- Germany
- United Kingdom
- France
- Italy
- Spain
- Rest of Europe
- Asia Pacific
- China
- Japan
- South Korea
- India
- Rest of Asia Pacific
- Middle East and Africa
- Middle East
- United Arab Emirates
- Saudi Arabia
- Turkey
- Rest of Middle East
- Africa
- South Africa
- Rest of Africa
- Middle East
- North America
Data Sources, Market Sizing, and Validation
Desk Research
Desk research was used to build the base structure for the model and to anchor the bigger demand signals. We referred to public sources such as the International Telecommunication Union for internet adoption, World Bank indicators for income and connectivity proxies, and OECD digital economy releases where available. These sources help explain how reachable the player base is by region.
To keep monetization assumptions realistic, we also reviewed public releases from the U.S. Federal Trade Commission and the European Commission on consumer and digital policy direction, along with industry materials from the Entertainment Software Association and IAB for gaming and advertising context. Platform policy updates and public reporting from app stores were tracked to capture how fee, privacy, and measurement changes affect net receipts and ad yield over time. Patent databases were selectively checked to understand trends such as ad formats and gameplay mechanics that can influence retention and monetization. In addition, a paid subscription for company financials and a news and financials feed was used only to verify disclosed revenue exposure where it exists. These examples are not exhaustive, and many other public sources were also used for data collection, validation, and clarification.
Primary Interviews and Surveys
Primary work focused on validating how casual titles monetize across geographies, and how pricing and ad yield have been shifting over the last 12 to 24 months. We spoke with a mix of game publishers, ad monetization specialists, and distribution-side participants, then used their feedback to stress-test assumptions around payer share, ARPDAU direction, and platform fee impacts across APAC, EMEA, and the Americas.
Distribution of primary research fieldwork respondents
| Company type | Respondent position | Region |
|---|---|---|
| Top tier: 33% | CXOs: 16% | APAC: 47% |
| Mid tier: 46% | Functional/Unit leaders: 35% | EMEA: 29% |
| Smaller Players: 21% | Managers: 49% | Americas: 24% |
Market-Sizing & Forecasting
Sizing starts from a demand-pool build where internet-connected gamers and reachable device users are reconstructed by region, then filtered through casual gaming participation and monetization rates to arrive at revenue. That top-down and bottom-up logic is checked with selective bottom-up approximations, such as sampled title-level revenue ranges, ad-fill and eCPM direction, and implied revenue per active user. These cross-checks help adjust totals when the first pass looks stretched.
A few inputs matter more than others in this market, so we tracked them carefully. These include smartphone and broadband penetration, changes in ad load and ad yield, payer conversion and average spend progression, store commission and policy changes that influence net revenue, and seasonality around holiday periods and major live-ops cycles. Where bottom-up signals are incomplete for smaller titles, gaps are handled using genre and region averages that were validated in interviews, then rebalanced so the final total still aligns with the larger reach and monetization indicators.
Forecasting is done using scenario analysis, since monetization in casual games is sensitive to privacy policy changes, ad market cycles, and live-ops intensity. In practice, the base case uses consensus direction from expert inputs for payer share and ad yield, and then we apply conservative and aggressive scenarios to test how far revenue can move without breaking known adoption constraints.
Data Validation & Update Cycle
Validation is done through multiple checks, where results are compared against independent signals such as regional app economy trends, network and device adoption, and the direction of ad pricing in gaming. If an output looks unusual, we re-check assumptions like payer conversion, currency translation timing, and whether one-time events inflated a quarter. We also re-contact sources when the variance cannot be explained cleanly.
Before sign-off, the model goes through step-by-step analyst review so inputs, formulas, and scope boundaries stay consistent across regions and years. Reports are refreshed annually, and interim updates are done when material events shift the outlook, followed by a final pre-delivery pass so clients receive the latest updated view.
Mordor Intelligence's Online Casual Games Market Estimate Compared With Other Published Estimates
Published numbers for online casual games can vary more than expected because teams do not always treat monetization and timing the same way, and because some sources rely on a narrower slice of the revenue pool. Differences also come from how a study handles net versus gross revenue, the exchange rates used for multi-country rollups, and how quickly assumptions are refreshed when ad pricing or payer behavior shifts.
In this market, the biggest gap drivers are usually whether advertising revenue is counted alongside in-app purchases, whether the measure is global or limited to one country, and whether the dataset reflects the latest privacy and store-policy impacts on ad yield and net receipts. A refresh-led approach also matters, because small changes in ARPDAU and payer share can shift the total quickly, and currency timing can move multi-region totals even when local demand is stable.
Benchmark comparison
| Source | Market Size | Gaps in Research Methodology |
|---|---|---|
| Mordor Intelligence | USD 22.68 B (2026) | |
| Industry Data Provider A | USD 22.99 B (2025) | Built from IAP revenue only across the top 1,000 casual games, and the cited year is a forecast based on partial-year run-rate logic, which can understate Q4 seasonality and excludes advertising revenue. |
| Industry Association B | USD 7.77 B (2024) | Represents U.S. mobile game advertising revenue, so it is geography-limited and monetization-limited, and it does not capture in-app purchases or non-mobile platforms. |
The spread is mainly explained by monetization coverage, geography coverage, and the time-stamp used for currency conversion and for updating price and yield inputs. By re-checking ARPDAU and ad-yield movement close to the publication cut and keeping one consistent exchange-rate timing across regions, Mordor Intelligence keeps the total anchored to an online casual gaming revenue pool that can be traced back to clear demand and monetization variables.
Key Questions Answered in the Report
How large is the online casual games market today, and what CAGR is expected?
The online casual games market stands at USD 22.68 billion in 2026 and is projected to grow at a 5.41% CAGR, reaching USD 29.51 billion by 2031.
Which platform contributes most to spending on online casual titles?
Smartphones generate 72.11% of 2025 revenue and are projected to expand at a 6.16% CAGR, keeping mobile firmly in the lead.
What monetization mix is gaining the most traction with players?
Hybrid frameworks that blend in-app purchases, rewarded ads, and optional subscriptions are advancing at a 5.89% CAGR, outpacing single-stream models.
Which region is forecast to grow fastest in casual gaming through 2031?
The Middle East is expected to post a 5.92% CAGR, fueled by Saudi Arabia’s USD 38 billion commitment to gaming infrastructure and studio investment.
How are privacy changes on iOS affecting user-acquisition strategy?
Apple’s aggregated attribution reduces post-install visibility by up to 60%, prompting mid-tier publishers to reallocate 25-35% of their budgets to organic growth channels.
What demographic shows the highest spend per user in casual games?
Players over 50 years old, especially in social casino formats, spend an average of more than USD 20 per paying user per month, the highest among age groups.