
Onboard Connectivity Market Size and Share
Market Overview
| Study Period | 2020 - 2031 |
|---|---|
| Market Size (2026) | USD 12.32 Billion |
| Market Size (2031) | USD 20.73 Billion |
| Growth Rate (2026 - 2031) | 10.97% CAGR |
| Fastest Growing Market | Asia Pacific |
| Largest Market | North America |
| Market Concentration | Medium |
Major Players *Disclaimer: Major Players sorted in no particular order Image © Mordor Intelligence. Reuse requires attribution under CC BY 4.0. | |
Onboard Connectivity Market Analysis by Mordor Intelligence
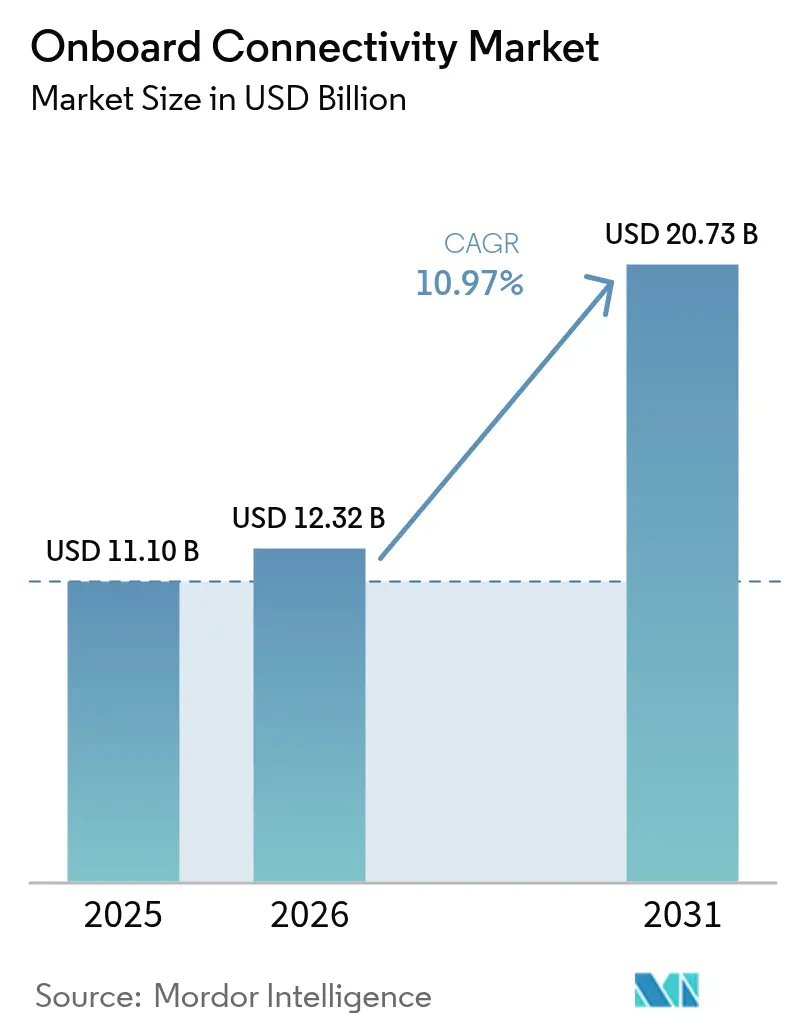
The on-board connectivity market size is expected to grow from USD 11.10 billion in 2025 to USD 12.32 billion in 2026 and is forecast to reach USD 20.73 billion by 2031 at 10.97% CAGR over 2026-2031. Sustained growth reflects a decisive migration from sole reliance on geostationary satellites to hybrid architectures that merge LEO, MEO, and GEO capacity, delivering lower latency and stronger network resilience. Regulatory momentum—most notably the Federal Communications Commission’s Supplemental Coverage-From-Space rules—now permits satellite-terrestrial convergence that unlocks direct-to-device business models. Airlines, rail operators, and shipping lines translate these rule changes into new revenue streams via advertising-supported Wi-Fi, integrated 5G backhaul, and predictive-maintenance analytics. Equipment vendors respond by embedding software-defined networking and multi-constellation terminals whose adaptive routing improves uptime and mitigates single-orbit failure risks.
Key Report Takeaways
- By transportation platform, aviation led with 66.02% of the onboard connectivity market share in 2025; rail is projected to grow at a 13.12% CAGR through 2031.
- By component, hardware contributed 45.42% revenue share in 2025, while services are advancing at a 12.23% CAGR to 2031.
- By connectivity technology, satellite solutions accounted for a 75.10% share of the onboard connectivity market in 2025, whereas hybrid multi-orbit architectures expanded at a 15.89% CAGR.
- By application, entertainment retained 46.30% revenue share in 2025, while safety and operations functions are accelerating at a 12.22% CAGR.
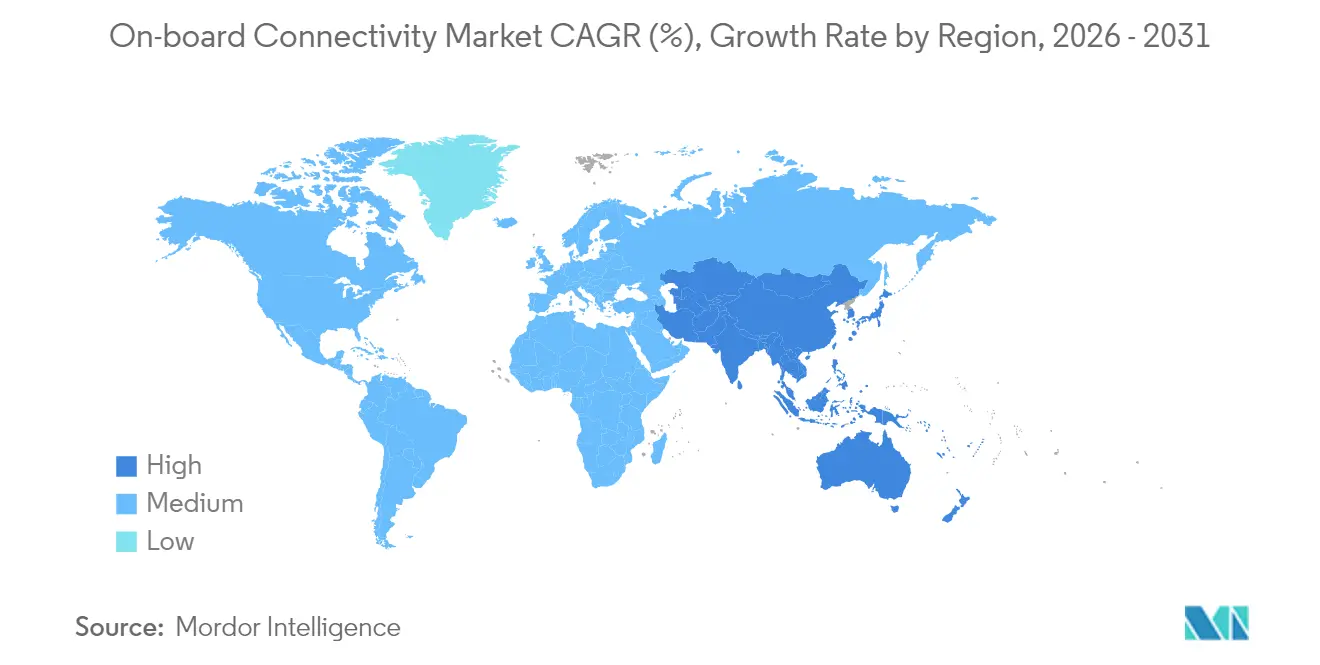
- By geography, North America dominated with a 41.30% share in 2025; Asia-Pacific is the fastest-growing region, with a 12.74% CAGR to 2031.
Note: Market size and forecast figures in this report are generated using Mordor Intelligence’s proprietary estimation framework, updated with the latest available data and insights as of 2026.
Global Onboard Connectivity Market Trends and Insights
Drivers Impact Analysis*
| Driver | (~) % Impact on CAGR Forecast | Geographic Relevance | Impact Timeline |
|---|---|---|---|
| Surge in demand for high-speed passenger Wi-Fi | +2.8% | Global, with North America and Europe leading adoption | Medium term (2-4 years) |
| Rapid deployment of LEO constellations | +3.2% | Global, with Asia-Pacific showing highest growth acceleration | Short term (≤ 2 years) |
| Rising global passenger volumes | +1.9% | Asia-Pacific core, spill-over to MEA and South America | Long term (≥ 4 years) |
| Advertising-supported connectivity models | +1.5% | Global, with mature markets in North America and Europe | Medium term (2-4 years) |
| Multi-orbit network reliability gains | +2.1% | Global, with maritime and aviation prioritization | Medium term (2-4 years) |
| Direct-to-device satellite services | +1.8% | Global, with early deployment in North America and Asia-Pacific | Short term (≤ 2 years) |
| Source: Mordor Intelligence | |||
Surge in Demand for High-Speed Passenger Wi-Fi
Eighty-seven percent of passengers are willing to view adverts in exchange for free Wi-Fi, shifting revenue models toward advertising-supported access.[1]Source: PAX International, “Connection in the Clouds,” pax-intl.com Broadband-enabled services could generate USD 30 billion in ancillary airline revenue annually by 2035. Viasat now supports more than 60 airlines under advert-funded contracts, demonstrating scale. Passenger surveys indicate that 83% would rebook with carriers offering superior Wi-Fi, cementing connectivity as a differentiator. Maritime lines echo this trajectory; Carnival Corporation’s fleet-wide Starlink rollout lifted guest satisfaction and crew welfare. Airlines also merge seatback displays with personal devices, delivering targeted content that boosts brand loyalty and advertising yield.
Rapid Deployment of LEO Constellations
Starlink’s initial 12 Direct-to-Cell satellites began text services in 2024, aiming for voice/data capability in 2025, reducing reliance on cabin antennas for many use cases. Viasat integrates Telesat Lightspeed capacity, while Hughes’ Fusion package blends LEO and GEO bandwidth for Delta Air Lines. Direct-to-device agreements between satellite and mobile operators eliminate specialized terminals for the rail and maritime sectors. Arctic-region coverage has improved following Eutelsat OneWeb and Intelsat demonstrations above the Arctic Circle. Falling satellite manufacturing costs from 3D printing and vertical integration support competitive pricing that undercuts traditional GEO economics. FCC spectrum allocations further streamline constellation rollouts, shortening time-to-service.[2]Source: Federal Register, “Supplemental Coverage From Space,” federalregister.gov
Rising Global Passenger Volumes
IATA expects air travel to approach 7.2 billion annual passengers within the decade, pressuring carriers to expand bandwidth capacity. Asia-Pacific requires USD 43 trillion in transport infrastructure by 2035, embedding connectivity into new assets from inception. Australia’s planned Sydney-Melbourne high-speed rail corridor labels onboard internet critical for mobile-office commuters. Cruise traffic continues its rebound, prompting Carnival’s full Starlink deployment. A digitally-native traveler cohort now expects seamless service during any journey leg. Emerging urban air mobility (UAM) services will heighten capacity requirements for eVTOL craft and autonomous operations.
Multi-Orbit Network Reliability Gains
SES’s Open Orbits program dynamically routes traffic across GEO, MEO, and LEO capacity, promising higher uptime than single-orbit solutions. Integrated terrestrial 5G backhaul assures uninterrupted service across maritime zones with frequent coverage transitions. Electronically steered antennas and adaptive beam-forming maintain link quality under varying orbital geometries. Service contracts now embed redundancy clauses that oblige providers to reroute traffic across multiple constellations. Software-defined networking enables real-time spectrum optimization and balancing load and cost. Distributed architectures complicate cyberattack vectors, addressing regulators’ resilience priorities.
Restraints Impact Analysis*
| Restraint | (~) % Impact on CAGR Forecast | Geographic Relevance | Impact Timeline |
|---|---|---|---|
| High retrofit and certification costs | -1.8% | Global, with stricter regulations in North America and Europe | Short term (≤ 2 years) |
| Stringent aviation and maritime regulation | -1.2% | Global, with varying compliance requirements by region | Long term (≥ 4 years) |
| RF spectrum congestion (Ku/Ka) | -0.9% | Global, with higher congestion in North America and Europe | Medium term (2-4 years) |
| Cyber-security vulnerabilities | -1.1% | Global, with heightened concerns in developed markets | Short term (≤ 2 years) |
| Source: Mordor Intelligence | |||
High Retrofit and Certification Costs
Connectivity retrofits can extend 12–18 months and cost millions per aircraft, driven by FAA Advisory Circular 20-168 test requirements.[3]Source: Federal Aviation Administration, “AC 20-168 Guidance,” faa.gov EASA’s ETSO framework imposes parallel hurdles for cross-border fleets. Electronically steered antennas introduce new approval categories that lack historical benchmarks, prolonging reviews. Harsh maritime environments demand ruggedized hardware and prolonged sea trials, inflating unit economics. Fixed certification expenses weigh hardest on smaller carriers, reinforcing scale advantages for larger operators.
Stringent Aviation and Maritime Regulation
The FAA is drafting cyber-resilience rules that compel airlines to run deeper risk assessments and implement hardened data links, raising compliance spend. ICAO’s new standards for air-ground data security extend these mandates worldwide. Maritime safety systems rely on L-band for distress signaling, maintaining 78,000 vessel subscriptions worth USD 465 million in 2023, satellitetoday.com. Ku/Ka-band overcrowding drives coordination costs as operators negotiate interference-avoidance protocols. The US Federal Transit Administration requires robust cybersecurity audits for connected rail stock.
*Our forecasts treat driver/restraint impacts as directional, not additive. The impact forecasts reflect baseline growth, mix effects, and variable interactions.
Segment Analysis
By Component: Services Accelerate Despite Hardware Dominance
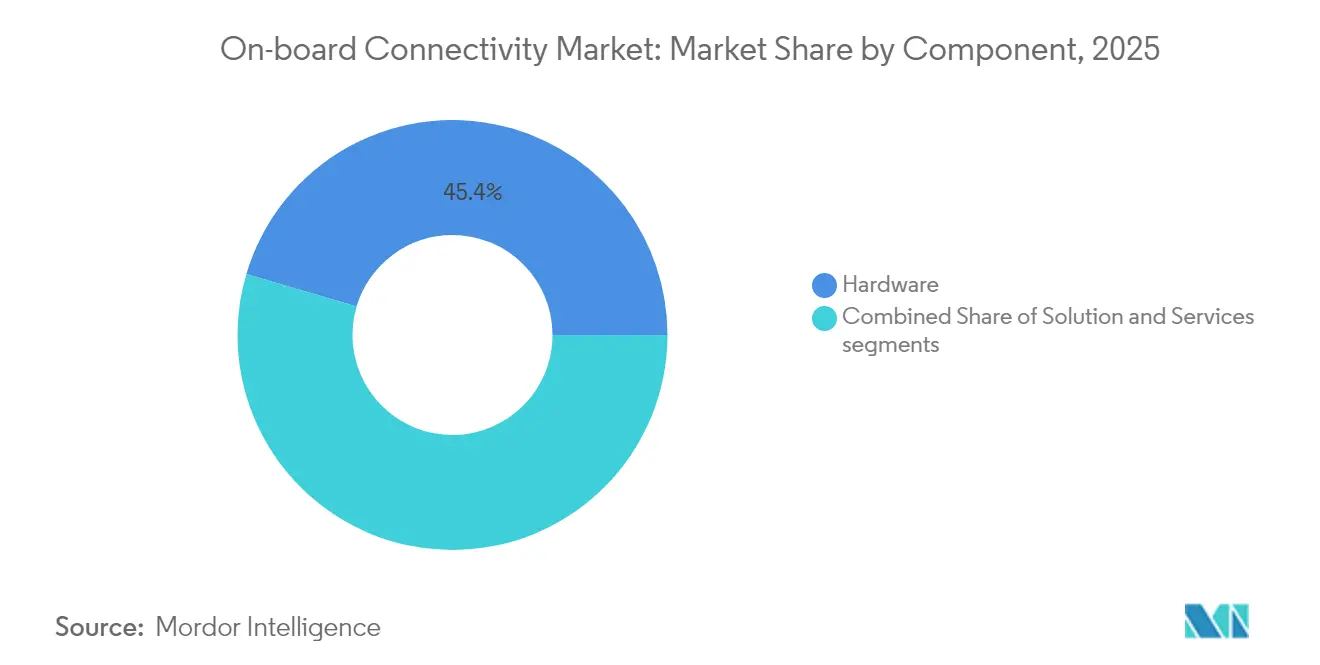
Hardware retained 45.42% of 2025 revenue, covering antennas, modems, and routers that anchor physical links within the onboard connectivity market. Services, however, are forecasted to grow at 12.23% CAGR, reflecting operator preference for outcome-based contracts that shift performance risk to vendors. The onboard connectivity market size attached to managed services is projected to widen as multi-orbit complexity outpaces in-house skill sets.
Service growth parallels rising demand for installation expertise, end-to-end monitoring, and guaranteed uptime. Providers bundle software maintenance, cybersecurity, and regulatory compliance, fostering predictable total cost of ownership. Airlines and rail operators increasingly sign multi-year service agreements that align fees with passenger usage, while maritime firms seek packages that merge crew welfare and operational data backhaul. Hardware vendors respond by embedding software functions that enable remote diagnostics, ensuring continual service revenue even after equipment sale.


By Connectivity Technology: Hybrid Solutions Challenge Satellite Supremacy
Satellite solutions delivered 75.10% of 2025 revenue, underscoring the historical foundation of the onboard connectivity market. Yet, hybrid multi-orbit architectures are expanding at 15.89% CAGR, shifting the competitive center of gravity. The onboard connectivity market share commanded by single-orbit models is expected to narrow as operators prioritize resilience.
Hybrid adoption accelerates because LEO segments cut latency for real-time services, while GEO remains ideal for bulk streaming. Software-defined radios switch between constellations in milliseconds, supporting uninterrupted sessions. Rail corridors in dense geographies deploy ground-to-train 5G for cost-effective capacity, defaulting to satellite over remote stretches. Vendors differentiate via orchestration algorithms that allocate traffic to the lowest-cost path without user intervention.
By Transportation Platform: Rail Connectivity Surges Amid Aviation Leadership
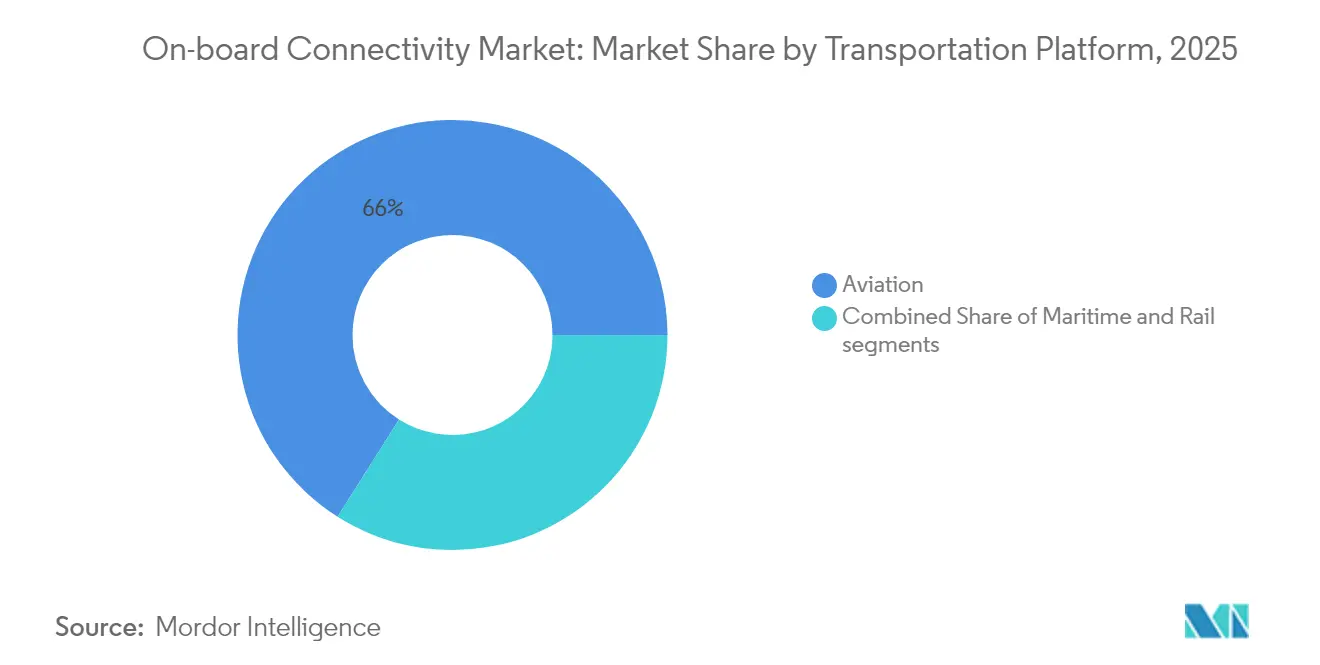
Aviation captured 66.02% of 2025 spending, maintaining primacy in the onboard connectivity market. Rail’s 13.12% CAGR to 2031 signifies rapid catch-up as high-speed projects specify gigabit-class internet from day one. The onboard connectivity market size attached to rail is forecast to widen throughout Asia-Pacific megaprojects.
Caltrain’s 10 Gbps rail-5G trial in California shows how regional operators transform trains into rolling offices. Lufthansa Group selected Viasat for 150 aircraft retrofits, integrating multi-orbit routing in aviation. Maritime players expand connectivity for crew and IoT sensors, with cruise lines finalizing fleet-wide Starlink coverage. UAV operations extend addressable demand, as FCC rules now permit direct spectrum assignments in 5030-5091 MHz for command-and-control links.
By Application: Safety Operations Gain Momentum Beyond Entertainment Focus
Entertainment cornered 46.30% of 2025 revenue, anchored in streaming, gaming, and social media. Safety and operations services, however, are rising at 12.22% CAGR because regulators and operators seek real-time data flows that minimize incidents and amplify efficiency.
Cyberattacks on aviation networks jumped 131% between 2022 and 2023, intensifying the emphasis on encrypted channels and resilient architectures. Predictive-maintenance sensors stream engine and brake analytics to cloud platforms, supporting cost-effective scheduling. Autonomous vessel navigation and UAV traffic management require deterministic latency that only multi-orbit networks can assure. Communication tools like voice and video conferencing ride on the same secure backbone, enabling mobile productivity across modes.
Geography Analysis
North America’s 41.30% share in 2025 demonstrates the region’s early embrace of LEO services, policy clarity, and significant airline upgrade budgets. Gogo’s Galileo solution for business aviation highlights demand for globally roaming multi-orbit capability. Federal funding of USD 8.2 billion toward Amtrak’s Northeast Corridor accelerates station-to-train Wi-Fi projects. Gulf of Mexico energy assets rely on Tampnet subsea fiber combined with AT&T 5G for offshore coverage.
Asia-Pacific is growing at 12.74% CAGR, powered by USD 43 trillion of infrastructure investment demands through 2035. ASEAN economic-integration plans position digital connectivity as foundational, fostering uniform passenger expectations. High-speed rail in China, Japan, and India embeds multi-gigabit links from design, avoiding retrofit delays. Shipping lines in Singapore retrofit fleets with hybrid terminals that auto-switch between LEO and GEO. The region’s young demographic accelerates the adoption of connected entertainment and e-commerce during travel.
Europe maintains steady growth through Trans-European Rail Network expansions and North Sea renewable projects that require robust offshore links. The Starline blueprint for continent-wide rail coverage underlines the European Commission's commitment to seamless roaming. The UK has agreed a public-private deal to eradicate mobile dead zones on main rail routes. Cruise and cargo operators integrate Ka-band capacity with legacy L-band safety channels, balancing redundancy with cost. Stricter data-protection laws oblige suppliers to embed advanced encryption as a default.

Regulatory Landscape
Certification and cyber resilience requirements are tightening as aircraft, ship, and rail networks become more externally connected. In the United States, FAA special conditions published in June 2026 for connected digital systems (including electronic system security protections against unauthorized external network access) add compliance work alongside existing installation and test guidance such as AC 20-168, and reinforce the need for security-by-design in onboard connectivity architectures.
In Europe, EASA has advanced information-security requirements through its easy access rules for EU information security regulations (Part-IS), while aircraft-level approvals continue to determine retrofit velocity. EASA certified Airbus Corporate Jets (ACJ320/ACJ320neo) for Gogo Galileo FDX in May 2026, and FAA/EASA Supplemental Type Certificate pathways broadened in June to July 2026 for Gogo Galileo HDX installations on platforms including Dassault Falcon 7X/8X and Gulfstream G650/G650ER. These approvals expand the addressable installed base for high-speed terminals, while keeping regulatory documentation, test evidence, and continuing airworthiness obligations as gating items in program schedules.
Value Chain Analysis
The onboard connectivity value chain spans satellite operators and capacity providers (GEO/MEO/LEO), ground infrastructure and network management platforms, onboard hardware (electronically steered antennas, radomes, modems/routers, access points), aircraft or vehicle integration (linefit and retrofit), and managed services (monitoring, cybersecurity, content and policy management). A key shift is the uncoupling of hardware selection from service contracts, enabling operators to pair terminals from specialized antenna suppliers with bandwidth and orchestration from service providers such as Viasat, SES, and Panasonic Avionics, while system integrators and MROs bridge certification, cabin integration, and operational readiness.
Airframers and catalog offerability increasingly shape go-to-market routes. Airbus supplier-furnished HBCplus supports both Ka- and Ku-band terminals, with multi-orbit Ku-band services tracking for 2026 availability, and industry reporting highlights Panasonic multi-orbit IFC progressing toward airframer linefit catalogs. On the supply side, constraints such as gallium-nitride (GaN) amplifier availability and elevated bandwidth costs can tighten lead times and push providers toward multi-sourcing. Regional ecosystem building is also taking shape through frameworks like the April 2026 agreement among TCI Aircraft Interiors, Turksat, and Neo Space Group to integrate GEO, MEO, and LEO networks for the Turkish aviation market.
Competitive Landscape
Competition intensifies as new-space entrants leverage vertically integrated LEO constellations to disrupt legacy GEO economics. Starlink’s retail pricing and direct-contract strategy place margin pressure on incumbents. In response, GEO operators pursue consolidation: the USD 500 million Intelsat-Eutelsat tie-up expands combined multi-orbit reach. Viasat’s completed Inmarsat purchase strengthens civil aviation channels and government contracts.
Technology differentiation now centers on software-defined networking, cybersecurity, and AI-driven traffic orchestration. Providers promote service-level guarantees that commit to ≥99.9% uptime across at least two constellations. White-space opportunities appear in UAV beyond visual line of sight, offshore energy IoT, and direct-to-device messaging, where regulatory frameworks evolve rapidly.
Patent activity is accelerating. The US and China lead invention filings on adaptive antennas and terahertz radios, signaling future competitive moats. Firms able to integrate ground infrastructure, orbital assets, and managed services under one brand are positioned to capture an outsized share once multi-orbit standards stabilize.
Onboard Connectivity Industry Leaders
Gogo Inc.
Thales Group
Viasat, Inc.
Panasonic Corporation
AT&T Inc.
- *Disclaimer: Major Players sorted in no particular order


Market Opportunities and Future Outlook
Multi-orbit inflight connectivity is creating whitespace for providers that can package terminals, orchestration software, and certification-ready integration into repeatable fleet programs. Airline selections and airframer partnerships in 2026 show this procurement shift: Delta Air Lines partnered with Airbus and Hughes in April 2026 to deploy multi-orbit connectivity on 20 A350-1000s with HBCplus integration, Air India selected Hughes for multi-orbit connectivity across multiple widebody types, and Jetstar selected Viasat AMARA for 11 Boeing 787 aircraft. These deals point to demand for managed, multi-network solutions that reduce operator burden as fleets add bandwidth-intensive passenger and operational applications.
Two additional opportunity areas are emerging from standardization and non-terrestrial 5G initiatives. The publication of IEEE/SAE AS6675 (time-sensitive networking for aerospace onboard Ethernet) in November 2025 supports more modular onboard data networks, aligning with supplier strategies to integrate connectivity with aircraft digital architectures. In parallel, Airbus UpNexts SpaceRAN demonstrator and related 5G NTN work (including a 5G physical layer supply contribution reported in February 2026) points to new onboard connectivity use cases that blend terrestrial and non-terrestrial networks, particularly where low-latency links and deterministic data flows matter for safety, maintenance telemetry, and future autonomous operations.
Recent Industry Developments
- July 2026: Frontier Airlines, backed by Indigo Partners, selected SpaceX Starlink for in-flight connectivity across its fleet as part of a multi-airline plan covering more than 1,000 aircraft. The move accelerates LEO-based IFC adoption in the low-cost carrier segment and raises the competitive bar for throughput and latency across incumbent satellite and hybrid providers.
- February 2026: Panasonic Avionics signed an MoU with Shanghai Spacesail Technologies to explore integrating Spacesails LEO constellation into Panasonics global in-flight connectivity network. The agreement broadens Panasonic Avionics optionality for multi-network service delivery and reflects growing interest in expanding LEO sourcing for global coverage.
- January 2026: Gogo confirmed the launch of its next-generation 5G air-to-ground connectivity network after completing installation and activation for its first revenue-generating customer in December 2025. Commercial availability of ATG 5G strengthens an alternative to satellite for specific routes and supports hybrid architectures that combine terrestrial links with multi-orbit satellite capacity.


Research Methodology Framework and Report Scope
Market Definition and Coverage
The on-board connectivity market covers hardware, software, and services that enable internet and data connectivity while a vehicle is in motion across aviation, maritime, and rail platforms. Revenues include connectivity equipment, integration, and ongoing service access used for passenger, crew, and operational applications.
Scope exclusions: Excludes off-board telecom infrastructure (such as ground network buildout, towers, and backhaul) and general consumer devices that are not sold as part of an onboard connectivity system.
Segmentation Overview
- By Component
- Hardware
- Antenna Systems
- Modems and Routers
- Wireless Access Points
- Solution
- Network-Management Platforms
- Content Management Systems
- Services
- Installation and Integration
- Managed Connectivity
- Support and Maintenance
- Hardware
- By Connectivity Technology
- Satellite
- Air-to-Ground (ATG)
- Hybrid/Multi-Orbit
- By Transportation Platform
- Aviation
- Commercial Airlines
- Business Jets
- Unmanned Systems
- Maritime
- Commercial Shipping
- Cruise and Ferry
- Offshore Energy
- Rail
- High-Speed
- Commuter and Metro
- Aviation
- By Application
- Entertainment
- Communication
- Safety and Operations
- Others
- By Geography
- North America
- United States
- Canada
- Mexico
- Europe
- Germany
- United Kingdom
- France
- Russia
- Rest of Europe
- Asia-Pacific
- China
- Japan
- India
- Australia
- Rest of Asia-Pacific
- South America
- Brazil
- Rest of South America
- Middle East and Africa
- Middle East
- United Arab Emirates
- Saudi Arabia
- Rest of Middle East
- Africa
- South Africa
- Rest of Africa
- Middle East
- North America
Data Sources, Market Sizing, and Validation
Desk Research
Desk work started with mapping the demand pool by platform and by region, then aligning it with what can be measured in public statistics. We referenced non-paywalled sources including the International Telecommunication Union for connectivity adoption context, the International Civil Aviation Organization for aviation activity indicators, the International Maritime Organization for maritime rules and safety framing, and the World Bank for macro and trade signals that influence fleet usage.
We also used regulatory and spectrum related updates from sources such as the US FCC, along with transport and rail sector publications from national transport ministries and industry association websites where available. Company filings, investor presentations, and trusted press releases were used to understand product mix, service attachment, and pricing direction, and then cross-checked with a paid subscription we use for company financials and news context, plus another one for patent lookups. These examples are not exhaustive, and many other public sources were reviewed to collect data points, validate assumptions, and clear up open questions.
Primary Interviews and Surveys
Primary validation was done through expert interviews and structured surveys with stakeholders across satellite and air to ground ecosystems, system integrators, transport operators, and selected channel partners. Because this is a global market, feedback was balanced across APAC, EMEA, and the Americas, so pricing, attach rate, and retrofit timing assumptions could be checked against real procurement and deployment patterns.
Distribution of primary research fieldwork respondents
| Company type | Respondent position | Region |
|---|---|---|
| Top tier: 37% | CXOs: 16% | APAC: 49% |
| Mid tier: 42% | Functional/Unit leaders: 39% | EMEA: 32% |
| Smaller Players: 21% | Managers: 45% | Americas: 19% |
Market-Sizing & Forecasting
For sizing, we used a top-down build where fleet activity and connected platform penetration are reconstructed by transportation mode and geography, then typical equipment and service revenue per connected unit are applied to reach the totals. The results were then compared against selective bottom-up checks, including sampled ASP times volume for key line items and channel level sense checks, so outliers could be corrected before finalizing the number.
Key inputs that moved the model included connected fleet growth by platform, installation mix between linefit and retrofit, service attach rates, bandwidth and coverage upgrades (including multi-orbit moves), and average revenue per user or per terminal depending on the platform. Where country data was thin, proxy indicators like passenger traffic, vessel calls, and rail ridership trends were used, then adjusted using interview feedback so the gap handling stayed realistic.
Forecasting relied mainly on scenario analysis supported by trend smoothing, since rollouts can jump when capacity expands or regulations and airline and operator policies shift. Each scenario was tied back to the same variables, and expert feedback was used to keep adoption speed and price progression within plausible ranges.
Data Validation & Update Cycle
Outputs were checked against independent signals such as fleet deliveries, upgrade cycles, connectivity subscription patterns, and public statements on capacity expansions, then the largest variances were reviewed by another analyst before sign-off. When a datapoint created a sudden jump, we re-checked the underlying assumption and, where needed, re-contacted respondents to confirm whether the change was temporary or structural.
The report is refreshed annually, and interim updates are triggered when material events occur, including major regulatory changes, large capacity announcements, or sharp pricing resets. Before delivery, a final review pass is completed so the latest public releases and confirmed interview learnings are reflected in the market numbers.
Mordor Intelligence's On Board Connectivity Market Size Measured Against Other Published Estimates
Published market sizes for on-board connectivity do not always match because the market can be counted in different ways, even when the topic name looks the same. The biggest differences usually come from what is included in revenues, the anchor year used, and how adoption and pricing are carried through the forecast period.
Off-board telecom infrastructure revenues sit outside Mordor Intelligence's scope, which reduces the total versus estimates that blend onboard equipment and service spend with wider network buildout and adjacent connectivity spending. Gaps can also come from mixing platform coverage, since some sources lean more heavily toward aviation alone, and from using aggressive bandwidth pricing declines without validating them against operator contract cycles and retrofit timing.
Benchmark comparison
| Source | Market Size | Gaps in Research Methodology |
|---|---|---|
| Mordor Intelligence | USD 12.32 B (2026) | |
| Industry Publisher A | USD 11.80 B (2025) | Uses a different anchor year and a longer forecast window, and the scope emphasis appears to lean more on software and service value pools, which can shift the mix and near-term total versus a platform-balanced model. |
| Trade Publisher B | USD 10.40 B (2024) | Reports a base-year figure that may include broader on-board connectivity spending assumptions across end uses and countries, and the gap can widen if inflation and currency timing are not aligned to the same pricing year. |
The spread in the table mainly reflects scope and timing choices, more than math errors. By keeping the revenue pool tied to onboard systems and service access, and by checking adoption and pricing assumptions with cross-region operator feedback, the final number stays traceable to clear demand indicators and repeatable steps.


Key Questions Answered in the Report
What is the current on-board connectivity market value?
The on-board connectivity market stands at USD 12.32 billion in 2026 and is forecasted to hit USD 20.73 billion by 2031.
Which transportation segment generates the most revenue?
Aviation leads with 66.02% of 2025 revenue, driven by widespread in-flight Wi-Fi adoption.
Why are hybrid multi-orbit networks gaining traction?
Hybrid networks combine GEO stability with LEO latency advantages, raising overall reliability and supporting real-time applications.
Which region is the fastest-growing market?
Asia-Pacific is expanding at a 12.74% CAGR, propelled by USD 43 trillion in infrastructure upgrades through 2035.
What are the main restraints on adoption?
Certification costs and stringent cybersecurity regulations add time and expense, especially for smaller operators.
How are airlines monetizing passenger Wi-Fi?
Advertising-supported models, enabled by high passenger willingness to view ads for free access, could unlock USD 30 billion in annual ancillary revenue by 2035.
Page last updated on:






