
Omega-3 Ingredients Market Size and Share
Market Overview
| Study Period | 2021 - 2031 |
|---|---|
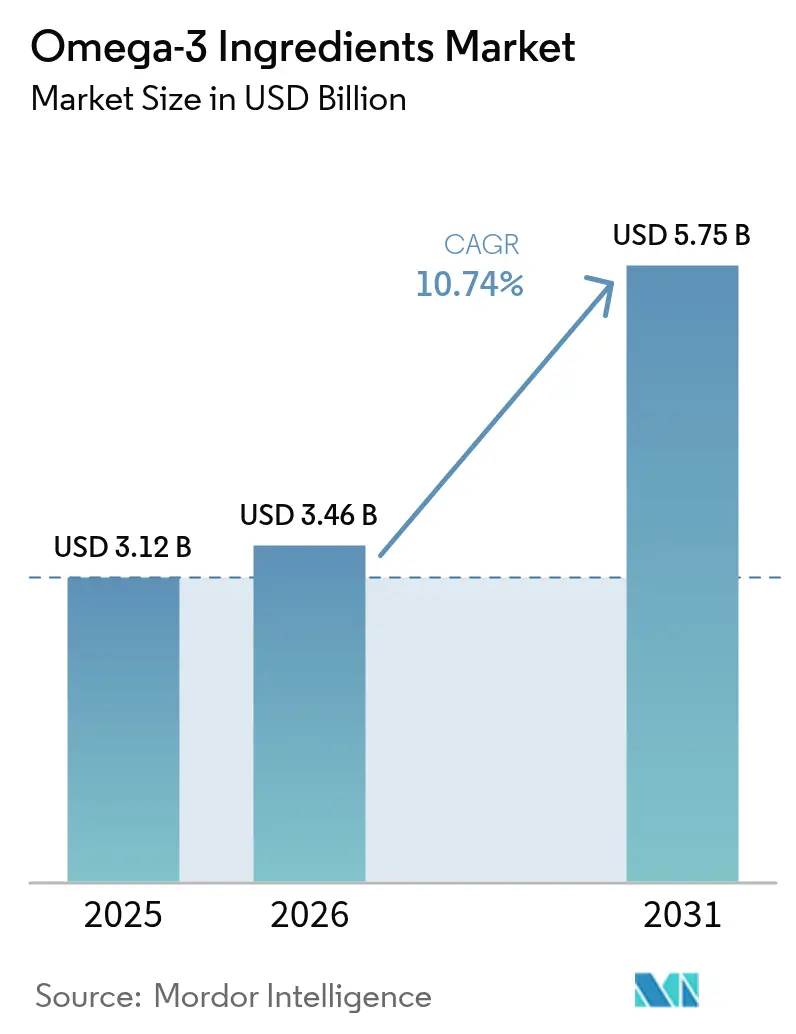
| Market Size (2026) | USD 3.46 Billion |
| Market Size (2031) | USD 5.75 Billion |
| Growth Rate (2026 - 2031) | 10.74 % |
| Fastest Growing Market | Asia-Pacific |
| Largest Market | North America |
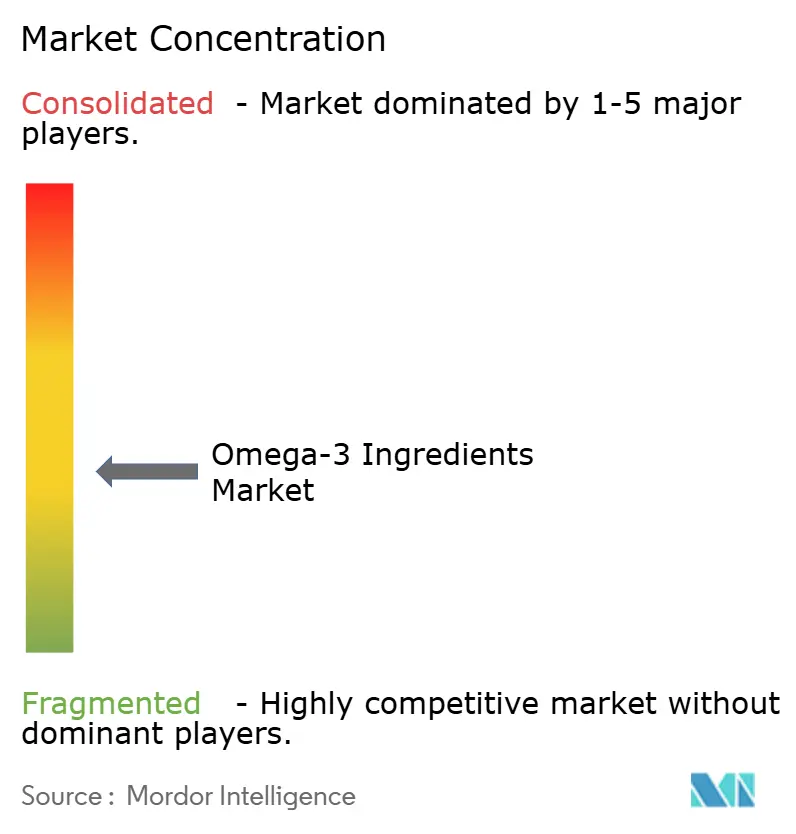
| Market Concentration | Medium |
Major Players *Disclaimer: Major Players sorted in no particular order Image © Mordor Intelligence. Reuse requires attribution under CC BY 4.0. | |
Omega-3 Ingredients Market Analysis by Mordor Intelligence
The omega-3 ingredients market size was valued at USD 3.12 billion in 2025 and estimated to grow from USD 3.46 billion in 2026 to reach USD 5.75 billion by 2031, at a CAGR of 10.74% during the forecast period (2026-2031). As global awareness of preventive health rises, so does the demand for omega-3 ingredients. Recognized for their benefits in cardiovascular, cognitive, and maternal wellness, EPA and DHA ingredients are increasingly being integrated into dietary supplements, functional foods, infant formulas, and clinical nutrition. This trend is further bolstered by the rapid expansion of aquaculture, which heightens the demand for omega-3–enriched feed ingredients to enhance fish quality and yield. Technological advancements, including high-purity concentration, micro-encapsulation, and algae-based extraction, are enhancing ingredient stability, absorption, and formulation flexibility. Moreover, sustainability initiatives and environmental regulations are driving a shift from marine-sourced to algae- and plant-based omega-3 ingredients, aligning with ecological goals and consumer preferences for clean-label products. As consumers increasingly gravitate towards natural and functional nutrition, omega-3 ingredients are finding their way into fortified foods, beverages, and dietary supplements. Regulatory endorsements and scientific validation of omega-3’s significance in maternal and infant health further bolster their demand in premium formulations. The rise of digital retail and personalized nutrition platforms is expanding ingredient accessibility and market visibility.
Key Report Takeaways
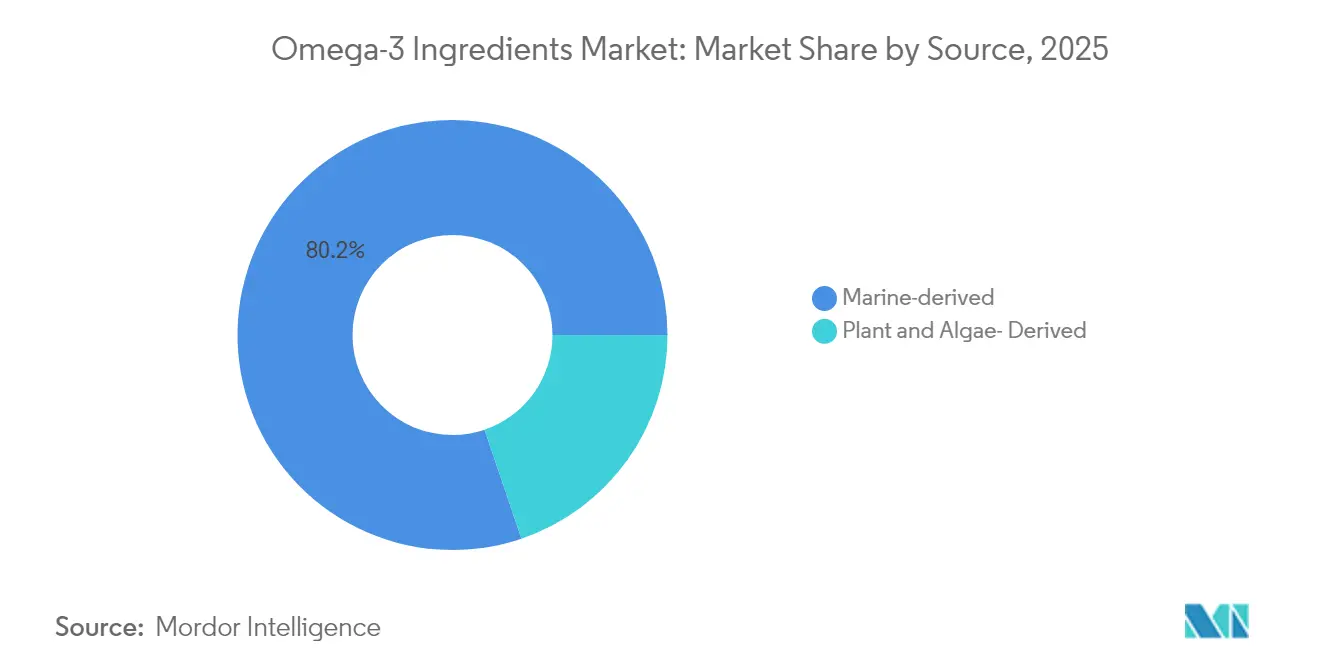
- By source, marine-derived products led with 80.20% of omega-3 market share in 2025; algae-derived inputs are projected to expand at a 9.62% CAGR through 2031.
- By form, oil formulations accounted for 68.95% of the omega-3 market size in 2025, while powder formats are advancing at an 11.25% CAGR to 2031.
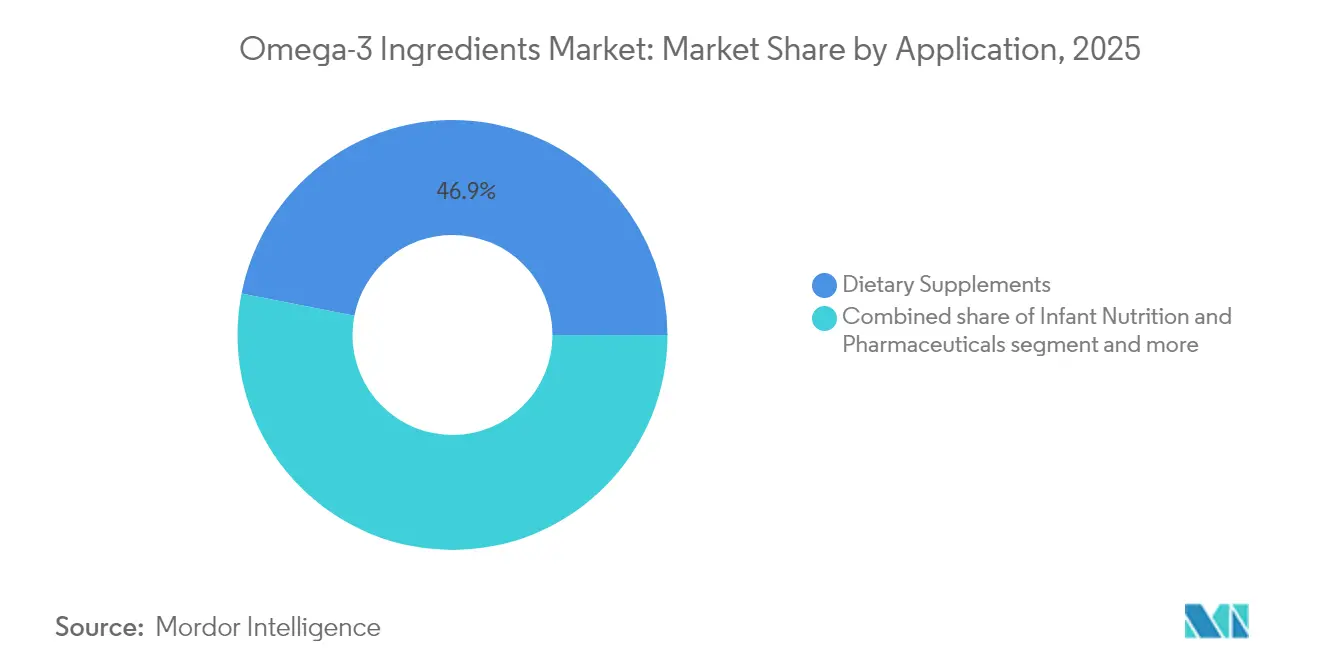
- By application, dietary supplements captured 46.90% revenue in 2025; infant nutrition shows the fastest trajectory with an 11.21% CAGR to 2031.
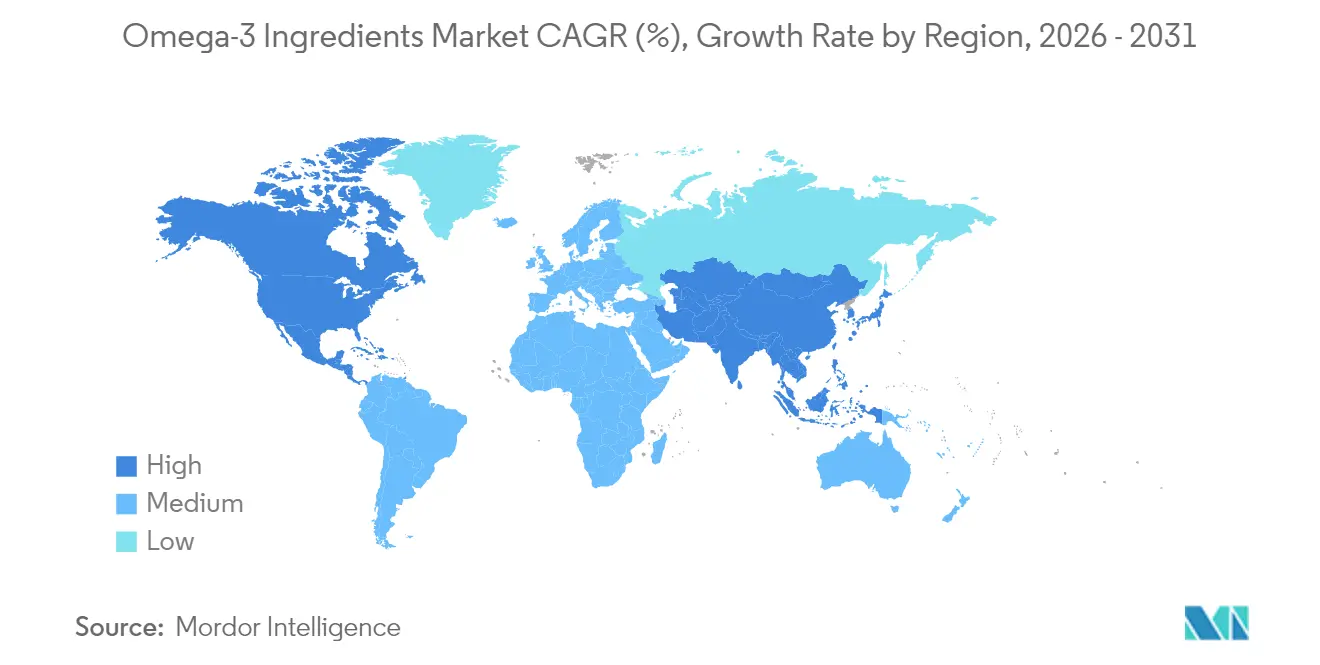
- By geography, North America held 34.55% of 2025 revenue, whereas Asia-Pacific is forecast to register a 9.62% CAGR through 2031.
Note: Market size and forecast figures in this report are generated using Mordor Intelligence’s proprietary estimation framework, updated with the latest available data and insights as of 2026.
Market Trends and Insights
Drivers Impact Analysis of Omega-3 Ingredients Market*
| Driver | (~) % Impact on CAGR Forecast | Geographic Relevance | Impact Timeline |
|---|---|---|---|
| Rising demand driven by aquaculture industry | +2.1% | Asia-Pacific core, global spillover | Medium term (2-4 years) |
| Increasing consumer spending on preventive healthcare products | +1.8% | Global, concentrated in North America and Europe | Short term (≤ 2 years) |
| Regulatory endorsements for EPA and DHA | +1.5% | North America and EU, widening to Asia-Pacific | Long term (≥ 4 years) |
| Maternal-health demand in pregnancy and child development | +1.3% | Global, early adoption in developed markets | Medium term (2-4 years) |
| Technological advancements in omega-3 extraction | +1.1% | Global, innovation hubs in Europe and North America | Long term (≥ 4 years) |
| Sustainable cultivation of algal sources | +0.9% | Global production in controlled environments | Long term (≥ 4 years) |
| Source: Mordor Intelligence | |||
Rising Demand Driven by Aquaculture Industry
As aquaculture expands, demand surges for omega-3-rich feed ingredients, bolstering the global omega-3 market. Global fisheries and aquaculture production have reached record highs, with aquaculture now leading in aquatic output, and a growing share of that output is directed towards human consumption. This shift prompts ingredient manufacturers to adjust their production and sourcing strategies to meet the feed industry's evolving demands. In response, major producers of fish oil and algae-based omega-3s are increasing capacities, especially for high-purity EPA and DHA formulations crucial for aquafeeds. Feed developers prioritize these omega-3s, acknowledging their importance in enhancing fish health, growth performance, and nutritional quality. With limited growth in capture fisheries, omega-3 suppliers are adopting sustainable sourcing methods, like using fish-processing by-products and cultivating algae, to meet industry demands. The rapid growth of aquaculture in Asia, particularly in China and Southeast Asia, boosts demand for omega-3s, not only in animal feed but also in human nutrition. This trend highlights aquaculture's shift from a niche sector to a dominant force, reshaping the omega-3 market and spurring innovations in sustainable sourcing and global expansion.
Increasing Consumer Spending on Preventive Healthcare Products
As consumers increasingly prioritize preventive healthcare, the global omega-3 ingredients market is witnessing a surge. More individuals now view omega-3 supplementation as a proactive wellness measure rather than a mere afterthought. In 2024, for instance, Oziva Plant-Based Omega 369 made its debut, catering to wellness enthusiasts with its vegan omega-3s. This move underscores formulators' responsiveness to the rising demand for plant-based preventive nutrition. Similarly, Nordic Naturals Omega 3 expanded its offerings with new daily wellness capsules, spotlighting heart and brain health in tune with evolving consumer perspectives. Ingredient companies are also innovating, with FrieslandCampina Ingredients introducing micro-encapsulated omega-3 powders for bakery and dairy fortification, paving the way for omega-3s to be integrated into everyday foods beyond traditional capsules. The surge in omega-3 adoption aligns with broader trends in healthcare spending. In the United States, health expenditure increased by 7.5% in 2023 to USD 4.9 trillion, marking one of the highest growth rates since 2003 [1]. This heightened focus on health investment underscores consumers’ willingness to allocate resources toward preventive measures, including omega-3 supplementation. Digital health apps and personalized nutrition platforms are further propelling this trend, offering customized omega-3 plans linked to biomarker monitoring and cognitive health outcomes. Sustainability-focused brands are also driving market growth by promoting algae-derived DHA/EPA blends as premium preventive-health options.
Rising Demand for Omega-3 in Maternal Health, Pregnancy, and Child Development
Clinical evidence increasingly supports omega-3 supplementation during pregnancy and early childhood, embedding these ingredients into standard prenatal and infant nutrition practices. In 2024, major infant formula brands, including Nestlé and Danone, launched updated formulations enriched with DHA and EPA, positioning these nutrients as essential for cognitive development. Similarly, prenatal supplement companies like Nature Made and Garden of Life introduced new capsules emphasizing daily DHA intake, aligning with updated clinical guidelines. These initiatives shape predictable demand for high-purity omega-3 ingredients, as prenatal care protocols integrate supplementation into maternal health programs, creating stable procurement channels for manufacturers. As per the American Hospital Association, in the United States, births grew by 1% in 2024 to reach 3.6 million, with the cesarean delivery rate slightly increasing to 32.4%, underscoring the ongoing focus on maternal and infant healthcare [2]. Early childhood development is further emphasized globally, as the World Health Organization and UNICEF report that an estimated 1 in 7 children aged 10 to 19 experience mental health conditions, with one-third of conditions emerging before age 14 and half before age 18 [3]. This highlights the critical importance of early nutritional interventions, including omega-3 supplementation, to support cognitive and behavioral development. This shift moves omega-3 from discretionary wellness spending to a medically endorsed ingredient, broadening its global market reach, stimulating investment in production, and accelerating adoption across supplements, functional foods, and infant nutrition categories, while directly addressing the growing need for early-life cognitive and mental health support.
Sustainable Cultivation of Algal-Based Omega-3 Sources
Algal-based omega-3 sources are sustainably cultivated, providing a scalable and eco-friendly alternative to traditional fish-derived oils. This shift is significantly boosting the global omega-3 ingredients market. In 2024, Veramaris, a leader in algal oil production, ramped up its output by 61% and simultaneously cut greenhouse gas emissions by 5.6%. This move underscores the feasibility of large-scale, low-impact production. In a similar vein, DSM-Firmenich showcased the rapid efficiency of algal cultivation. They pointed out that in controlled indoor systems, omega-3-rich oils can be harvested in just 25 days. This method promises a more sustainable and stable supply than its fish oil counterparts. Meanwhile, research initiatives like Germany's 'Algae EPA' project are delving into optimal microalgae strains and cultivation techniques to boost eicosapentaenoic acid (EPA) yields. Such advancements in sustainable production techniques are broadening market access, resonating with the rising consumer appetite for plant-based, clean-label, and ethically sourced omega-3 products. Consequently, algal-derived omega-3 ingredients are finding their way into dietary supplements, functional foods, and infant nutrition products, solidifying their role in the burgeoning omega-3 ingredients market.
Restraints Impact Analysis of Omega-3 Ingredients Market*
| Restraint | (~) % Impact on CAGR Forecast | Geographic Relevance | Impact Timeline |
|---|---|---|---|
| High cost of production | -1.4% | Global, amplified in price-sensitive regions | Short term (≤ 2 years) |
| Environmental concerns, including overfishing | -1.1% | Global, strong in developed markets | Medium term (2-4 years) |
| Raw-material price fluctuation | -0.8% | Global, heightened where sourcing is concentrated | Short term (≤ 2 years) |
| Regulatory complexities across regions | -0.6% | Global, fragmentation in emerging economies | Long term (≥ 4 years) |
| Source: Mordor Intelligence | |||
High Cost of Production
Global market growth for omega-3 ingredients, especially those derived from algae and premium fish oils, is being hampered by high production costs. In 2023, numerous manufacturers of supplements and infant formulas encountered production delays, attributing them to costly algae oil inputs. This surge in costs not only inflated the prices of fortified formulations but also restricted their reach in mainstream markets. Ingredient suppliers grappled with heightened expenses stemming from microalgae cultivation and the sophisticated extraction and purification processes. These processes are essential to ensure stability, purity, and adherence to regulatory standards. For instance, industry players like DSM-Firmenich and Corbion underscored that while striving for high-purity DHA/EPA production, they faced a notable spike in manufacturing costs. This was due to their commitment to sustainability and clean-label standards. Such cost pressures inevitably reflect in the prices of end products. This scenario poses a challenge for smaller supplement brands and developers of functional foods, hindering their competitiveness and slowing their market penetration, especially in price-sensitive regions. As demand for omega-3 ingredients surges, the industry is confronted with the challenge of high production costs. This has led to a concerted effort to seek out technological innovations and alternative sourcing strategies, aiming to enhance scalability and affordability without sacrificing quality.
Environmental Concerns, Including Overfishing
Environmental and sustainability pressures are increasingly constraining the omega‑3 ingredients market by limiting the availability of marine-derived raw materials and raising production risks. In 2023, several major supplement and food companies, including BASF and DSM, publicly announced the suspension of sourcing from certain fisheries after failing sustainability audits, highlighting the impact of stricter environmental scrutiny on supply chains. Regulatory agencies in Europe and North America have tightened fishing quotas for anchovies, sardines, and other small pelagic fish, forcing manufacturers to adjust production planning and incur higher costs to secure certified sustainable inputs. Consumer demand for ethically sourced ingredients is also influencing purchasing decisions, as brands relying solely on conventional marine oils face reputational risks in environmentally conscious markets. Climate-related shifts in fish migration and breeding cycles have compounded supply uncertainty, leading companies to diversify sourcing and invest in algae-based and other alternative omega-3 platforms. These constraints slow market expansion by increasing production costs, limiting raw-material availability, and creating barriers for smaller or less vertically integrated manufacturers, while companies that successfully adopt sustainable sourcing practices gain a competitive edge in capturing environmentally conscious consumers.
*Our forecasts treat driver/restraint impacts as directional, not additive. The impact forecasts reflect baseline growth, mix effects, and variable interactions.
Omega-3 Ingredients Market Segment Analysis
By Source:
Marine Dominance Faces Sustainable ChallengeMarine-derived omega-3 ingredients command a dominant 80.20% share of the global market, bolstered by established supply chains and consumer familiarity with fish oil products. Anchovy-based omega-3, the frontrunner in the marine segment, benefits from Peru's robust fishing industry, consistently delivering high volumes of EPA and DHA oils for dietary supplements and functional foods worldwide. Industry giants like BASF and DSM invest heavily in sourcing and refining marine oils, guaranteeing quality for large-scale production. While salmon-derived oils find premium applications in nutraceuticals and clinical nutrition, cod liver oil maintains a niche in traditional Northern European markets, aligning with historical consumption patterns.
Algae-derived omega-3 ingredients, boasting a CAGR of 9.62%, emerge as the fastest-growing segment, propelled by sustainability concerns and regulatory pressures to safeguard marine ecosystems. Veramaris, for instance, has scaled up the commercial production of high-purity DHA oils, catering to both global supplements and infant nutrition markets. Leveraging green algae for its high DHA yields, producers are differentiating products in preventive health formulations. Meanwhile, red algae is being investigated for its unique fatty acid profiles, and brown algae offers a versatile EPA-DHA ratio for general supplementation. Producers like Corbion are adopting closed-loop cultivation systems, enhancing scalability and consistency, and addressing the seasonal and environmental challenges of marine sources. These innovations, paired with a surge in sustainability-driven consumer demand, are propelling the adoption of algae-based ingredients, further enriching the already established marine-dominated market.

By Form:
Oil Formulations Lead Despite Powder InnovationIn 2025, oil formulations command a dominant 68.95% share of the global omega-3 ingredients market, bolstered by a robust manufacturing infrastructure and widespread consumer acceptance of traditional supplement formats. Their lead is further solidified by superior bioavailability and cost-effective production methods, enabling competitive pricing in both nutraceutical and pharmaceutical realms. Industry giants like BASF and Epax are continuously refining oil-based formulations, focusing on purity and shelf stability to ensure consistent global performance. The consumer's familiarity with this format further cements its prevalence in traditional capsules and softgels, solidifying its top position in ingredient demand.
Powder formulations are the market's fastest-growing segment, projected to expand at an 11.25% CAGR through 2031, due to their adaptability in functional foods and beverages. Innovations in microencapsulation technology have mitigated oxidation and taste issues, paving the way for integration into bakery, dairy, and infant nutrition. Companies such as DSM are harnessing spray-drying and fluid-bed coating techniques to bolster product stability and cut processing costs, enhancing the commercial viability of powder-based omega-3s. Concentrates, while occupying a niche, cater to the clinical and pharmaceutical sectors that demand heightened EPA and DHA potency. The swift uptake of powder formats underscores the industry's shift towards consumer preferences for taste-neutral, easily incorporable, and accurately dosed omega-3s.
By Application:
Supplements Dominate While Infant Nutrition AcceleratesIn 2025, dietary supplements command a dominant 46.90% share of the global omega-3 ingredients market. This stronghold is bolstered by entrenched consumer habits and widespread retail presence, establishing omega-3 as a vital health product. Direct-to-consumer marketing and endorsements from healthcare professionals, emphasizing benefits for cardiovascular, cognitive, and joint health, further cement this segment's leadership. Major players like BASF and DSM are broadening their portfolios with high-purity omega-3 formulations, focusing on enhanced bioavailability to cater to health-conscious consumers prioritizing preventive wellness. The segment's versatility shines through its adaptability to various formats—capsules, softgels, and gummies boosting accessibility and consumer appeal.
Infant nutrition is emerging as the fastest-growing segment, projected to expand at an 11.21% CAGR through 2031. This growth is fueled by increasing clinical endorsements of the' significance in early brain and visual development. In response, leading manufacturers like Nestlé and Danone are enriching their infant formulas with DHA-rich omega-3s to align with heightened nutritional benchmarks. Meanwhile, functional foods and beverages are witnessing a surge, owing to advancements in microencapsulation and flavor masking, ensuring seamless product integration without sacrificing taste or shelf life. Clinical nutrition remains a lucrative avenue, with omega-3s being pivotal in specialized therapeutic diets. Additionally, the pharmaceutical sector continues to drive demand for premium, prescription-grade omega-3 formulations. This diversification across various applications is steadily expanding the market's base beyond just dietary supplements, spurring innovation and fortifying resilience in both consumer and clinical nutrition realms.
Geography Analysis
North America Omega-3 Ingredients Market
In 2025, North America commands a dominant 34.55% share of the global omega-3 ingredients market. This leadership is bolstered by mature regulatory frameworks, an advanced healthcare system, and a populace well-versed in health matters. Preventive healthcare practices are deeply ingrained in the region, with medical professionals widely endorsing omega-3 supplements as integral to dietary guidelines. In the U.S., FDA-sanctioned health claims, coupled with insurance backing for specific clinical applications, fuel robust demand in both consumer and clinical nutrition arenas. Meanwhile, Canada's efficient regulations on natural health products pave the way for innovative formulations and labeling. This enables firms to promote specialized omega-3 offerings, underscoring their validated health advantages.
APAC Omega-3 Ingredients Market
Asia-Pacific is on a rapid ascent, projected to grow at a 9.62% CAGR through 2031. This surge is largely attributed to swift advancements in aquaculture and a burgeoning awareness of health among consumers. China is at the forefront, bolstering its aquaculture supply chain while nurturing a growing appetite for fortified foods and supplements. Japan, with its aging population, shows a pronounced preference for cognitive health products, driving steady demand for premium DHA formulations. Concurrently, India's burgeoning nutraceutical industry and robust pharmaceutical sector present lucrative avenues for cost-effective omega-3 production. Australia and Singapore are carving out roles as pivotal distribution and innovation centers for algae-derived omega-3s, signaling a regional pivot towards sustainable sourcing and localized production.
EMEA and South America Omega-3 Ingredients Market
Regions like Europe, South America, and the Middle East and Africa are witnessing steady growth, albeit at a more tempered pace, influenced by varying regulatory landscapes and market maturity. Europe's market trajectory is shaped by the European Food Safety Authority's stringent quality benchmarks and a pronounced emphasis on sustainability, which in turn fuels algae-centric innovations. South America's advantage lies in its closeness to marine resources, notably Peru's anchovy fisheries. Countries like Brazil and Argentina are gradually amplifying domestic consumption, primarily through initiatives centered on fortified foods. In the Middle East and Africa, while public health initiatives and collaborations with global nutrition entities are broadening awareness and accessibility, the fragmented nature of distribution networks poses challenges to wider market reach.
Regulatory Landscape
Omega-3 ingredients for foods, supplements, and infant nutrition operate within a multi-regulator framework covering ingredient authorization, safety substantiation, and claims and label controls. In the United States, algal and other omega-3 ingredient use commonly follows the FDA GRAS pathway, and the agency maintains an active inventory of GRAS notices for omega-3 ingredients (including algal oils). In the United Kingdom, omega-3 oils from specific microalgae strains fall under the novel foods regime (assimilated from Regulation (EU) 2015/2283), where strain- and specification-based assessments apply to changes in conditions of use. The UK Food Standards Agency completed a safety assessment in February 2026 for a change of conditions of use for Schizochytrium sp. oil rich in DHA and EPA (RP2180), revising the minimum DHA level to 15.0%.
In the European Union, EFSA continues to shape market access through scientific opinions and dossier expectations for new uses, specifications, and food additive-related submissions. Updated EU food additive guidance adopted in November 2025 becomes applicable from 20 July 2026, affecting how companies prepare and submit supporting data for new applications. Alongside regional regimes, Codex Alimentarius work on standards for microbial omega-3 oils (including microalgae-derived EPA and DHA) supports harmonization of identity and quality parameters used in cross-border trade, which is increasingly relevant as algae-derived omega-3 expands beyond supplements into food and beverage fortification.
Value Chain Analysis
The omega-3 ingredients value chain starts with upstream lipid sources, led by marine raw materials such as Peruvian anchovy, alongside alternatives including microalgae cultivation and fermentation, krill, and plant-derived oils. Marine inputs are harvested and rendered into crude fish oil, followed by refining and concentration steps such as winterization, deodorization, molecular distillation, and EPA/DHA concentration conducted in specialized hubs and by integrated players. Companies active across refining, concentration, and branded ingredient supply include dsm-firmenich, BASF, Pelagia, and Aker BioMarine, supplying finished oils, concentrates, and microencapsulated powders to dietary supplement brands, infant formula manufacturers, functional food producers, clinical nutrition players, pharmaceuticals, and pet food and animal feed formulators.
Midstream and downstream stages add value through stabilization and delivery formats, particularly microencapsulation and powder systems designed to improve oxidative stability and ease of use in foods and beverages. Bottlenecks are closely tied to marine dependence, since quota changes, climate variability, and logistics requirements (including cold chain, nitrogen blanketing, and oxidation control) can tighten availability and raise costs. In turn, buyers adjust procurement strategies, and suppliers respond with diversification and inventory strategy shifts, supported by more strategic raw-material stockpiling and broader qualification of crude oil sources. Alternative platforms such as microalgae can reduce seasonality and support more predictable input specifications for high-purity EPA/DHA applications.
Competitive Landscape
The omega-3 ingredients show a moderate competitive landscape where top players stand out through robust branding, strategic certifications, and a focus on consumer-centric marketing. Companies like DSM-Firmenich and BASF are steering their omega-3 offerings towards clean-label and halal-certified formulations, aiming to resonate with a wider audience, especially in the Middle East and Southeast Asia. These companies spotlight traceability, sustainability, and ethical sourcing in their marketing, using certifications such as halal, non-GMO, and sustainable fishery standards to foster consumer trust. Meanwhile, emerging brands are carving out niche markets on digital platforms, emphasizing personalized nutrition and transparent labeling to engage health-conscious consumers who prioritize authenticity and functional benefits in their supplements.
Technological prowess is a key determinant of market competitiveness, with established players pouring resources into innovations that bolster ingredient functionality and stability. DSM-Firmenich is at the forefront, championing microencapsulation technology to enhance oxidation resistance and prolong shelf life for food and beverage uses. BASF and Epax Norway are refining purification and concentration methods to boost EPA and DHA yields, targeting premium markets like clinical nutrition.
On the strategic front, the market is seeing a wave of consolidation and collaboration, with companies eyeing vertical integration and global outreach. Major players are forging long-term alliances with sustainable fisheries and algae growers, ensuring a steady raw material flow amidst environmental and regulatory challenges. Noteworthy mergers, like DSM's union with Firmenich, spotlight a trend towards crafting comprehensive value chains that meld ingredient innovation with keen consumer insights and robust distribution. The push into burgeoning markets in Asia-Pacific and the Middle East is gaining momentum, with industry leaders setting up joint ventures and local production hubs to navigate regional regulations and secure halal certifications. These strategic undertakings bolster global competitiveness, ensuring both supply stability and market agility.
Omega-3 Ingredients Industry Leaders
-
Cargill Inc.
-
Archer Daniels Midland Company
-
BASF SE
-
DSM-Firmenich AG
-
Croda International Plc
- *Disclaimer: Major Players sorted in no particular order
Omega-3 Ingredients Market Companies Covered in this Report
- DSM-Firmenich
- BASF SE
- Croda International Plc
- Aker BioMarine ASA
- Cargill, Incorporated
- GC Rieber VivoMega AS
- Golden Omega S.A.
- KD Pharma Group SA
- Pelagia AS
- Polaris SA
- Stepan Company
- Corbion N.V.
- Archer Daniels Midland Company
- Veramaris Inc.
- Nufarm Limited
- Solutex GC SL
- Kerry Group Plc
- Fermentalg SAS
- Arctic Nutrition AS
- Novotech Nutraceuticals Inc.
Market Opportunities and Future Outlook
A primary opportunity is accelerating the shift from wild-caught marine oils toward algae-based and fermentation-derived EPA/DHA, which better aligns with sustainability commitments and supply stability needs across supplements, infant nutrition, and feed. One clear signal is Holland & Barrett completing the withdrawal of krill-based products from its shelves in April 2026, tightening the focus on non-krill omega-3 sourcing and increasing the practical value of algal DHA/EPA for brands positioning fish-oil substitution. On the supply enablement side, GOED launched a Supply Chain Navigator tool in April 2026 to help brands identify and connect with a wider set of omega-3 crude oil suppliers, reflecting ongoing efforts to broaden sourcing options amid volatility.
Investment in capacity and processing capability is also expanding the menu of high-purity and application-specific formats. Recent commissioning and build-outs, including Natac starting up an omega-3 production facility in As Somozas, Spain (10,000 tonnes per year capacity, launched in September 2024), Naturmega opening a supercritical fluid fractionation facility in Barranquilla, Colombia (launched September 2025, targeting up to 80% EPA/DHA concentrates), and MiAlgae breaking ground in December 2025 on a modular algal omega-3 facility in Grangemouth, Scotland (using whisky by-products), show increased focus on purification intensity and circular-economy feedstocks. With continued fish-oil supply uncertainty (including Epax implementing stockpiling and multi-origin sourcing measures in June 2026), formulation demand is moving toward ingredients with stronger sensory performance and stability, reinforcing uptake of microencapsulated powders in functional foods and specialized concentrates for clinical nutrition and premium prenatal and infant formulations.
Recent Industry Developments in Omega-3 Ingredients Market
- April 2026: dsm-firmenich launched Veramaris O3 Max Pure, positioned as an algal omega-3 ingredient that can replace fish oil in pet food formulations. The launch expands algae-derived omega-3 options in a high-volume application where sustainability narratives and supply continuity influence brand sourcing and formulation choices.
- September 2025: BASF and Louis Dreyfus Company completed the transaction for BASF's Food and Health Performance Ingredients business, which included omega-3 oils for human nutrition. The close shifts ownership of established omega-3 ingredient assets to a commodity and ingredients supply-chain player, reshaping competitive positioning and potential integration with global origination and distribution networks.
- October 2024: dsm-firmenich expanded its advanced life’s portfolio with life’sDHA B54-0100, an algal DHA oil specified at 545 mg DHA and 80 mg EPA per gram. This higher-potency profile supports dose-efficient formulations and broadens options for supplement and infant nutrition manufacturers seeking strong sensory performance with algae-based sourcing.
Omega-3 Ingredients Market Report Scope and Research Methodology
Market Definition and Coverage
This market covers omega-3 ingredients sold as inputs to make finished products, mainly oils, concentrates, and powders that deliver ALA, EPA, and DHA for human nutrition and select animal uses, across major regions.
Scope exclusions: Excludes retail sales of branded finished supplements and foods, and excludes non-omega fatty acids and unrelated lipid ingredients.
Segments Covered in This Report
- By Source
- Marine-derived
- Anchovy
- Cod Liver
- Menhaden
- Tuna
- Sardine
- Salmon
- Other Species
- Plant and Algae- Derived
- Green Algae
- Red Algae
- Brown Algae
- Blue-Green Algae
- Marine-derived
- By Form
- Oil
- Concentrates
- Powder
- By Application
- Dietary Supplements
- Functional Food and Beverage
- Infant Nutrition
- Clinical and Medical Nutrition
- Pharmaceuticals
- Pet Food and Animal Feed
- By Geography
- North America
- United States
- Canada
- Mexico
- Rest of North America
- Europe
- Germany
- United Kingdom
- Italy
- France
- Spain
- Netherlands
- Poland
- Belgium
- Sweden
- Rest of Europe
- Asia-Pacific
- China
- India
- Japan
- Australia
- Indonesia
- South Korea
- Thailand
- Singapore
- Rest of Asia-Pacific
- South America
- Brazil
- Argentina
- Colombia
- Chile
- Peru
- Rest of South America
- Middle East and Africa
- South Africa
- Saudi Arabia
- United Arab Emirates
- Nigeria
- Egypt
- Morocco
- Turkey
- Rest of Middle East and Africa
- North America
Data Sources, Market Sizing, and Validation
Desk Research
Desk work started by mapping the supply chain from raw material sourcing through refining and concentration, and then linking that supply to end use demand signals. We relied on public, non-paywalled sources such as FAO fisheries statistics, UN Comtrade trade data, the US FDA and NIH fact sheets around omega-3 nutrition, and EFSA scientific opinions that influence labeling and formulation choices.
To keep the numbers grounded, company filings, investor presentations, annual reports, and reputable press were reviewed for capacity additions, feedstock constraints, and product mix shifts across oil, concentrates, and powder formats. Select paid subscriptions were also used for company financials and intelligence, patent lookups around concentration and stabilization methods, and shipment-level import and export checks where available. These examples are not exhaustive, and many other sources were referenced for data collection, validation, and research clarification.
Primary Interviews and Surveys
Primary work included interviews and surveys with ingredient manufacturers, distributors, contract processors, and downstream formulators across dietary supplements, functional foods, infant nutrition, and animal nutrition. Inputs were used to confirm pricing bands, typical concentration mixes (EPA vs DHA vs ALA), adoption trends for algae and plant sources, and how regulatory and labeling requirements change demand by region.
Distribution of primary research fieldwork respondents
| Company type | Respondent position | Region |
|---|---|---|
| Top tier: 28% | CXOs: 12% | APAC: 52% |
| Mid tier: 52% | Functional/Unit leaders: 29% | EMEA: 29% |
| Smaller Players: 20% | Managers: 59% | Americas: 19% |
Market-Sizing & Forecasting
Sizing was built using a top-down structure where production, trade, and downstream usage indicators are reconstructed into an ingredients revenue pool by form and application. The model is then checked with selective bottom-up approximations such as sampled supplier revenue splits, distributor channel checks, and ASP multiplied by estimated volumes for key ingredient types, which helps us adjust totals when gaps show up.
Key inputs used in the model included fish oil and algae oil availability trends, import and export flows for relevant oils and concentrates, application-level demand shares across supplements and fortified foods, typical potency and concentration ranges that influence price per kilogram, and observed pricing progression for oil versus concentrate formats. When a country has limited public reporting, values were bridged using regional ratios tied to consumption signals, trade dependency, and interview-based adoption rates. Forecasts were produced using scenario analysis supported by short series trend smoothing, where assumptions for raw material availability, price normalization, and application penetration are varied and then aligned to expert consensus.
Data Validation & Update Cycle
Validation is done by comparing outputs against independent signals such as trade flows, major capacity announcements, and application demand markers, and then reviewing any large variances before sign-off. If a key assumption moves materially, such as a sustained shift in fish oil pricing or a step-change in algae capacity, we re-contact industry participants to confirm the impact on pricing and mix.
Each report is refreshed annually, with interim updates when major events change supply or demand expectations. Before delivery, a final analyst pass is completed so clients receive an updated view that reflects the latest public data and confirmed market signals.
Mordor Intelligence's Omega 3 Ingredients Market Estimate Compared With Other Published Estimates
Published market sizes for omega-3 ingredients can differ even when the topic name looks the same, because the included ingredient types, end uses, and time periods are not always consistent. Differences also come from how firms treat average selling prices, currency timing, and whether the estimate is anchored on supply signals, demand signals, or a mix of both.
The table shows a noticeable spread because some sources focus only on EPA and DHA oils for human applications, while others may fold in broader ingredient types or include animal nutrition more explicitly. It also depends on whether the model uses a single blended price for all omega-3 formats or separates oil, concentrates, and powders, since concentration levels typically shift the value more than the volume changes.
Benchmark comparison
| Source | Market Size | Gaps in Research Methodology |
|---|---|---|
| Mordor Intelligence | USD 3.46 B (2026) | |
| Industry Association A | USD 2.38 B (2024) | Narrower scope centered on EPA and DHA ingredient value used in defined finished product applications, which can exclude ALA-based ingredients and parts of the animal feed chain, and it is also reported for an earlier year. |
| Global Publisher B | USD 3.40 B (2025) | Reported year and forecast window differ, and the estimate can move depending on whether pricing is blended across sources and forms or separated by oil versus concentrates, which changes the implied ASP progression. |
The table points to scope and timing as the biggest drivers, and in Mordor Intelligence's model the total includes omega-3 ingredients across marine, plant, and algae sources and separates value by form and application before regional roll ups are finalized. With these steps, we are able to explain each major assumption in plain terms, which helps users reconcile why two credible looking numbers can still land apart.
Key Questions Answered in the Report
How large is global demand for omega-3 in 2026?
The omega-3 market size reached USD 3.46 billion in 2026, with strong momentum toward USD 5.75 billion by 2031.
Which omega-3 source grows fastest through 2031?
Algae-derived oils show the highest growth at a 9.62% CAGR as buyers prioritize sustainability and supply security.
Why are powder formulations gaining popularity?
Microencapsulation allows powders to blend into foods without taste or odor, driving an 11.25% CAGR in this form segment.
Which region leads omega-3 consumption today?
North America held 34.55% of global revenue in 2025, supported by supportive regulation and consumer education.