
Market Overview
| Study Period | 2020 - 2031 |
|---|---|
| Forecast Data Period | 2026 - 2031 |
| Base Year Market Size (2025) | USD 2.70 Billion |
| Market Size (2026) | USD 2.86 Billion |
| Market Size (2031) | USD 3.8 Billion |
| Growth Rate (2026 - 2031) | 5.88 % |
| Market Concentration | High |
Major Players *Disclaimer: Major Players sorted in no particular order Image © Mordor Intelligence. Reuse requires attribution under CC BY 4.0. | |
Oman Telecom MNO Market Analysis by Mordor Intelligence
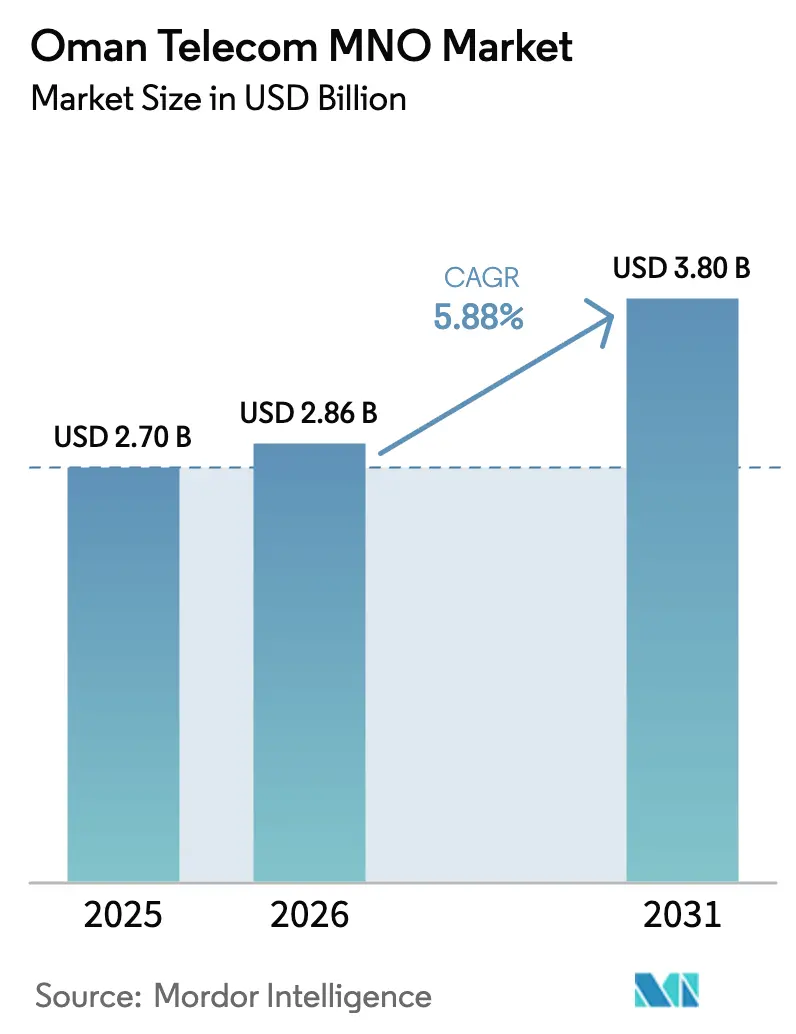
The Oman Telecom MNO Market size was valued at USD 2.70 billion in 2025 and estimated to grow from USD 2.86 billion in 2026 to reach USD 3.80 billion by 2031, at a CAGR of 5.88% during the forecast period (2026-2031).
This uptrend is propelled by nationwide 5G rollouts, Oman's emergence as a Gulf submarine-cable hub, and Vision 2040’s USD 442 million digital-economy program. Enterprise digitalization, a 134% mobile-penetration rate, and licensing of Starlink for rural back-haul further magnify data traffic. Competition within the three-player oligopoly has sharpened since Vodafone’s 2022 launch, raising network-performance benchmarks and service-bundling innovations. Sustained wholesale revenues from more than 20 submarine cables and four terrestrial links provide an added earnings buffer for operators.
Key Report Takeaways
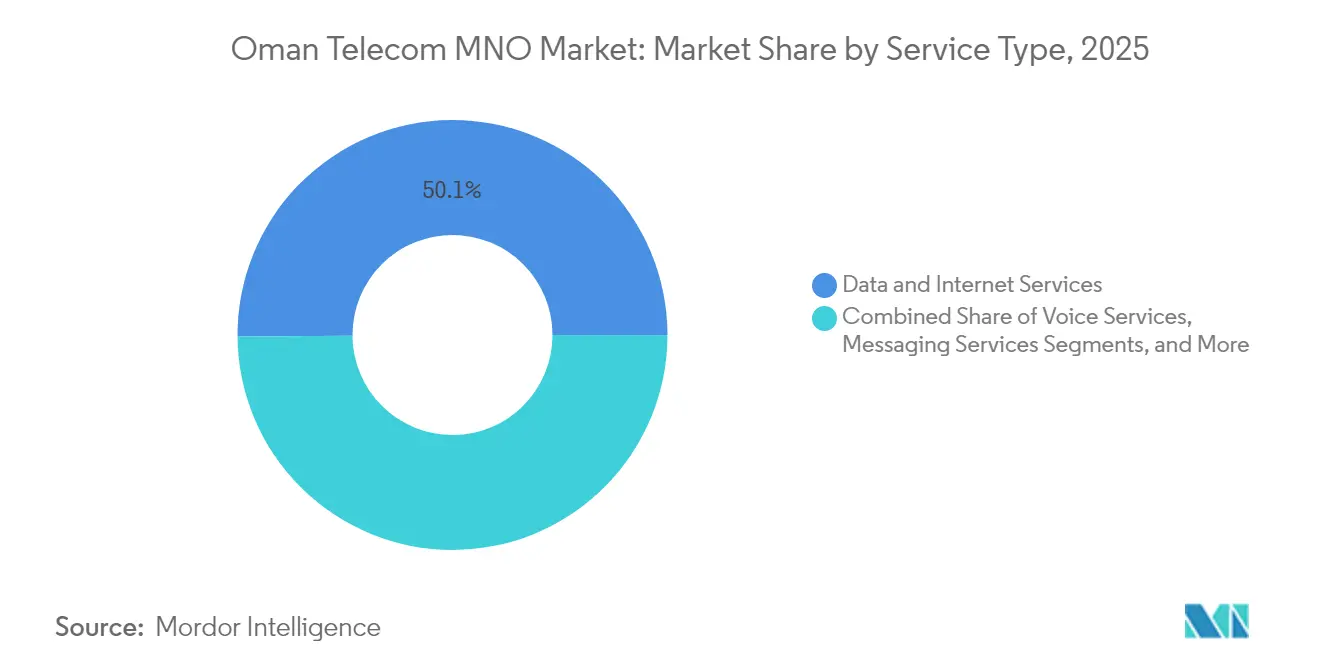
- By service type, data and internet services led with 50.12% of Oman telecom MNO market share in 2025; IoT and M2M services are advancing at a 5.99% CAGR through 2031.
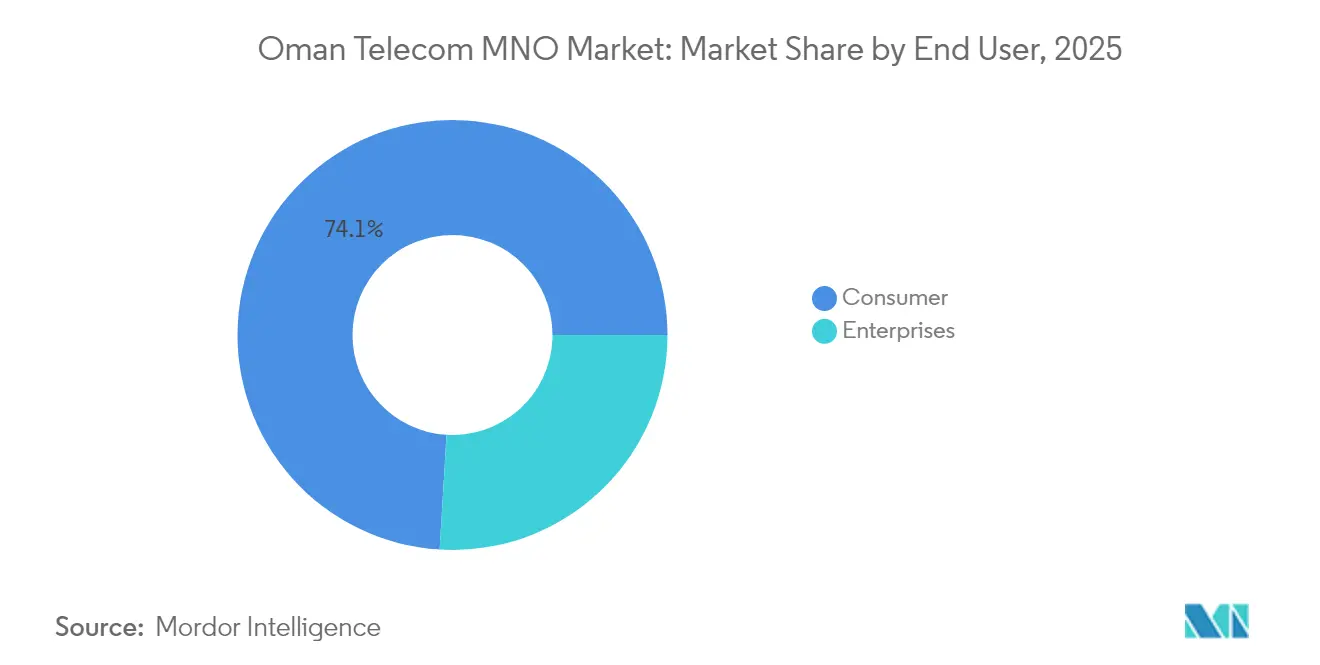
- By end user, the consumer segment held 74.05% of the Oman telecom MNO market size in 2025, while the enterprise segment is forecast to expand at a 6.26% CAGR to 2031.
Note: Market size and forecast figures in this report are generated using Mordor Intelligence’s proprietary estimation framework, updated with the latest available data and insights as of 2026.
Oman Telecom MNO Market Trends and Insights
Drivers Impact Analysis*
| Driver | (~)% Impact on CAGR Forecast | Geographic Relevance | Impact Timeline |
|---|---|---|---|
| 5G rollout and surging data traffic | +1.8% | Muscat, Salalah, Sohar | Medium term (2-4 years) |
| Vision 2040 digital-economy investments | +1.2% | SEZs and smart-city zones nationwide | Long term (≥ 4 years) |
| Rising smartphone and internet penetration | +0.9% | Rural uplift through satellite backhaul | Short term (≤ 2 years) |
| Oman as Gulf submarine-cable hub | +0.7% | National with regional spillovers | Long term (≥ 4 years) |
| Starlink license enabling rural backhaul | +0.5% | Mountainous and desert districts | Medium term (2-4 years) |
| Tourism-driven seasonal roaming boost | +0.3% | Muscat, Salalah, Nizwa, coastal resorts | Short term (≤ 2 years) |
| Source: Mordor Intelligence | |||
5G Rollout and Surging Data Traffic
All three operators have launched commercial 5G, lifting down-link speeds to 252.3 Mbps on Omantel’s network and pushing consumers toward higher-value plans. Vodafone’s Ericsson-built greenfield network achieved a 95% Omanization rate, accelerating skills transfer and localized maintenance [1]Ericsson, “Vodafone Oman’s 5G Network Deployment,” ericsson.com. The sunset of 3G networks in 2024 forced subscribers onto 4G and 5G, widening ARPU and opening fixed-wireless-access prospects for logistics hubs in Sohar and Duqm. Enterprise IoT adoption now outpaces consumer uptake, with use cases in smart metering and port automation catalyzing incremental revenue. Data-traffic momentum underpins the projected 1.8-percentage-point uplift in overall CAGR.
Vision 2040 Digital-Economy Investments
The Ministry of Transport, Communications, and Information Technology earmarked USD 442 million for digital transformation, spawning AI pilots and national accessibility standards for apps and websites [2]Ministry of Transport, Communications and Information Technology, “Digital Transformation Programs,” mtcit.gov.om. SEZ developments at Duqm and Sohar require dedicated 5G campus networks, while the government’s goal to elevate logistics to global-top-ten status by 2040 deepens infrastructure demand. The country’s ICT sector is valued at USD 5.47 billion in 2025 and is projected to almost double by 2029, reinforcing the +1.2% CAGR impact.
Rising Smartphone and Internet Penetration
Mobile penetration reached 134% by mid-2024, translating into 5.02 million active internet users and 4.39 million social-media accounts. The e-commerce market is on track to double to USD 1.1 billion by 2028, bolstering demand for mobile payments and digital-banking platforms. Rural coverage is improving through satellite licensing for Starlink and OmanSat, ensuring inclusivity and adding 0.9 percentage points to forecast growth. High smartphone adoption also fuels OTT video, music, and gaming traffic, spurring network-capacity upgrades.
Oman as Gulf Submarine-Cable Hub
Hosting more than 20 subsea systems, including the 2Africa and Al Khaleej cables, Oman enjoys unmatched route diversity and wholesale dominance [3]TelecomTalk, “Ooredoo to Land 2Africa Subsea Cable in Oman,” telecomtalk.info. Omantel maintains 100+ international interconnects, and Equinix’s Salalah data center, launched in November 2024, offers carrier-neutral colocation to hyperscalers. These assets secure stable wholesale margins, lifting the growth forecast by 0.7%. The country’s status attracts regional cloud deployments and deepens roaming-partner ties with 700 networks across 200 countries.
Restraints Impact Analysis*
| Restraint | (~)% Impact on CAGR Forecast | Geographic Relevance | Impact Timeline |
|---|---|---|---|
| 12% royalty on telecom revenues | -1.4% | Nationwide | Long term (≥ 4 years) |
| Saturated mobile-subscriber base | -0.8% | Urban markets | Medium term (2-4 years) |
| OTT revenue leakage to foreign platforms | -0.6% | Voice and messaging nationwide | Short term (≤ 2 years) |
| Spectrum-refarming delays for 6G | -0.4% | Nationwide | Long term (≥ 4 years) |
| Source: Mordor Intelligence | |||
12% Royalty on Telecom Revenues
A uniform 12% levy on gross telecom income caps reinvestment potential and constrains price flexibility. The burden, higher than neighboring GCC norms, forces cost-rationalization measures such as Omantel’s migration of 200 products to a cloud-native charging platform. Vodafone’s asset-light model and Ooredoo’s operational-efficiency drive partly offset the margin squeeze, yet the royalty still shaves 1.4 percentage points off projected CAGR.
OTT Revenue Leakage to Foreign Platforms
Messaging and voice traffic continues its shift to WhatsApp, Telegram, and similar OTT services, eroding legacy revenue streams. As 5G elevates video-call quality, the cannibalization effect intensifies. Operators respond by bundling content and launching fintech ventures, evidenced by Ooredoo’s B2B marketplace and digital-wallet pilots [4]Telecom Review, “Ooredoo Oman Operational Efficiencies,” telecomreview.com. However, limited regulatory recourse means voice and SMS erosion subtracts 0.6 percentage points from growth forecasts.
*Our forecasts treat driver/restraint impacts as directional, not additive. The impact forecasts reflect baseline growth, mix effects, and variable interactions.
Segment Analysis
By Service Type: Data Dominance Drives IoT Growth
Data and internet services held 50.12% of the Oman telecom MNO market share in 2025, anchoring top-line performance as enterprises shift workloads to cloud platforms. Voice still contributes materially but declines annually, while messaging yields continue to contract under OTT pressure. The Oman telecom MNO market size attributed to IoT and M2M services is projected to grow at a 5.99% CAGR through 2031, propelled by smart-city deployments in Muscat and Duqm and automated-meter-reading rollouts for water utilities. Operators monetize these connections via managed-services contracts and edge-computing bundles.
Fixed-wireless-access offerings deliver fiber-like speeds in challenging terrain, augmenting data revenue and reinforcing the centrality of 5G. OTT and PayTV streams add modest upside as local content partnerships mature, whereas roaming and enterprise-solutions lines benefit from Oman’s status as a logistics and tourism hub. TRA’s certification requirements for IoT reliability support premium pricing and keep churn low, further stabilizing data-service cash flows.


By End User: Enterprise Acceleration Outpaces Consumer Growth
Consumer lines represented 74.05% of the Oman telecom MNO market size in 2025, owing to high device penetration and diversified prepaid and postpaid plans. Yet, enterprise revenues are forecast to expand at a 6.26% CAGR, outpacing mass-market growth as Vision 2040 compels every sector, such as energy, logistics, healthcare, and public administration, to digitize operations. Omantel’s A’amali+ bundles for SMEs and Fiber Pro tiers for corporates illustrate the rising appetite for managed connectivity and cybersecurity packages.
Enterprise ARPU exceeds consumer equivalents by multiples, with contracts often spanning three-year horizons. Private 5G networks for industrial zones and port terminals feature guaranteed latency and slice isolation, commanding premium tariffs. In the consumer arena, unlimited-data plans and content add-ons sustain subscriber loyalty, though margin pressure persists from the royalty regime and OTT substitution. Device-financing offers and embedded-finance features further differentiate operator propositions across both segments.
Geography Analysis
Muscat, housing the largest 5G base-station density and 565 ATMs, remains the prime revenue generator, while Salalah leverages Equinix’s new data center to attract cloud workloads and submarine-cable landings. Sohar and Duqm industrial hubs rely on fixed-wireless-access and fiber back-haul to support petrochemical plants and container terminals. The Oman telecom MNO market size for coastal governorates rises in tandem with port logistics upgrades, while hinterland growth hinges on satellite backhaul.
Terrestrial links connect Oman to every GCC neighbor, reinforcing wholesale income stability and roaming reciprocity with 700 partners worldwide. Fixed-broadband penetration, still 11% in early 2024, offers a runway for fiber builds financed through government-operator co-investment schemes. Tourism centers such as Nizwa and coastal resorts generate seasonal spikes in roaming usage, magnified by 5G’s higher throughput for social-media uploads, video calls, and digital-tourism apps.
Rural districts benefit from March 2025 Starlink licensing and OmanSat’s Category 1 authorization, narrowing the digital divide in mountainous and desert areas. The TRA’s open-access mandates ensure smaller ISPs can lease capacity, stimulating regional service diversity. Transportation megaprojects, including the USD 3 billion railway and 800 miles of new roads, require robust mobile coverage and IoT sensors for smart-infrastructure management. Collectively, these geographic dynamics deepen national connectivity resilience and diversify revenue sources beyond Muscat’s urban core.
Regulatory Landscape
The Telecommunications Regulatory Authority (TRA) operates under the Telecommunications Act (Royal Decree No. 30/2002). TRA manages the .om domain and International Domain Register (.Oman) and oversees the National Numbering Plan. Operators must submit price proposals for new or modified services to the TRA for approval, which reinforces tariff oversight in a three-operator market. The TRA also introduced a 3G sunset roadmap to reallocate spectrum toward 4G and 5G, and set passive infrastructure sharing policies to reduce capital intensity.
The National Program for Government Digital Transformation (Tahawul) governs institutional digital service standards, while the Ministry of Transport, Communications, and Information Technology (MTCIT) issued digital accessibility guidance in April 2025. That guidance affects mobile apps and digital channels used by MNOs and enterprise customers.
Competitive Landscape
Oman’s telecom arena is a concentrated three-player oligopoly: Omantel, Ooredoo, and Vodafone. The top two operators, Omantel and Ooredoo, together held a significant share of subscriptions in 2024, though Vodafone rapidly gained its position in the Oman telecom MNO market within two years through aggressive digital onboarding and loyalty rewards. Competition pivots on 5G speed, coverage, and differentiated enterprise offerings. Omantel leads coverage and wholesale capacity owing to its extensive submarine-cable stakes, while Vodafone tops consistency scores at 74.4% and positions itself as a fully digital-service brand.
Ooredoo pursues vertical diversification, partnering with Shell Oman to deploy IoT solutions for the energy sector and with Oman Data Park for cloud-hosting bundles. Omantel’s equity investment in Byanat enhances data analytics capabilities that feed into AI-driven customer experience platforms. Vodafone’s asset-light strategy includes extensive tower-sharing agreements, compressing capex and expediting rollout timelines.
Regulatory levers such as spectrum allocations, infrastructure-sharing mandates, and quality-of-service audits maintain competitive equilibrium. The 12% royalty regime, shared by all, limits undercutting on tariffs and channels rivalry toward service innovation and customer-experience differentiation. Future battlegrounds include satellite-terrestrial integration, fintech ecosystems, and managed security services tailored to Vision 2040’s cybersecurity framework.
Oman Telecom MNO Industry Leaders
Oman Telecommunications Company (Omantel)
Omani Qatari Telecommunications Company (Ooredoo)
Vodafone Oman
- *Disclaimer: Major Players sorted in no particular order


Market Opportunities and Future Outlook
The National Digital Transformation Strategy (2026-2030) focuses on digitizing 2,200 services and establishing digital transformation centers in all governorates. It creates a multi-year pipeline for secure connectivity, managed networks, and integration services across ministries, with implications for operator spending on enterprise-ready delivery models. Separately, the National Digital Economy Program targets the ICT sector to contribute 10% of GDP by 2040, which supports sustained government demand for digital infrastructure and services.
Supporting initiatives include Duqm and Sohar SEZs enabling dedicated 5G campus networks, and Starlink licensing for rural backhaul. Enterprise networking and cybersecurity bundles are also forming through operator actions, with emphasis on SD-WAN, campus connectivity, and cybersecurity offerings. Together, these trends point to sustained demand for managed connectivity, cloud, and platform services within Oman’s Vision 2040 framework.
Recent Industry Developments
- June 2026: Ooredoo Oman launches a software defined wide area network (SD-WAN) solution for the digital economy. The rollout expands enterprise and business connectivity offerings and supports cross-sell opportunities with other Oman Vision 2040 initiatives. The added capacity is intended to support differentiated enterprise services and speed up onboarding for digital transformation programs.
- June 2026: Ooredoo Oman - Company launched a software-defined wide area network (SD-WAN) solution aimed at the digital economy. The rollout expands the company\'s enterprise connectivity capabilities and aligns with broader digital infrastructure ambitions in Oman. It reinforces Ooredoo Oman\'s position as a provider of agile, scalable network services for corporate customers.
- February 2026: Omantel launches Otech to unify ICT capabilities (Oracle Alloy, PwC, Nagarro, Palo Alto Networks, Fortinet partnerships). The initiative consolidates Omantel\'s tech stack and partnerships to support integrated services across ICT domains. This consolidation strengthens the company\'s ability to offer end-to-end solutions to enterprise clients.


Research Methodology Framework and Report Scope
Market Definition and Coverage
For this methodology, the market covers operator-led telecom services in Oman, measured as service revenue generated from mobile and fixed connectivity and related service lines sold to consumers and enterprises.
Scope exclusions: Handset/device sales and pure IT hardware are excluded, and non-operator digital platforms are only counted when billed as telecom service revenue.
Segmentation Overview
- Overall Telecom Revenue and ARPU
- Service Type
- Voice Services
- Data and Internet Services
- Messaging Services
- IoT and M2M Services
- OTT and PayTV Services
- Other Services (VAS, Roaming and International Services, Enterprise and Wholesale Services, etc.)
- End-user
- Enterprises
- Consumer
Data Sources, Market Sizing, and Validation
Desk Research
Desk research was used to set the Oman context and to anchor the model with publicly trackable demand signals. We relied on official and non-paywalled sources such as the Telecommunications Regulatory Authority (TRA) releases, the National Center for Statistics and Information (NCSI), ITU indicators, and World Bank macro series to understand subscriber trends, network expansion, and household and business adoption patterns.
We also reviewed operator annual reports and investor materials, along with credible press coverage and industry association updates, to capture pricing changes, 5G and fiber rollout milestones, and shifts in service mix. For cross-checking, we used paid subscriptions for company financials and intelligence, news and financials, and patent databases where technology direction needed clarification. This desk source list is illustrative only, and we also used additional public and paid references to collect, verify, and clarify the final assumptions.
Primary Interviews and Surveys
Primary work focused on validating what is hard to read from public documents, especially how revenue is split across mobile, fixed broadband, enterprise connectivity, and newer lines like IoT and M2M. We spoke with operator-side leaders, telecom infrastructure stakeholders, enterprise buyers, and channel participants across Oman so that pricing, churn, and migration (for example, 4G to 5G and copper to fiber) could be checked against real purchase behavior.
Distribution of primary research fieldwork respondents
| Company type | Respondent position |
|---|---|
| Top tier: 36% | CXOs: 12% |
| Mid tier: 43% | Functional/Unit leaders: 29% |
| Smaller Players: 21% | Managers: 59% |
Market-Sizing & Forecasting
The core sizing uses a top-down build where service revenues are reconstructed from the operator service portfolio, and then reconciled to country-level telecom revenue signals available from regulators and audited statements. Once the revenue pool is built, it is split using observable indicators so each service line stays consistent with how customers actually pay for telecom in Oman.
Key inputs include mobile and fixed subscriber counts, data usage growth, 5G population coverage and adoption timing, fiber broadband connections, and ARPU direction for prepaid and postpaid customers. Enterprise demand was guided by the pace of managed connectivity uptake, IoT and M2M connection growth, and major network investment cycles that typically show up in capex and rollout plans. To corroborate totals, we ran selective bottom-up checks using sampled price plans and volume assumptions, plus channel checks on household broadband packages and enterprise contract behavior. Where data was incomplete, gaps were handled using conservative ranges agreed during interviews.
For forecasting, we used a scenario-based model supported by simple multivariate relationships, where revenue is driven by expected subscriber mix, ARPU movement, and migration to higher-speed plans. Assumptions were tightened using expert views on competitive intensity, regulatory changes, and the likely timing of major network upgrades, and then the final path was smoothed to avoid unrealistic year-to-year jumps.
Data Validation & Update Cycle
Validation is done through repeated cross-checks across independent signals, followed by analyst review steps before sign-off. Model outputs are compared against regulator-reported telecom revenue trends, subscriber and connection growth, and operator-level disclosures, and then any variance is traced back to a specific assumption such as ARPU, migration speed, or inclusion boundaries.
When an outlier is found, we either re-check the desk sources or re-contact relevant primary respondents, especially for pricing shifts, new launches, or a sudden change in usage patterns. Reports are refreshed annually, and interim updates are made when material events can change demand or revenue outcomes. Before delivery, a final pass is completed so clients receive the latest updated view available at the time of publication.
Mordor Intelligence's Oman Telecom Market Size Measured Against Other Published Estimates
Published market values for Oman telecom can look different because not everyone counts the same revenue lines, and not everyone uses the same base year, currency timing, or split logic between telecom and adjacent digital services. Differences also show up when some estimates lean more on forward-looking adoption assumptions without enough checks against actual subscriber and revenue signals.
By tracking regulator-reported telecom revenue signals, subscriber migration to 5G and fiber, and service-line allocation rules each refresh cycle, Mordor Intelligence keeps the Oman telecom total tied to operator service revenue, instead of folding in wider ICT items like data centers and cloud platforms.
Benchmark comparison
| Source | Market Size | Gaps in Research Methodology |
|---|---|---|
| Mordor Intelligence | USD 2.70 B (2025) | |
| Trade Journal A | USD 2.40 B (2024) | Often reflects regulator-reported sector revenue for a prior year, which can exclude some operator-billed service lines or treat newer revenue streams (such as IoT and M2M) inconsistently across operators. |
| Global Consultancy B | USD 3.00 B (2026) | May start from an aggressive forward year and blend telecom with adjacent digital service revenue (for example, broader enterprise platforms), which can lift totals if the telecom boundary is not kept to operator service billing. |
The comparison shows that the spread is largely explained by timing and what gets counted as telecom revenue, not by a single data point. When scope is held to operator service billing and then checked against subscriber and migration indicators, the resulting size is easier to trace and repeat across updates.


Key Questions Answered in the Report
How large is the Oman telecom MNO market in 2026?
The market is valued at USD 2.86 billion in 2026 and is projected to reach USD 3.80 billion by 2031.
What CAGR is expected for Oman’s mobile-network operators through 2031?
Revenue is forecast to rise at a 5.88% CAGR, driven by 5G adoption and enterprise digitalization.
Which service type contributes the most revenue?
Data and internet services account for 50.12% of total 2025 revenue, far outpacing voice and messaging.
Who are the major players and their shares?
Omantel and Ooredoo together held roughly 78% of subscriptions in 2024, while Vodafone secured 12% after its 2022 entry.
What role do submarine cables play in Oman's telecom sector?
Hosting more than 20 subsea systems positions Oman as a wholesale connectivity hub, generating stable international revenue streams, especially through Omantel’s 100+ interconnects.
Page last updated on:


 Your data is secure and never sold or shared.


