Olive Market Analysis by Mordor Intelligence
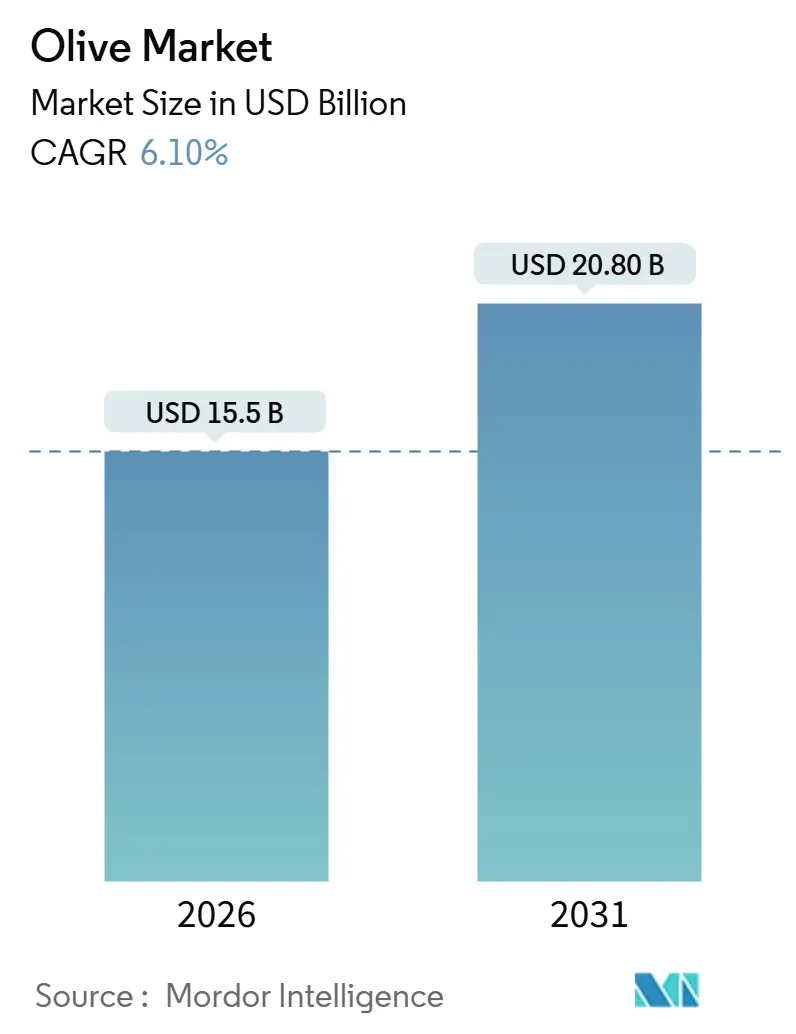
The olive market size is valued at USD 15.50 billion in 2026 and is projected to reach USD 20.80 billion by 2031, exhibiting a 6.10% CAGR during the forecast period. The growth of the olive market is driven by efforts to mitigate cardiometabolic diseases, alongside the adoption of the Mediterranean diet and super-high-density (SHD) grove technology, which helps lower production costs and stabilize yields. While abundant olive harvests in North Africa are temporarily reducing prices, the use of blockchain for provenance and the premium positioning of extra-virgin olive oil are increasing margins for traceable products. Additionally, capital investments in California and Australia, along with sustainability subsidies from the European Union, are altering competitive dynamics across regions. At the same time, labor shortages in Mediterranean countries are accelerating the mechanization of olive farming. These intersecting forces suggest that the olive market is transitioning from fragmented, labor-intensive traditions to data-driven, scale-oriented production systems.
Key Report Takeaways
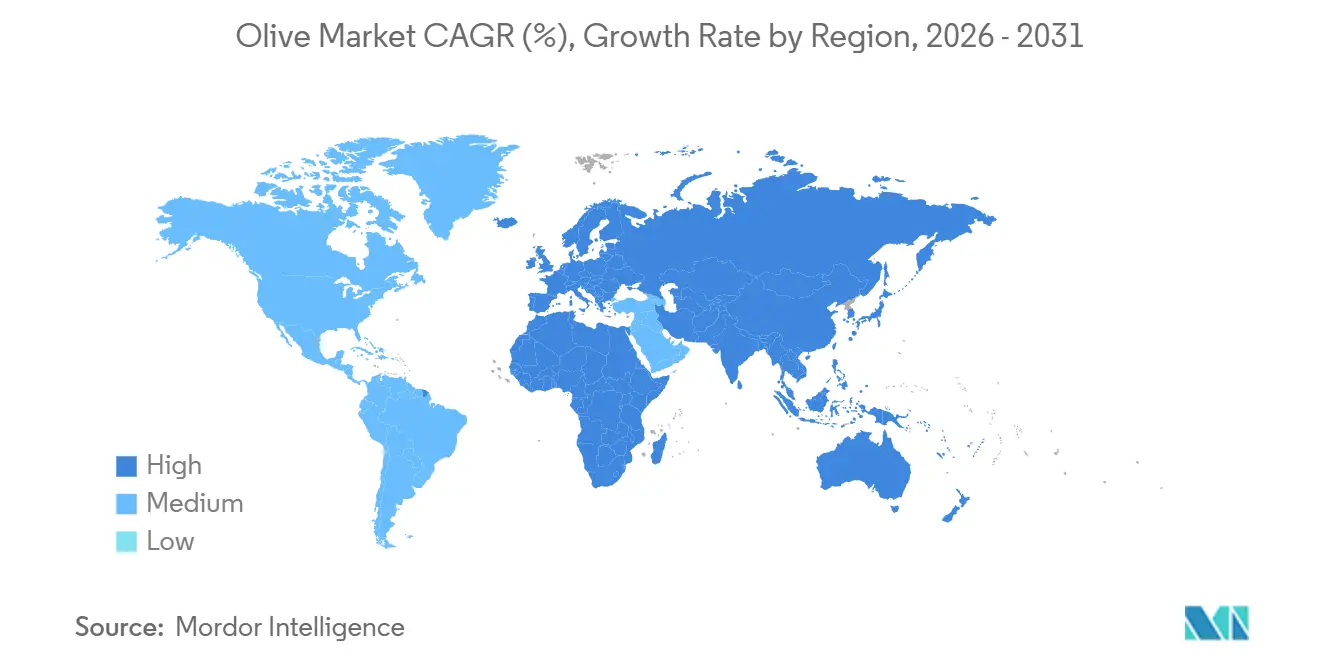
- By geography, Europe led with 69% olive market share in 2025, while Asia-Pacific is forecast to expand at a 7.4% CAGR through 2031.
Note: Market size and forecast figures in this report are generated using Mordor Intelligence’s proprietary estimation framework, updated with the latest available data and insights as of January 2026.
Global Olive Market Trends and Insights
Drivers Impact Analysis
| Driver | (~) % Impact on CAGR Forecast | Geographic Relevance | Impact Timeline |
|---|---|---|---|
| Diet-linked shift toward Mediterranean diet | +1.2% | Global, with concentrated adoption in North America, Northern Europe, and urban Asia-Pacific | Medium term (2-4 years) |
| Rapid expansion of premium extra-virgin olive exports | +0.9% | Europe (Spain, Italy, and Greece) exporting to North America, Asia-Pacific, and Middle East | Medium term (2-4 years) |
| Rising cardiometabolic disease burden boosting demand | +1.5% | Global, particularly acute in North America, Western Europe, and emerging Asia-Pacific markets | Long term (≥ 4 years) |
| Government sustainability subsidies for perennial crops | +0.7% | Europe (CAP framework), with spillover to Mediterranean basin and select South American markets | Long term (≥ 4 years) |
| Under-irrigated arid land conversion to super-high-density (SHD) groves | +0.8% | Spain, Portugal, California, Australia, Chile, with expansion into North Africa | Medium term (2-4 years) |
| Blockchain-based provenance premiums in specialty auctions | +0.6% | Europe (Italy, Spain, and Greece) and premium segments in North America and Asia-Pacific | Short term (≤ 2 years) |
| Source: Mordor Intelligence | |||
Diet-linked Shift Toward Mediterranean Diet
Clinical evidence indicates that a daily intake of 25 grams of olive oil reduces cardiovascular risk by 16%, type 2 diabetes incidence by 22%, and all-cause mortality by 11% [1]Source: “Olive Oil and Cardiovascular Health,” MDPI Nutrients, mdpi.com. These findings have prompted national health agencies in Canada and Germany to add extra-virgin olive oil (EVOO) to dietary guidelines, spurring hospital food-service contracts and employer wellness programs that specify olive oil as the default culinary fat. Consumption is rising fastest where baseline intake is low, particularly in the urban corridors of the United States and China. Retailers now merchandise olive oil in functional-food aisles alongside probiotics and omega-3 supplements, signaling a shift in the category from culinary staple to health product. Continued medical validation suggests that the olive market could outpace the baseline healthcare systems in adopting diet-centric interventions.
Rapid Expansion of Premium Extra-Virgin Olive Exports
Spain, Italy, and Greece exported more than 1 million metric tons of olive oil in 2024, with approximately 70% qualifying as extra-virgin olive oil (EVOO), which fetched premiums of 40%–60% over refined blends. Protected Designation of Origin (PDO) certification restricts labels to specific terroirs, creating scarcity that keeps prices firm even when North African bulk output surges. California producers follow this playbook. 75% of the state’s 162,500 metric tons of the 2024 harvest were crushed for premium oil rather than canned as table olives. Blockchain Quick Response (QR) code authenticates polyphenol content at the point of sale, deepening consumer trust. Fraudulent labeling remains a hurdle because 20% of sampled EVOO in 2024 failed legal quality standards in random European tests, underscoring the need for third-party verification that raises transaction costs yet further differentiates authentic suppliers.
Rising Cardiometabolic Disease Burden Boosting Demand
Cardiovascular disease and diabetes collectively affect more than one billion people and account for 30% of global disability-adjusted life years. A 2024 meta-analysis equated the preventive effect of olive oil with that of moderate-dose statin therapy, motivating insurers in the United States to pilot reimbursement programs for the Mediterranean diet. The European Food Safety Authority (EFSA) confirmed in 2025 that olive polyphenols protect blood lipids from oxidative stress [2]Source: “Blockchain and IoT Integration for Olive Oil Traceability,” IEEE Xplore, ieeexplore.ieee.org, enabling on-label health claims across the European Union. These regulatory tailwinds open institutional channels, such as school lunch systems, broadening demand beyond retail. Since olive oil substitutes for saturated fats rather than adding calories, sustained growth depends on shifting overall dietary patterns, underscoring the strategic importance of nutrition education campaigns.
Government Sustainability Subsidies for Perennial Crops
The European Union’s Common Agricultural Policy (CAP) 2023-2027 allocates EUR 386.6 billion (USD 406 billion) to agriculture, with olive farming eligible for direct payments that reward carbon sequestration and biodiversity. Italy’s National Olive Plan, launched in 2025, commits EUR 80 million (USD 84 million) to modernize mills and plant 5,000 hectares of Xylella-resistant groves in Apulia. Subsidies favor large estates that can meet complex compliance rules, accelerating consolidation. Similar frameworks in Portugal and Chile co-finance drip irrigation and super-high-density (SHD) systems, thereby lowering capital hurdles and tilting production toward highly mechanized operators that can lock in future premium contracts with retailers.
Restraints Impact Analysis
| Restraint | (~) % Impact on CAGR Forecast | Geographic Relevance | Impact Timeline |
|---|---|---|---|
| Climate-induced biennial bearing volatility | -0.8% | Mediterranean basin (Spain, Italy, and Greece), with spillover to California and Chile | Medium term (2-4 years) |
| Spread of Xylella fastidiosa and Verticillium wilt pathogens | -1.2% | Southern Europe (Italy, Spain, and France), with containment efforts in Greece and emerging detections in California | Long term (≥ 4 years) |
| Price compression from large North-African bumper crops | -0.6% | Global pricing impact, most acute in Europe and Middle East import markets | Short term (≤ 2 years) |
| Rising agri-labor shortages in Mediterranean basin | -0.9% | Spain, Italy, Greece, and Portugal, with secondary effects in Turkey and North Africa | Medium term (2-4 years) |
| Source: Mordor Intelligence | |||
Climate-induced Biennial Bearing Volatility
Spain’s 2024–2025 harvest collapsed to 1.26 million metric tons, the lowest in a decade, after drought limited fruit set by 40%. Climate models predict 15%–20% higher inter-annual yield variability by 2030, challenging long-term supply contracts. Deficit irrigation can smooth yields but requires real-time soil moisture data and variable-rate systems that many smallholders cannot finance. Dual-sourcing has become standard among bottlers, diluting loyalty to traditional suppliers. Without large-scale irrigation investments, some Mediterranean groves may become economically untenable within ten years.
Spread of Xylella fastidiosa and Verticillium Wilt Pathogens
Xylella fastidiosa has caused the death of approximately 20 million Italian olive trees since its first detection in 2013, resulting in losses exceeding EUR 1 billion (USD 1.05 billion). Verticillium wilt persists in soils for decades, forcing growers to either replant with resistant varieties or abandon fields. Quarantine zones restrict plant movement and depress land values by up to 50%, deterring new investment. Early-detection tools using Clustered Regularly Interspaced Short Palindromic Repeats (CRISPR) diagnostics show promise but await regulatory approval and the deployment of extension services.
Geography Analysis
Europe’s 69% olive market share in 2025 masks mounting structural fragility. Italy’s volumes fell to 240,000 metric tons, and mill utilization has slipped below 50% as growers abandon pathogen-stricken groves. Greece maintains a premium positioning through Protected Designation of Origin (PDO) oils, such as Kalamata and Koroneiki, which command price premiums of 30%–40%, but volume growth remains flat. Portugal’s Alentejo region saw a 15% expansion in planted area between 2020 and 2025. Output below 150,000 metric tons leaves the country unable to offset broader Mediterranean declines.
The Asia-Pacific region is projected to experience the fastest growth, with a CAGR of 7.4% in the olive market size through 2031. China’s 2024 imports exceeded 60,000 metric tons after a 28% year-over-year surge [3]Source: “China Customs Import Statistics,” General Administration of Customs of the People’s Republic of China, customs.gov.cn. India consumes approximately 15,000 metric tons annually. Expanding distribution beyond tier-1 cities could potentially increase demand to 50,000 metric tons by 2030. Australia harvested 20,000 metric tons in 2024 and channels most of its output into high-polyphenol extra-virgin olive oil (EVOO), which sells at USD 25–40 per liter. Iranian consumption is increasing by 8% annually, although sanctions limit export potential. The regional trade balance hinges on whether China or India develops cost-competitive domestic groves and absent of that shift, Mediterranean and South American exporters will dominate supply.
North America accounts for approximately 8% of global consumption, importing over 350,000 metric tons annually. Domestic supply accounts for less than 2% of needs, providing premium California EVOO a protected niche. California’s 2024 harvest of 162,500 metric tons was worth USD 144 million. By 2027, Acesur and Cobram Estate plan to merge and increase their combined capacity by 2 million liters. Canada’s imports approach 40,000 metric tons and are growing at a rate of 5% annually, signaling incremental volume for European bulk shippers. Demand resilience stems from health branding rather than price, enabling traceable oils to secure higher shelf premiums that protect producers from commodity price fluctuations.
Get Analysis on Important Geographic Markets
Download PDF
Competitive Landscape
The olive market is experiencing the emergence of two strategic models. On the one hand, vertically integrated giants such as Deoleo leverage blockchain for traceability at scale, adding 10%–15% premiums to approximately 4 million bottles annually. On the other hand, SHD estate developers such as Cobram Estate and Acesur deploy capital to secure land in climates less prone to Xylella and drought, targeting yield efficiency through mechanization. Cobram Estate raised AUD 175 million (USD 116 million) in 2025 to acquire 1,600 hectares in California, aiming for an annual output of nine million liters of olive oil. Acesur planted 450,000 SHD trees in Woodland, California, and will commission an on-site mill by 2027, confirming that Mediterranean leaders view geographic diversification as a risk insurance strategy.
Mid-tier disruptors focus on terroir and provenance. Italian cooperatives that adopted the blockchain Quick Response code achieved sales gains of 15%–25% in specialty stores. In Spain, SHD operators utilize UAV-mounted hyperspectral imaging to optimize irrigation, achieving 5% of ideal evapotranspiration while balancing yield and sustainability credentials. North African producers hold cost advantages but struggle with port and customs delays that thin margins during bumper years.
Traditional smallholders across Mediterranean hillsides face shrinking viability because labor costs and compliance paperwork outstrip potential price realizations. Many consider co-operative consolidation or organic certification as survival strategies. Overall, the competitive environment is tilting toward operators that align scale, technology, and brand storytelling. Precision agriculture suppliers, including sensor makers and data analytics platforms, are becoming essential partners, while bottlers that fail to offer verifiable quality risk being relegated to low-margin bulk segments.
Recent Industry Developments
- September 2025: Cobram Estate, Australia's largest olive oil producer, completed an AUD 175 million (USD 116 million) institutional placement and an AUD 10 million (USD 6.6 million) share purchase plan to finance the acquisition and development of 1,600 hectares of olive plantations in California. This expansion is projected to increase its United States footprint to approximately 3,600 hectares of olive plantations by the end of 2027.
- March 2025: Italy's Ministry of Agriculture has approved the National Olive Plan, allocating EUR 80 million (USD 84 million) toward mill modernization and establishing 5,000 hectares of Xylella fastidiosa-resistant groves in Puglia. The plan targets a 25% increase in production and a 20% reduction in costs over the next 10 years.
- January 2025: Acesur, Spain's second-largest olive oil producer, has completed planting 450,000 super-high-density (SHD) olive trees across 356 hectares in Woodland, California, utilizing cultivars such as Arbosana, Arbequina, Lecciana, and Sikitita. The project aims to increase extra-virgin olive oil production to 1 million liters by 2027, with Phase Two investments planned for an on-site mill and packaging plant to capture downstream margins.
Research Methodology Framework and Report Scope
Market Definitions and Key Coverage
Our study defines the global olive market as the commercial trade of fresh or chilled green and black olives (HS-070992) that are harvested for direct consumption or further crushing into oil. The model spans value and volume flows across production, consumption, and cross-border trade for every major growing and importing nation.
Scope Exclusion: processed derivatives such as canned, pickled, frozen, dried, or purely bottled olive oil are not counted.
Segmentation Overview
- By Geography
- North America
- United States
- Production Analysis (Area Harvested, Yield, and Production Volume)
- Consumption Analysis (Consumption Value and Volume)
- Import Market Analysis (Import Value, Volume, and Key Supplying Markets)
- Export Market Analysis (Export Value, Volume, and Key Destination Markets)
- Wholesale Price Trend Analysis and Forecast
- Regulatory Framework
- List of Key Players
- Logistics and Infrastructure
- Seasonality Analysis
- Canada
- Production Analysis (Area Harvested, Yield, and Production Volume)
- Consumption Analysis (Consumption Value and Volume)
- Import Market Analysis (Import Value, Volume, and Key Supplying Markets)
- Export Market Analysis (Export Value, Volume, and Key Destination Markets)
- Wholesale Price Trend Analysis and Forecast
- Regulatory Framework
- List of Key Players
- Logistics and Infrastructure
- Seasonality Analysis
- United States
- Europe
- Spain
- Production Analysis (Area Harvested, Yield, and Production Volume)
- Consumption Analysis (Consumption Value and Volume)
- Import Market Analysis (Import Value, Volume, and Key Supplying Markets)
- Export Market Analysis (Export Value, Volume, and Key Destination Markets)
- Wholesale Price Trend Analysis and Forecast
- Regulatory Framework
- List of Key Players
- Logistics and Infrastructure
- Seasonality Analysis
- Greece
- Production Analysis (Area Harvested, Yield, and Production Volume)
- Consumption Analysis (Consumption Value and Volume)
- Import Market Analysis (Import Value, Volume, and Key Supplying Markets)
- Export Market Analysis (Export Value, Volume, and Key Destination Markets)
- Wholesale Price Trend Analysis and Forecast
- Regulatory Framework
- List of Key Players
- Logistics and Infrastructure
- Seasonality Analysis
- Italy
- Production Analysis (Area Harvested, Yield, and Production Volume)
- Consumption Analysis (Consumption Value and Volume)
- Import Market Analysis (Import Value, Volume, and Key Supplying Markets)
- Export Market Analysis (Export Value, Volume, and Key Destination Markets)
- Wholesale Price Trend Analysis and Forecast
- Regulatory Framework
- List of Key Players
- Logistics and Infrastructure
- Seasonality Analysis
- Portugal
- Production Analysis (Area Harvested, Yield, and Production Volume)
- Consumption Analysis (Consumption Value and Volume)
- Import Market Analysis (Import Value, Volume, and Key Supplying Markets)
- Export Market Analysis (Export Value, Volume, and Key Destination Markets)
- Wholesale Price Trend Analysis and Forecast
- Regulatory Framework
- List of Key Players
- Logistics and Infrastructure
- Seasonality Analysis
- France
- Production Analysis (Area Harvested, Yield, and Production Volume)
- Consumption Analysis (Consumption Value and Volume)
- Import Market Analysis (Import Value, Volume, and Key Supplying Markets)
- Export Market Analysis (Export Value, Volume, and Key Destination Markets)
- Wholesale Price Trend Analysis and Forecast
- Regulatory Framework
- List of Key Players
- Logistics and Infrastructure
- Seasonality Analysis
- Germany
- Production Analysis (Area Harvested, Yield, and Production Volume)
- Consumption Analysis (Consumption Value and Volume)
- Import Market Analysis (Import Value, Volume, and Key Supplying Markets)
- Export Market Analysis (Export Value, Volume, and Key Destination Markets)
- Wholesale Price Trend Analysis and Forecast
- Regulatory Framework
- List of Key Players
- Logistics and Infrastructure
- Seasonality Analysis
- Russia
- Production Analysis (Area Harvested, Yield, and Production Volume)
- Consumption Analysis (Consumption Value and Volume)
- Import Market Analysis (Import Value, Volume, and Key Supplying Markets)
- Export Market Analysis (Export Value, Volume, and Key Destination Markets)
- Wholesale Price Trend Analysis and Forecast
- Regulatory Framework
- List of Key Players
- Logistics and Infrastructure
- Seasonality Analysis
- Spain
- Asia-Pacific
- China
- Production Analysis (Area Harvested, Yield, and Production Volume)
- Consumption Analysis (Consumption Value and Volume)
- Import Market Analysis (Import Value, Volume, and Key Supplying Markets)
- Export Market Analysis (Export Value, Volume, and Key Destination Markets)
- Wholesale Price Trend Analysis and Forecast
- Regulatory Framework
- List of Key Players
- Logistics and Infrastructure
- Seasonality Analysis
- Australia
- Production Analysis (Area Harvested, Yield, and Production Volume)
- Consumption Analysis (Consumption Value and Volume)
- Import Market Analysis (Import Value, Volume, and Key Supplying Markets)
- Export Market Analysis (Export Value, Volume, and Key Destination Markets)
- Wholesale Price Trend Analysis and Forecast
- Regulatory Framework
- List of Key Players
- Logistics and Infrastructure
- Seasonality Analysis
- India
- Production Analysis (Area Harvested, Yield, and Production Volume)
- Consumption Analysis (Consumption Value and Volume)
- Import Market Analysis (Import Value, Volume, and Key Supplying Markets)
- Export Market Analysis (Export Value, Volume, and Key Destination Markets)
- Wholesale Price Trend Analysis and Forecast
- Regulatory Framework
- List of Key Players
- Logistics and Infrastructure
- Seasonality Analysis
- China
- South America
- Chile
- Production Analysis (Area Harvested, Yield, and Production Volume)
- Consumption Analysis (Consumption Value and Volume)
- Import Market Analysis (Import Value, Volume, and Key Supplying Markets)
- Export Market Analysis (Export Value, Volume, and Key Destination Markets)
- Wholesale Price Trend Analysis and Forecast
- Regulatory Framework
- List of Key Players
- Logistics and Infrastructure
- Seasonality Analysis
- Brazil
- Production Analysis (Area Harvested, Yield, and Production Volume)
- Consumption Analysis (Consumption Value and Volume)
- Import Market Analysis (Import Value, Volume, and Key Supplying Markets)
- Export Market Analysis (Export Value, Volume, and Key Destination Markets)
- Wholesale Price Trend Analysis and Forecast
- Regulatory Framework
- List of Key Players
- Logistics and Infrastructure
- Seasonality Analysis
- Argentina
- Production Analysis (Area Harvested, Yield, and Production Volume)
- Consumption Analysis (Consumption Value and Volume)
- Import Market Analysis (Import Value, Volume, and Key Supplying Markets)
- Export Market Analysis (Export Value, Volume, and Key Destination Markets)
- Wholesale Price Trend Analysis and Forecast
- Regulatory Framework
- List of Key Players
- Logistics and Infrastructure
- Seasonality Analysis
- Chile
- Middle East
- Egypt
- Production Analysis (Area Harvested, Yield, and Production Volume)
- Consumption Analysis (Consumption Value and Volume)
- Import Market Analysis (Import Value, Volume, and Key Supplying Markets)
- Export Market Analysis (Export Value, Volume, and Key Destination Markets)
- Wholesale Price Trend Analysis and Forecast
- Regulatory Framework
- List of Key Players
- Logistics and Infrastructure
- Seasonality Analysis
- Turkey
- Production Analysis (Area Harvested, Yield, and Production Volume)
- Consumption Analysis (Consumption Value and Volume)
- Import Market Analysis (Import Value, Volume, and Key Supplying Markets)
- Export Market Analysis (Export Value, Volume, and Key Destination Markets)
- Wholesale Price Trend Analysis and Forecast
- Regulatory Framework
- List of Key Players
- Logistics and Infrastructure
- Seasonality Analysis
- Egypt
- Africa
- Morocco
- Production Analysis (Area Harvested, Yield, and Production Volume)
- Consumption Analysis (Consumption Value and Volume)
- Import Market Analysis (Import Value, Volume, and Key Supplying Markets)
- Export Market Analysis (Export Value, Volume, and Key Destination Markets)
- Wholesale Price Trend Analysis and Forecast
- Regulatory Framework
- List of Key Players
- Logistics and Infrastructure
- Seasonality Analysis
- Tunisia
- Production Analysis (Area Harvested, Yield, and Production Volume)
- Consumption Analysis (Consumption Value and Volume)
- Import Market Analysis (Import Value, Volume, and Key Supplying Markets)
- Export Market Analysis (Export Value, Volume, and Key Destination Markets)
- Wholesale Price Trend Analysis and Forecast
- Regulatory Framework
- List of Key Players
- Logistics and Infrastructure
- Seasonality Analysis
- Algeria
- Production Analysis (Area Harvested, Yield, and Production Volume)
- Consumption Analysis (Consumption Value and Volume)
- Import Market Analysis (Import Value, Volume, and Key Supplying Markets)
- Export Market Analysis (Export Value, Volume, and Key Destination Markets)
- Wholesale Price Trend Analysis and Forecast
- Regulatory Framework
- List of Key Players
- Logistics and Infrastructure
- Seasonality Analysis
- Morocco
- North America
Detailed Research Methodology and Data Validation
Primary Research
Mordor analysts interviewed growers' cooperatives in Andalusia, exporters in Tunisia, bulk buyers in the United States, and equipment suppliers across Australia and Chile. These discussions tested yield swing assumptions, average farm-gate prices, and demand shifts among table-olive packers, allowing us to calibrate desk numbers and close region-specific gaps.
Desk Research
We began with agriculture statistics released by FAO FAOSTAT, Eurostat's Olive Oil & Table Olives Observatory, and USDA GAIN notes to size historical production, yield, and trade. Complementary insights came from International Olive Council price dashboards, national customs databases (China, Spain, Morocco), and peer-reviewed agronomy journals tracking grove acreage and varietal spreads. Where firm-level clarity was essential, D&B Hoovers and Dow Jones Factiva supplied financial snapshots and shipment news. The sources named above illustrate the blend of public and licensed datasets consulted; many additional feeds were referenced to double-check anomalies.
Market-Sizing & Forecasting
The 2024 base was anchored through a top-down reconstruction of production plus net imports, subsequently validated with sampled wholesale ASP x volume checks in Italy, the U.S. and China. Key model drivers include bearing acreage in super-high-density (SHD) groves, biennial yield variability, average extraction rate to oil, international FOB prices, and per-capita Mediterranean-diet adoption indices. A multivariate regression links these variables to historical market value. ARIMA projections extend them through 2030, while scenario analysis stress-tests climate-shock years. Bottom-up supplier roll-ups were applied in countries where co-op reporting is transparent, and any shortfall versus the top-down line was prorated using three-year moving averages.
Data Validation & Update Cycle
Outputs pass a two-stage peer review, variance checks against IOC price signals, and currency reconversion audits. We refresh the model annually, with interim updates triggered by >=15% supply shocks or trade-policy shifts so clients receive the latest view.
Why Mordor's Olive Baseline Commands Reliability
Published figures often diverge because firms bundle different product forms, apply dissimilar price series, or project with outdated acreage maps.
Key gap drivers include: some publishers merge processed olives and bottled oils; a few adopt optimistic harvest scenarios without pathogen loss adjustments; several convert currencies at fixed-year averages; and many refresh less than once every two years, missing recent drought impacts.
Benchmark comparison
| Market Size | Anonymized source | Primary gap driver |
|---|---|---|
| USD 17.30 B | Mordor Intelligence | - |
| USD 26.57 B | Global Consultancy A | Includes canned and pickled olives, no pathogen loss factor |
| USD 20.31 B | Trade Journal B | Tracks olive oil values only, excludes table fruit volume |
| USD 17.60 B | Industry Portal C | Uses fixed 2022 FX rates, limited climate-shock scenario work |
These comparisons show that when scope, variables, and refresh cadence are harmonized, Mordor's disciplined approach delivers a balanced, transparent baseline that decision-makers can replicate and trust.
Need A Different Region or Segment?
Customize Now
Key Questions Answered in the Report
How big is the global olive market in 2026?
The olive market size stands at USD 15.50 billion in 2026, and forecasts indicate USD 20.80 billion by 2031.
Which region leads demand for olive oil today?
Europe holds 69% olive market share, driven by Spain, Italy, and Greece, although growth is moderating because of climate and pathogen challenges.
Why is Asia-Pacific considered the fastest-growing geography?
Rising urban incomes in China and expanding distribution in India push the region toward a 7.4% CAGR through 2031.
What technology is most disruptive to olive production?
Super-high-density groves paired with precision irrigation and blockchain traceability reduce labor costs, improve yields, and command price premiums.
How are pathogens like Xylella fastidiosa affecting supply?
Xylella has killed 20 million Italian olive trees and cut European output, prompting replanting with resistant cultivars and raising production costs.
Are labor shortages likely to persist in Mediterranean groves?
Yes, wages rose up to 30% since 2020 and mechanization remains limited on traditional farms, making labor scarcity an ongoing restraint.


