
Market Overview
| Study Period | 2021 - 2031 |
|---|---|
| Market Size (2026) | USD 249.13 Billion |
| Market Size (2031) | USD 282.56 Billion |
| Growth Rate (2026 - 2031) | 2.55 % |
| Fastest Growing Market | North America |
| Largest Market | North America |
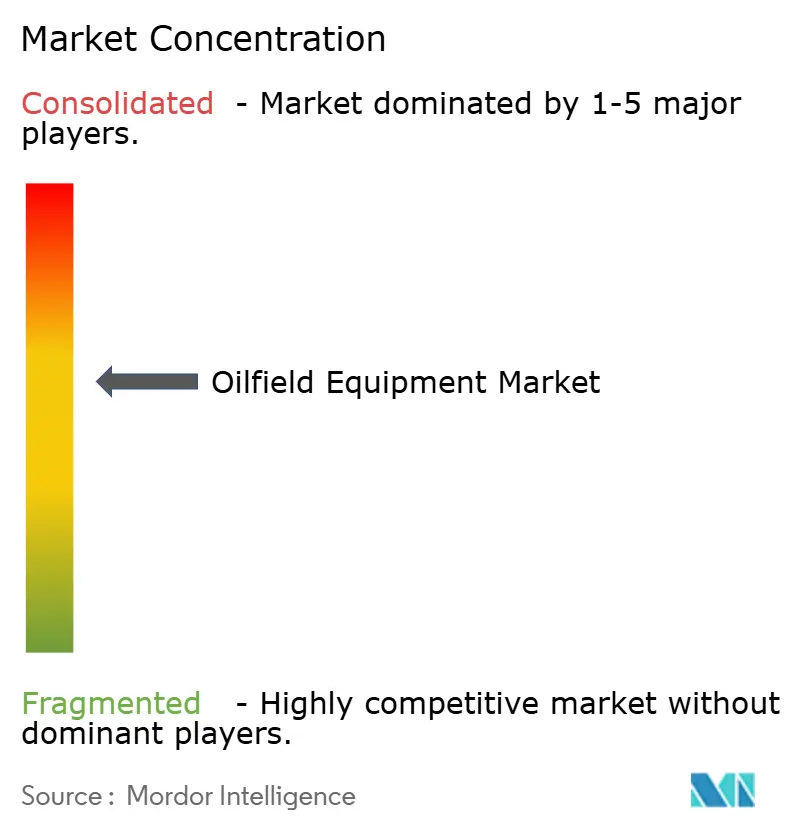
| Market Concentration | Medium |
Major Players *Disclaimer: Major Players sorted in no particular order Image © Mordor Intelligence. Reuse requires attribution under CC BY 4.0. | |
Oilfield Equipment Market Analysis by Mordor Intelligence
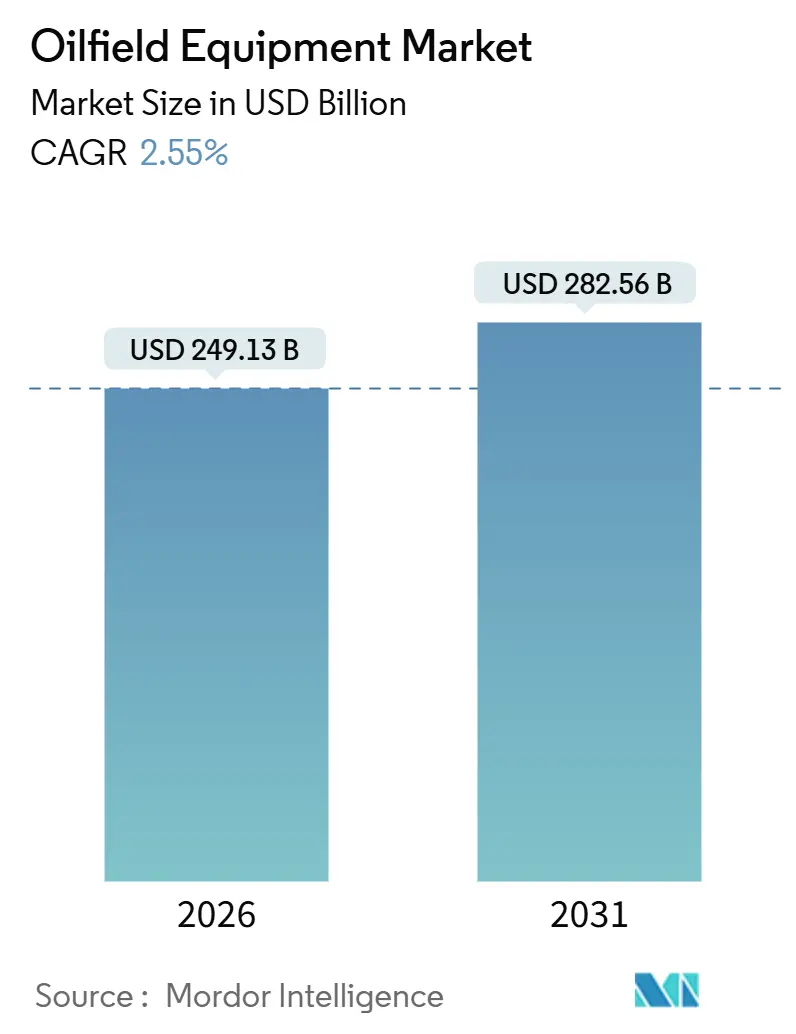
The Oilfield Equipment Market size is estimated at USD 249.13 billion in 2026, and is expected to reach USD 282.56 billion by 2031, at a CAGR of 2.55% during the forecast period (2026-2031).
Capital is gravitating toward higher-quality reservoirs, so operators are channeling budgets into ultra-deepwater developments, long-lateral shale wells, and retrofit programs that comply with methane emission rules. Longer lead times and larger upfront CAPEX characterize offshore projects, yet payback improves when Brent trades in the USD 70-85 range, a dynamic that convinced majors to approve deepwater schemes in Guyana, Brazil, and West Africa. In North America, shale producers are drilling laterals that average 3.2 km, which raises demand for heavy-duty completion gear and higher-pressure blowout preventers. Simultaneously, the U.S. Environmental Protection Agency’s methane rule, effective in 2025, accelerates replacement cycles for pneumatic controllers and legacy wellhead assemblies.
Key Report Takeaways
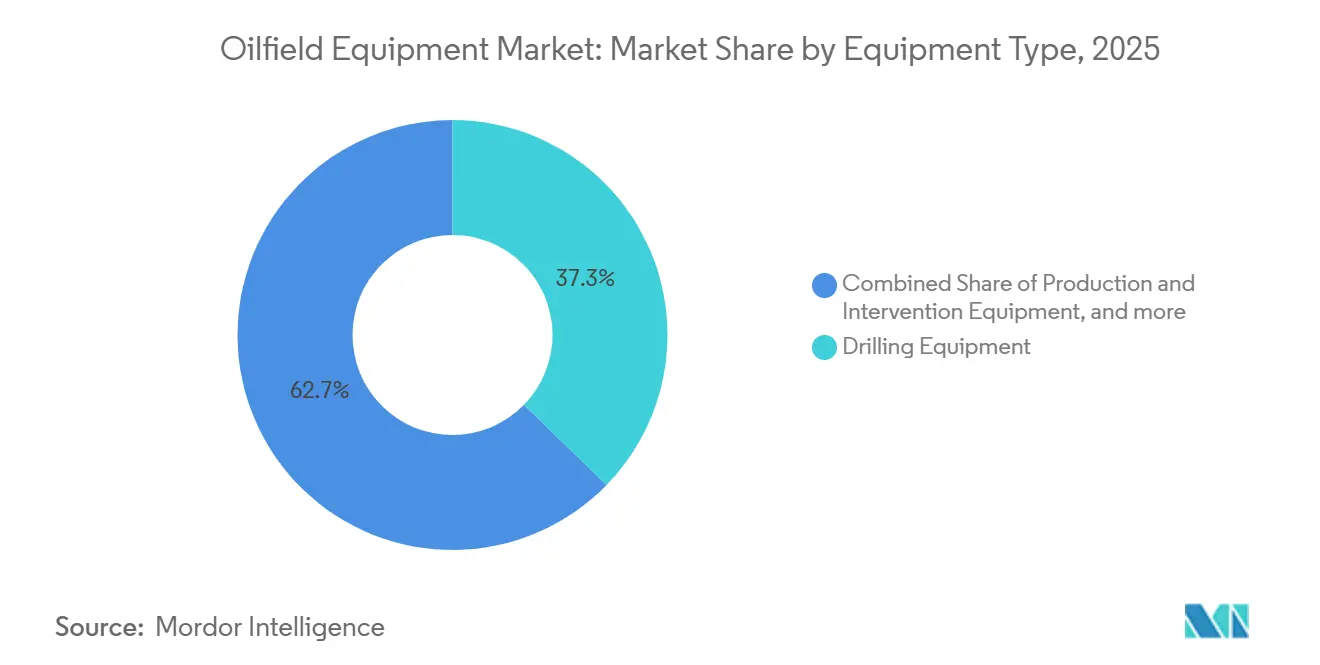
- By equipment type, drilling equipment captured 37.3% of the oilfield equipment market share in 2025 and is projected to expand at a 2.6% CAGR to 2031.
- By location, onshore operations held 66.3% of the oilfield equipment market size in 2025, while offshore operations showed the highest growth at 3.9% through 2031.
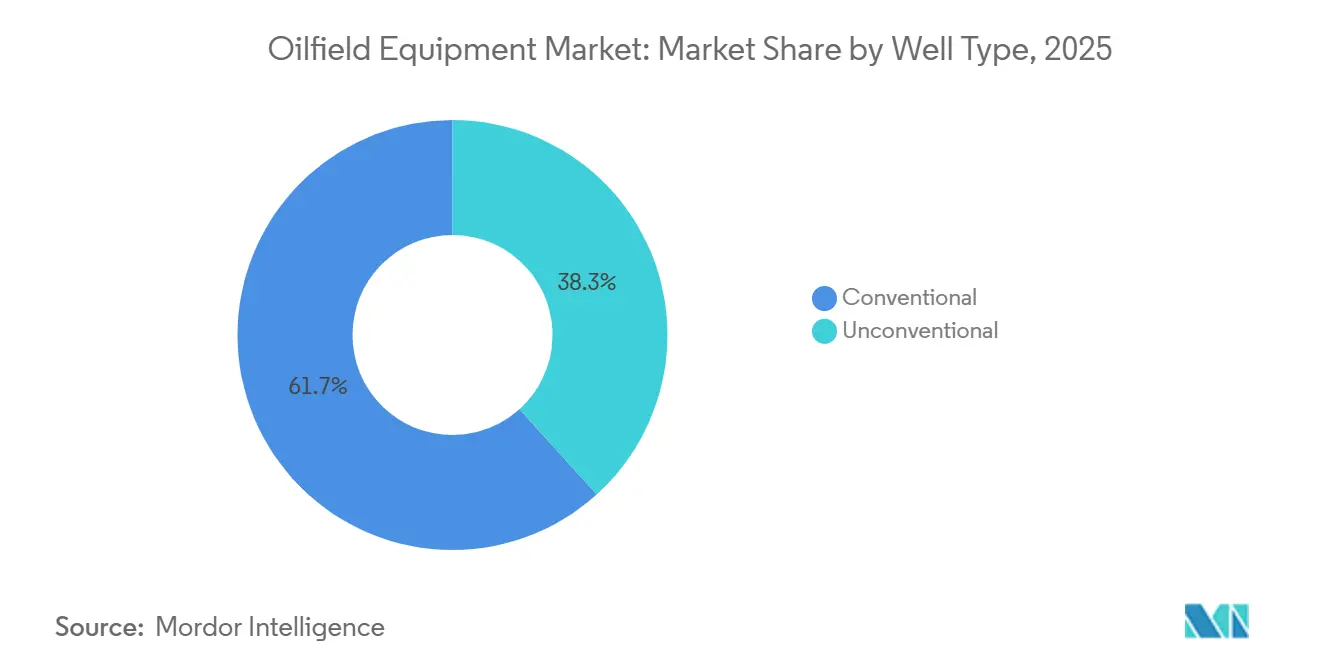
- By well type, conventional wells commanded 61.7% of the oilfield equipment market size in 2025; unconventional wells are advancing at a 3.7% CAGR through 2031.
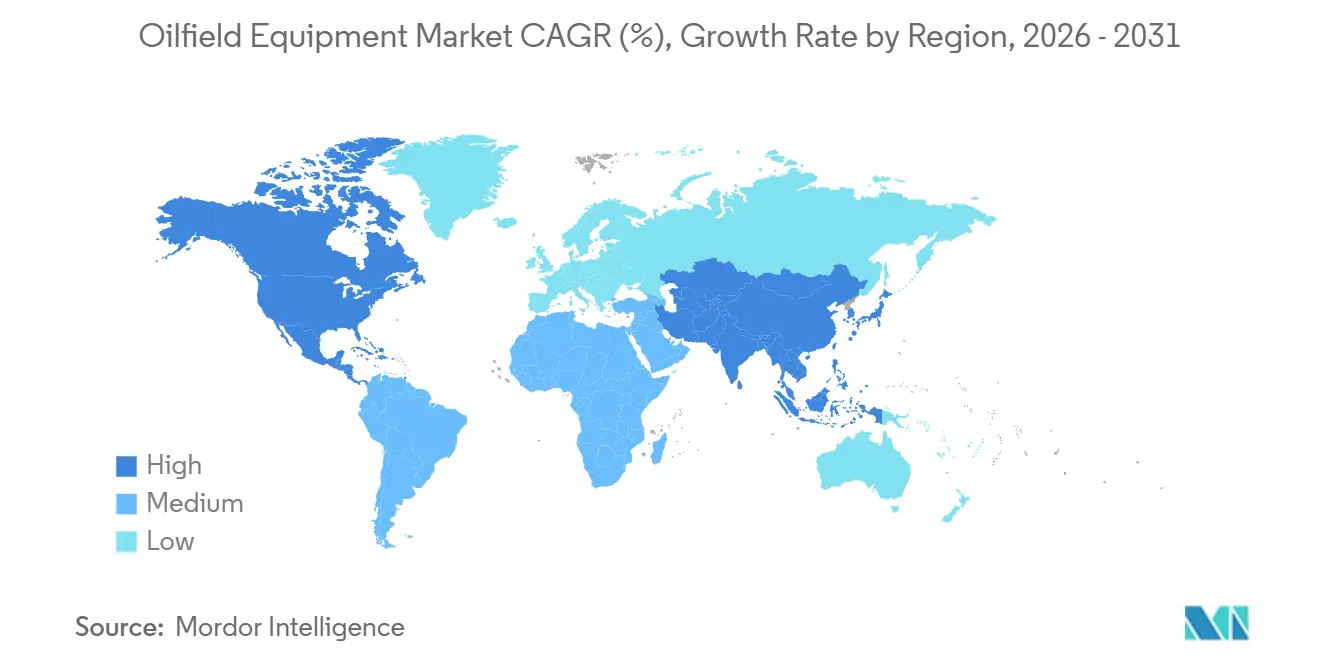
- By geography, North America led with 36.3% revenue share in 2025, and it also records the strongest regional CAGR at 3.4% to 2031.
Note: Market size and forecast figures in this report are generated using Mordor Intelligence’s proprietary estimation framework, updated with the latest available data and insights as of January 2026.
Market Trends and Insights
Drivers Impact Analysis of Oilfield Equipment Market*
| Driver | (~) % Impact on CAGR Forecast | Geographic Relevance | Impact Timeline |
|---|---|---|---|
| Rising deep- & ultra-deepwater project pipeline | 0.8% | Global, concentrated in Brazil, Guyana, West Africa, Gulf of Mexico | Medium term (2-4 years) |
| CAPEX recovery and rig-count rebound post-2024 | 0.7% | North America, Middle East, with spillover to APAC | Short term (≤ 2 years) |
| Methane-leak rules accelerating demand for low-emission BOPs | 0.5% | North America & EU, early adoption in Australia | Medium term (2-4 years) |
| Surging APAC energy demand feeding new field developments | 0.6% | APAC core (China, India, ASEAN), spillover to Australia | Long term (≥ 4 years) |
| Expansion of shale & tight-oil drilling activity | 0.6% | North America (Permian, Eagle Ford, Bakken), Argentina (Vaca Muerta), China (Sichuan Basin) | Short term (≤ 2 years) |
| Tariff-led reshoring & localization of OCTG/valves manufacturing | 0.4% | North America (US, Mexico, Canada), selective impact in EU | Medium term (2-4 years) |
| Source: Mordor Intelligence | |||
Rising Deep- & Ultra-Deepwater Project Pipeline Propels Subsea Equipment Demand
Final investment decisions for 18 deepwater projects over USD 1 billion each were reached in 2024-2025, double the tally from the prior two-year period. Brazil’s pre-salt developments, such as Búzios 9 and Mero 4, alone require 64 subsea trees and extensive flexible risers, sustaining large orders for high-specification production hardware. Guyana’s Stabroek Block added Hammerhead, Pluma, and Pickerel, all demanding sixth-generation drillships and 20,000 psi BOPs that only a handful of suppliers can provide. West Africa re-entered the queue with TotalEnergies’ USD 6 billion Kaminho project that relies on subsea tiebacks to FPSOs, which curbs breakeven to USD 35 per barrel. Regulatory influence is rising; Norway now mandates dual-shear-ram BOPs for wells deeper than 1,500 m, a benchmark insurers increasingly require worldwide.
CAPEX Recovery and Rig-Count Rebound Post-2024 Unlock Pent-Up Equipment Orders
Global upstream CAPEX climbed to USD 525 billion in 2025, a 14% jump from 2024, ending a five-year contraction.[1]International Energy Agency, “World Energy Investment 2025,” iea.org North American land-rig counts averaged 621 in 2025, up 9%, while floater utilization rose to 84%, driving day rates for ultra-deepwater drillships above USD 450,000. National Oilwell Varco’s drilling-equipment backlog hit USD 2.1 billion at year-end 2025, covering BOPs and top-drive systems scheduled through 2027, alongside demand for oil and gas static and rotating equipment across upstream operations. Producers increasingly select automated pipe-handling and real-time downhole sensors that shorten well-construction timelines by up to 20%. Middle-East NOCs ordered 52 new land rigs in 2025 to meet gas development goals, reinforcing demand for high-specification rig packages.
Methane-Leak Rules Accelerating Demand for Low-Emission BOPs and Wellhead Systems
The U.S. EPA’s methane rule obliges operators to eliminate routine flaring by 2030 and to install continuous leak detection on every well by 2027, spawning a retrofit market covering around 180,000 legacy wells.[2]United States Environmental Protection Agency, “Final Methane Rule Factsheet,” epa.gov The European Union’s analogous regulation applies to imported gas, forcing exporters to upgrade equipment or risk losing market access. Baker Hughes introduced the Aptara low-emission BOP in June 2025, using electric actuators that remove hydraulic leaks and cut maintenance by 40%. Weatherford’s zero-emission wellhead system, launched in September 2025, integrates real-time pressure monitoring, aligning with tighter leak-detection mandates. Regulators in Australia now require monthly Scope 1 reporting, nudging operators toward early equipment upgrades.
Surging APAC Energy Demand Feeding New Field Developments and Equipment Orders
Asia Pacific oil demand is projected to rise 2.1% annually through 2031, sustaining a wave of exploration and development.[3]International Energy Agency, “Oil Market Report 2025,” iea.org CNOOC sanctioned four South China Sea projects in 2025 that together need 48 subsea trees and three wellhead platforms. ONGC ordered 12 offshore rigs for the Krishna-Godavari Basin to exploit prospective gas volumes topping 1 TCF. ASEAN participation is led by the USD 3.5 billion Kasawari gas scheme in Malaysia, which incorporates subsea compression to lengthen field life. Australia’s Scarborough gas project reached FID in 2024 and requires floating production units plus 430 km of pipelines that must satisfy carbon-capture readiness standards. China now insists that all new offshore platforms include carbon-capture provisions, lifting equipment CAPEX by 5-7% but securing future emissions-trading revenues.
Restraints Impact Analysis of Oilfield Equipment Market*
| Restraint | (~) % Impact on CAGR Forecast | Geographic Relevance | Impact Timeline |
|---|---|---|---|
| Oil-price volatility undermining E&P budgets | -0.6% | Global, acute in North America shale and marginal offshore fields | Short term (≤ 2 years) |
| Rising environmental-compliance costs | -0.3% | Global, most stringent in EU, North America, Australia; emerging in APAC | Medium term (2-4 years) |
| High offshore equipment CAPEX & long payback cycles | -0.4% | Offshore-focused regions: North Sea, West Africa, deepwater Gulf of Mexico | Medium term (2-4 years) |
| Semiconductor/alloy supply-chain bottlenecks delaying deliveries | -0.3% | Global, acute in markets dependent on Asian semiconductor supply and specialty alloy imports | Short term (≤ 2 years) |
| Source: Mordor Intelligence | |||
Oil-Price Volatility Undermining E&P Budgets and Project Sanctioning
Brent crude ranged from USD 68 to USD 88 in 2025, with swings above 15% each quarter that compressed planning horizons and delayed 22% of global FIDs during the second quarter when prices dipped below USD 70.[4]U.S. Energy Information Administration, “Short-Term Energy Outlook 2025,” eia.gov Permian operators idle rigs quickly when margins narrow, creating uneven demand for completion gear. Deepwater ventures require oil above USD 60 to yield 15% returns, and volatility can defer sanction decisions by up to 18 months, dragging equipment orders with them. TechnipFMC reported that 30% of its 2025 subsea backlog contained price-contingent clauses allowing delivery deferral when Brent falls below thresholds. Smaller independents cut exploration budgets by 18% on average in 2025, reducing seismic and drilling activity.
High Offshore Equipment CAPEX and Long Payback Cycles Constraining Investment
A sixth-generation drillship costs USD 650-750 million, and a four-well subsea tieback averages USD 180 million, making offshore developments three to four times as capital-intensive as onshore wells. Payback typically stretches 7-10 years, which is unattractive when interest rates push the weighted average cost of capital above 9%. North Sea capital spending fell 11% in 2025 despite stable oil prices because aging assets and decommissioning liabilities deterred new investment. Angola and Nigeria lost operator interest in deepwater blocks due to fiscal regimes that do not cover equipment CAPEX and risk premiums. Suppliers respond with modular templates that can be relocated, cutting fabrication time by 30%, and with leasing models for ROVs and subsea tools that shift spending from CAPEX to OPEX. Norway offers tax incentives that offset some of the cost burden, whereas Brazil’s local-content rules raise sourcing complexity.
*Our forecasts treat driver/restraint impacts as directional, not additive. The impact forecasts reflect baseline growth, mix effects, and variable interactions.
Oilfield Equipment Market Segment Analysis
By Equipment Type:
Automation Gives Drilling Equipment an EdgeDrilling equipment accounted for 37.3% of the oilfield equipment market in 2025 and is projected to grow at 2.6% through 2031, propelled by automated rig-floor systems that cut non-productive time. High-pressure, high-temperature wells in the Gulf of Mexico and the North Sea require 20,000 psi BOPs that carry price tags of USD 8-12 million higher than 15,000 psi units, supporting premium margins for certified suppliers. Production and intervention tools benefit from aging wells that need artificial lift, coiled tubing, and workover rigs, while completion equipment gains from dissolvable materials that remove cleanout runs and shave USD 200,000-400,000 per well. Competitive pressure is rising from Asian fabricators, yet premium connections and corrosion-resistant alloys allow Western mills to secure 15-20% price premiums in sour-gas environments.
Electric submersible pumps, intelligent rotary steerable systems, and real-time drilling analytics illustrate how digitalization is moving from pilot phase to standard practice. Operators report 12-18% reductions in drilling days when machine-learning platforms optimize bit weight and rotary speed, savings that compound over multi-well pad developments. The oilfield equipment market continues to reward manufacturers that embed digital interfaces and remote-monitoring capabilities into hardware, positioning drilling equipment for the highest growth among the major categories.


By Location:
Offshore Momentum Outruns Onshore ScaleOnshore assets still dominate with 66.3% of revenue in 2025, yet offshore posts the fastest 3.9% CAGR to 2031 as Brazil, Guyana, and Mozambique underpin multi-billion-dollar floater programs. Petrobras plans to add 11 FPSOs between 2025-2029, each ordering subsea systems worth USD 400-600 million. Guyana’s Hammerhead FPSO, sanctioned in 2025, signals how integrated subsea-to-surface packages are becoming the procurement norm.
Onshore activity remains robust in the Permian, which averaged 11,200 wells per year during 2024-2025, translating into large orders for fracturing fleets, wellheads, and artificial-lift systems. Canada’s Montney and Duvernay basins gained momentum after new pipelines eased takeaway constraints, pushing drilling up 14% in 2025. Middle-East onshore fields are investing in enhanced oil recovery, demanding specialized pumps and separators. Differing regulations matter: Norway enforces subsea isolation valves on all new offshore wells, while U.S. onshore rules vary by state, complicating supply-chain planning.
By Well Type:
Unconventional Wells Narrow the GapConventional wells held 61.7% of revenue in 2025, yet the unconventional segment is growing at 3.7% annually, powered by long-lateral shale drilling in the United States and by rising hydraulic-fracturing adoption in Argentina and China. The oilfield equipment market size for unconventional wells is projected to rise as electric fracturing fleets cut fuel costs by 40% and remove diesel emissions, meeting both economic and ESG goals.
Argentina’s Vaca Muerta field secured a USD 2.5 billion drilling program for 180 horizontal wells scheduled through 2027, anchoring local demand for proppant logistics, plug-and-perf tools, and intelligent completion systems. China’s Sichuan Basin lifted shale-gas output 16% in 2025, aided by domestically produced fracturing pumps priced 30% below Western equivalents. In parallel, Middle-East giants are fitting intelligent well completions and downhole fiber optics on conventional wells to maximize recovery factors, which sustains a high baseline of equipment purchases.
Geography Analysis
North America Oilfield Equipment Market
North America generated 36.3% of 2025 revenue and shows the strongest 3.4% CAGR through 2031, supported by Permian consolidation, Gulf of Mexico lease auctions that yielded USD 382 million in high bids, and an uptick in Canadian oil sands drilling. The U.S. operated 621 active land rigs in 2025, while offshore output averaged 1.9 million bpd amid infrastructure upgrades that move breakevens toward USD 40-50 per barrel. Canada’s pipeline expansions unlocked incremental drilling in the Montney and Duvernay, and Mexico’s Zama field approaches peak output of 165,000 bpd in 2027, necessitating subsea kits and FPSO capacity.
MEA Oilfield Equipment Market
The Middle East and Africa follow, buoyed by USD 80 billion in combined annual upstream investment from Saudi Aramco and ADNOC, including 40 new offshore rigs and significant gas-processing expansions. Nigeria and Angola struggle with fiscal terms that depress deepwater economics, yet the Niger Delta onshore projects carry on under improved security. Technology demand shifts toward modular rigs and aggressive digitalization as NOCs chase efficiency gains.
Europe, South America and APAC Oilfield Equipment Market
Asia Pacific is the fastest-moving consumer market, driven by China’s four new offshore schemes and India’s 12-rig procurement to accelerate Krishna-Godavari exploration. Malaysia’s Kasawari gas project and Australia’s Scarborough development strengthen regional subsea equipment orders, while Japan and South Korea invest in floating LNG regasification units requiring high-pressure pumps and mooring systems. South America rests on Brazil’s pre-salt plan for 64 subsea trees between 2025-2027, whereas Argentina’s Vaca Muerta pushes unconventional purchases. Europe shows divergence: UK North Sea spending fell 11% in 2025, but Norway approved 15 new developments outfitted with electrified platforms that reduce carbon intensity.

Regulatory Landscape
Methane and air-emissions compliance remains a central equipment driver. The U.S. Environmental Protection Agency (EPA) methane framework effective in 2025 is pushing operators toward low-emission wellhead assemblies, pneumatic-controller replacements, and continuous monitoring. In April 2026, EPA finalized technical revisions to the OOOOb and OOOOc oil and gas air rules to reduce selected monitoring and temporary flaring compliance burdens, while still keeping LDAR and emissions-performance requirements in place as procurement qualifiers for field equipment and automation packages.
Offshore safety and pipeline integrity rules also keep specification thresholds tight for safety-critical hardware. In 2026, the U.S. Bureau of Safety and Environmental Enforcement (BSEE) advanced revisions to its blowout preventer (BOP) systems and well control regulations, and separately issued a final rule incorporating updated industry standards into 30 CFR Part 250 with an August 10, 2026 effective date. This reinforces third-party verification and documentation expectations for well operations and equipment. On standards, API published a new frac iron safety standard (API Standard 16FI, First Edition) in January 2026, and a 2026 PHMSA action incorporated updated ASTM steel pipe standards into US pipeline rules, tightening material and QA/QC requirements that flow through OCTG, line pipe, and related manufacturing and certification.
Competitive Landscape
The top five service majors, Schlumberger, Halliburton, Baker Hughes, Weatherford, and National Oilwell Varco, controlled about 48% of global revenue in 2025, but regional manufacturers in Asia and the Middle East offer 15-20% cost advantages on standardized equipment, pressuring margins. Digital acquisitions headline corporate strategy; Schlumberger paid USD 430 million for Aucerna in January 2025 to deepen its subsurface-software stack, while Halliburton rolled out the iCruise intelligent rotary steerable system that blends real-time formation data with automated drilling control.
Cost-focused challengers such as China’s Jereh Oilfield Services and India’s Aban Offshore win bids by underpricing Western counterparts on completion tools and workover rigs, especially in Asia and Africa. The legacy U.S. well count exceeds 1.8 million, yet only 12% have installed methane-abating hardware, signaling multiyear retrofit upside for providers with certified low-emission product lines. Technology partnerships grow: SparkCognition and Baker Hughes deployed AI-driven predictive maintenance that shortened unplanned downtime by 25%, improving equipment utilization.
Consolidation continues. Weatherford bought Altus Intervention to enlarge its well-intervention portfolio, and TechnipFMC merged subsea activities with Aker Solutions in a joint venture owning a USD 3.2 billion backlog. Suppliers must maintain API Specification 16A and ISO 13628 certifications, which elevate entry barriers and favor incumbents with global compliance footprints.
Oilfield Equipment Industry Leaders
Schlumberger Limited
Baker Hughes Company
Halliburton Company
Weatherford International PLC
National Oilwell Varco Inc.
- *Disclaimer: Major Players sorted in no particular order
Oilfield Equipment Market Companies Covered in this Report
- Schlumberger Ltd.
- Halliburton Co.
- Baker Hughes Co.
- Weatherford International plc
- National Oilwell Varco Inc.
- TechnipFMC plc
- Aker Solutions ASA
- Tenaris S.A.
- Vallourec S.A.
- Oceaneering International Inc.
- Subsea 7 S.A.
- Saipem S.p.A.
- Transocean Ltd.
- KCA Deutag
- Expro Group Holdings N.V.
- Liberty Energy Inc.
- Superior Energy Services Inc.
- NOV Inc. – Rig Technologies
- ChampionX Corp.
- Forum Energy Technologies Inc.

Market Opportunities and Future Outlook
A large near-term whitespace is emerging in emissions-driven retrofit and monitoring across legacy assets, aligned with the report context of around 180,000 legacy wells implicated by US methane compliance timelines (continuous leak detection by 2027 and tighter flaring constraints toward 2030). That is translating into demand for upgraded pneumatic controls, low-leak wellheads, and electrified or low-emission actuation on safety and flow-control equipment. It is also creating pull-through for suppliers that bundle hardware with digital measurement, diagnostics, and maintenance workflows, consistent with the low-emission BOP and wellhead launches highlighted in 2025.
A second opportunity pocket is the scale-up of complex offshore and gas-linked infrastructure, which requires high-spec subsea production systems, boosting areas such as and turbomachinery. Recent project actions provide visible pull: SLB OneSubsea secured a subsea boosting award for bp at Thunder Horse (June 2026), and SLB OneSubsea also won an EPC scope for Eni Baleine Phase 3 (July 2026), supporting demand for subsea trees, umbilicals, manifolds, and metering for deepwater developments. In gas, Reuters reported IEA commentary that global investment in natural gas projects rose to about USD 330 billion in 2026 (May 2026). Separately, Delfin Midstream issued a Limited Notice to Proceed to Siemens Energy for long-lead equipment for its FLNG2 project offshore Louisiana (July 2026), supporting equipment needs spanning compression, rotating equipment, controls, and oilfield-to-export infrastructure.
Recent Industry Developments in Oilfield Equipment Market
- July 2026: Halliburton won integrated drilling and completions contracts for TotalEnergies-operated GranMorgu deepwater development offshore Suriname. The award formalizes an integrated execution model combining digital workflows, automation, and service delivery, which raises demand for higher-specification drilling and completion equipment packages aligned to deepwater performance and schedule requirements.
- May 2026: Baker Hughes extended and expanded an integrated well construction contract with Petrobras. The continuation strengthens multi-year equipment and service pull-through for well construction, supporting utilization of high-value drilling and pressure-control equipment and reinforcing supplier positioning in Brazil's offshore development cycle.
- October 2024: Petrobras awarded Baker Hughes contracts to deliver 77 km of flexible pipe systems for Brazil's pre-salt fields, including risers and flowlines for production plus gas and water injection. The scope underpins sustained manufacturing and installation activity for offshore production hardware, and it supports larger subsea-to-surface package demand as pre-salt projects scale.


Oilfield Equipment Market Report Scope and Research Methodology
Market Definition and Coverage
For this study, the oilfield equipment market is counted as the revenue earned from equipment used to drill, complete, intervene, and produce oil and gas wells across onshore and offshore fields. We measure it in USD and track it at the point of sale into upstream operations.
Scope exclusions: We exclude pure oilfield services labor-only revenue, as well as midstream and downstream plant equipment that is not used at the wellsite.
Segments Covered in This Report
- By Equipment Type
- Drilling Equipment
- Production and Intervention Equipment
- Completion Equipment
- Other Equipment Types
- By Location
- Onshore
- Offshore
- By Well Type
- Conventional
- Unconventional
- By Geography
- North America
- United States
- Canada
- Mexico
- Europe
- Norway
- United Kingdom
- Russia
- Netherlands
- Germany
- Rest of Europe
- Asia Pacific
- China
- India
- Japan
- South Korea
- ASEAN Countries
- Australia
- Rest of Asia Pacific
- South America
- Brazil
- Argentina
- Colombia
- Rest of South America
- Middle East and Africa
- Saudi Arabia
- United Arab Emirates
- Iran
- Nigeria
- South Africa
- Rest of Middle East and Africa
- North America
Data Sources, Market Sizing, and Validation
Desk Research
Desk research is used to map the demand environment, then narrow it into equipment spending signals. We reference public datasets such as the US EIA for drilling and production trends, the International Energy Agency for upstream outlooks, and Baker Hughes rig counts to track activity shifts over time.
To keep equipment assumptions grounded, we also check sources such as OPEC and national statistics agencies for production context, plus regulator and customs releases where trade flows are visible for key mechanical and electronic packages. Company filings, investor presentations, and reputable press coverage are used to interpret pricing language and order patterns. Paid subscriptions for company financials and shipment-level import and export databases are used selectively to fill gaps. These desk sources are illustrative rather than exhaustive, and other public documents were also reviewed for data collection, validation, and clarification.
Primary Interviews and Surveys
Primary interviews and short surveys are used to test assumptions that desk sources cannot show clearly, especially how spending splits across drilling, completion, intervention, and production needs when activity changes. We speak with equipment OEMs, distributors, integration teams, and upstream operators across APAC, EMEA, and the Americas, so the input ranges reflect basin economics and contracting styles.
Distribution of primary research fieldwork respondents
| Company type | Respondent position | Region |
|---|---|---|
| Top tier: 39% | CXOs: 15% | APAC: 39% |
| Mid tier: 46% | Functional/Unit leaders: 39% | EMEA: 34% |
| Smaller Players: 15% | Managers: 46% | Americas: 27% |
Market-Sizing & Forecasting
Sizing begins with a top-down build that converts upstream activity into an equipment demand pool. The model tracks region-level drilling and well work cadence, then applies equipment intensity and replacement patterns to translate activity into addressable equipment revenue, which is converted to USD using a consistent timing basis.
Inputs watched closely include active rig counts, new well starts, well completion counts, intervention frequency in mature fields, and upstream capex direction. Pricing is handled through average selling price bands by major equipment groups, then adjusted using observed steel and component cost pressure and what buyers report on discounting and lead times. To keep totals realistic, selective bottom-up checks are added, such as sampled volume times ASP for common equipment packages, and partial supplier revenue roll-ups for product lines where public disclosure is available.
Forecasts use scenario analysis supported by multivariate relationships between upstream spending, oil price bands, and activity indicators, and then the final path is refined through expert views on project timing and replacement cycles. When evidence is incomplete in smaller geographies, conservative penetration and utilization assumptions are applied, and the impact is rechecked against regional activity and trade signals.
Data Validation & Update Cycle
Results are validated through multiple checks, where model outputs are compared against independent signals such as capex guidance trends, rig count direction, and reported order backlogs. Outliers are flagged early, and unit assumptions, pricing steps, and currency conversions are rechecked before figures move to review.
A second analyst reviews the model logic and key drivers. If large variances appear, we follow up with selected respondents. Reports are refreshed annually, and interim updates are made when material events occur, such as sharp oil price moves, major sanction changes, or a step-change in drilling activity. Before delivery, a final pass is completed so clients receive an updated view aligned with the latest available indicators.
Mordor Intelligence's Oilfield Equipment Market Size Compared Against Other Published Estimates
Published market sizes for oilfield equipment can look far apart, even when the topic sounds identical, because each publisher draws the scope and timing differently. The biggest differences usually come from what is counted as equipment versus services, how onshore and offshore packages are treated, and which year is used as the current estimate.
The spread also widens when exchange rates and pricing are taken at different points in the year, or when average selling prices are carried forward without checking the latest lead times and discounting behavior. When ASP bands are refreshed using recent order and backlog checks and currency timing is applied consistently around the 2026 reference year, Mordor Intelligence reduces drift that can occur when older price points are reused.
Benchmark comparison
| Source | Market Size | Gaps in Research Methodology |
|---|---|---|
| Mordor Intelligence | USD 249.13 B (2026) | |
| Industry Publisher A | USD 132.42 B (2025) | Uses a different current year and often applies a narrower equipment lens that is closer to drilling and surface packages, which can leave out parts of completion, intervention, and production equipment demand. |
| Global Publisher B | USD 141.60 B (2025) | Relies on a 2025 snapshot and may smooth pricing across the cycle with broader averages, which can understate revenue when delivery mix and quoted prices change during the year. |
Overall, the table shows that year choice, scope boundaries, and pricing carry-forward methods can move the reported market by a wide margin. Our process keeps the total traceable to activity indicators and a repeatable price build, and then it is checked with supplier and buyer feedback so the final number stays usable for planning.


Key Questions Answered in the Report
How large is the oilfield equipment market in 2026 and how fast is it growing?
The market size stands at USD 249.13 billion in 2026 and is on course to reach USD 282.56 billion by 2031, expanding at a 2.55% CAGR.
Which equipment type holds the biggest revenue share?
Drilling equipment leads with a 37.3% share in 2025, benefiting from automation that cuts well-construction time and boosts safety.
Which region shows the highest growth momentum through 2031?
North America records the fastest regional 3.4% CAGR, underpinned by Permian shale activity and Gulf of Mexico deepwater leasing.
What driver most influences future spending on oilfield gear?
Rising deep- and ultra-deepwater projects, particularly in Brazil and Guyana, add +0.8% to forecast CAGR by expanding subsea equipment demand.
How are methane rules affecting equipment demand?
U.S. and EU methane regulations spur immediate retrofits of pneumatic controllers, low-emission BOPs, and real-time monitoring systems across about 180,000 wells.
Page last updated on:


 Your data is secure and never sold or shared.


