
Oil Condition Monitoring Market Size and Share
Market Overview
| Study Period | 2020 - 2031 |
|---|---|
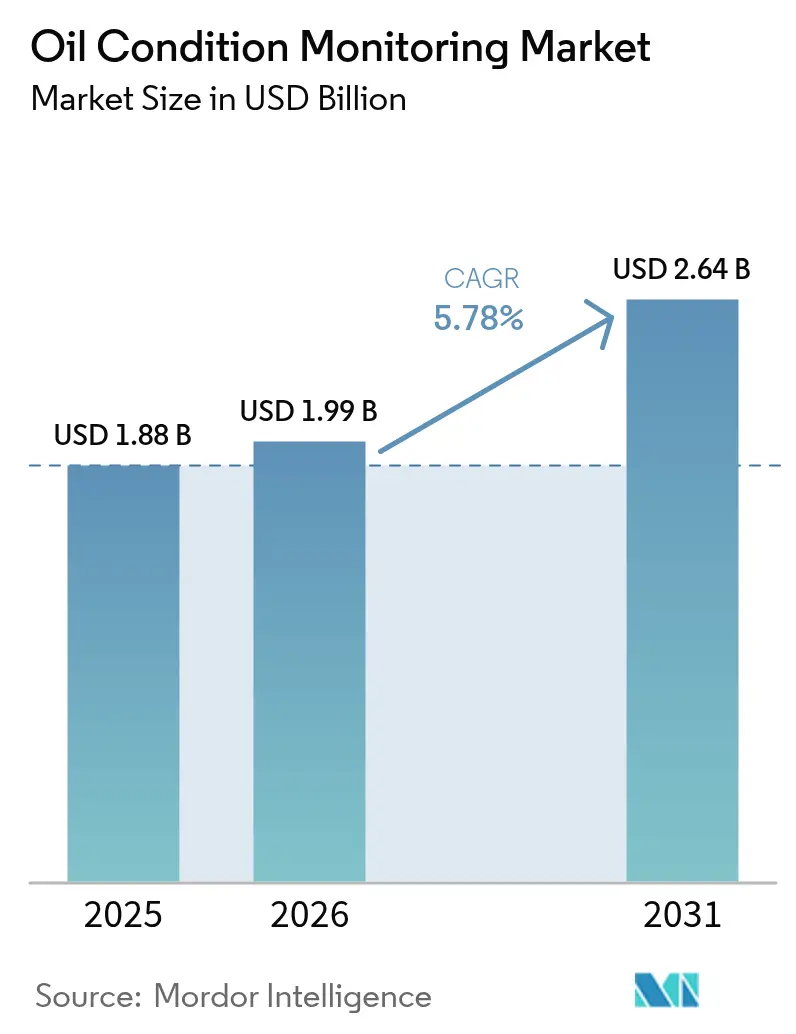
| Market Size (2026) | USD 1.99 Billion |
| Market Size (2031) | USD 2.64 Billion |
| Growth Rate (2026 - 2031) | 5.78 % |
| Fastest Growing Market | Asia Pacific |
| Largest Market | North America |
| Market Concentration | Medium |
Major Players *Disclaimer: Major Players sorted in no particular order Image © Mordor Intelligence. Reuse requires attribution under CC BY 4.0. | |
Oil Condition Monitoring Market Analysis by Mordor Intelligence
The oil condition monitoring market size is expected to grow from USD 1.88 billion in 2025 to USD 1.99 billion in 2026 and is forecast to reach USD 2.64 billion by 2031 at 5.78% CAGR over 2026-2031. Growth is fueled by rapid adoption of predictive maintenance programs, especially in capital-intensive sectors where unplanned downtime invites significant operating losses. IoT-enabled sensors now transmit lubricant quality data to cloud platforms, allowing real-time diagnostics that replace calendar-based sampling. Energy security concerns have encouraged LNG carrier owners and offshore wind operators to install continuous wear-debris monitors, while tightening sustainability rules in Europe and North America boost demand for analytics that extend oil life. Competitive intensity has increased as bearing manufacturers, sensor specialists, and digital-twin software firms converge around integrated asset-health ecosystems, widening the addressable customer base within the oil condition monitoring market.
Key Report Takeaways
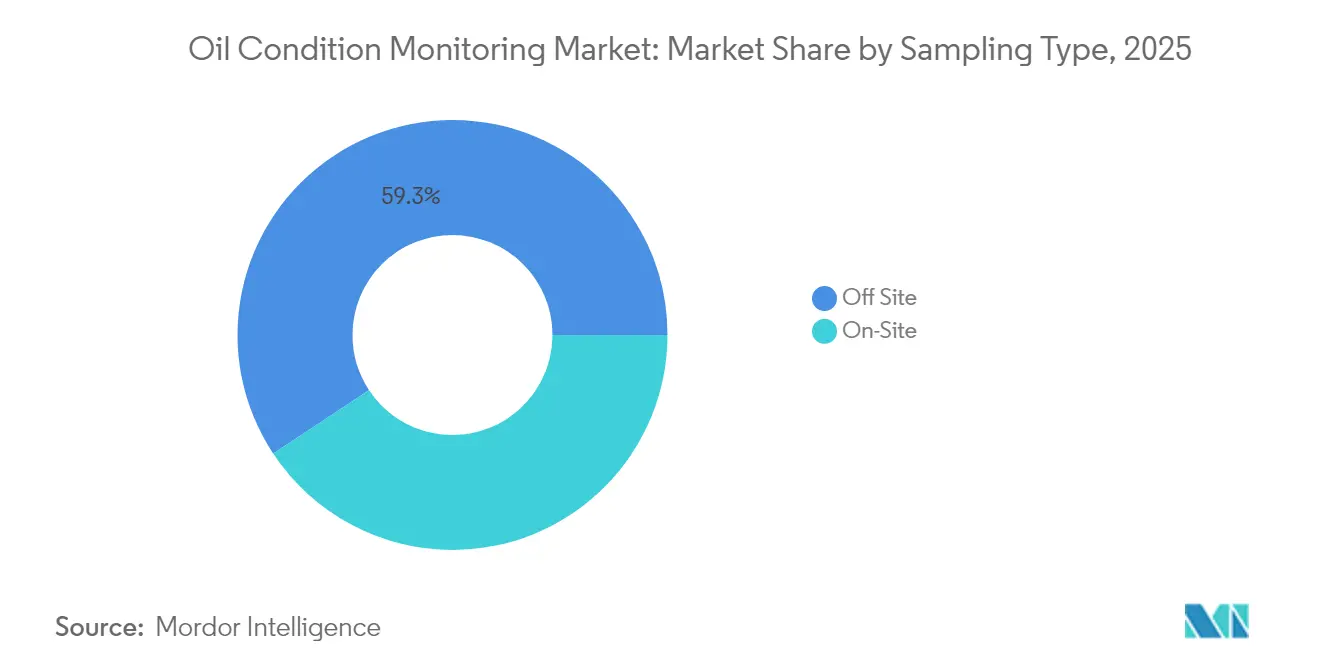
- By sampling type, off-site laboratory services led with 59.30% revenue share in 2025; on-site systems are advancing at a 9.02% CAGR through 2031.
- By equipment application, engines captured 31.80% of the oil condition monitoring market share in 2025, while hydraulic systems post the highest 8.72% CAGR to 2031.
- By sensor technology, viscosity sensors accounted for 23.60% share of the oil condition monitoring market size in 2025; ferrous debris counters are forecast to expand at an 11.12% CAGR.
- By service offering, laboratory testing commanded 54.40% of the oil condition monitoring market size in 2025; software and analytics platforms lead future growth at 12.45% CAGR.
- By end-user, oil & gas contributed 27.60% of the oil condition monitoring market in 2025; renewable energy is the fastest-growing vertical at 9.66% CAGR.
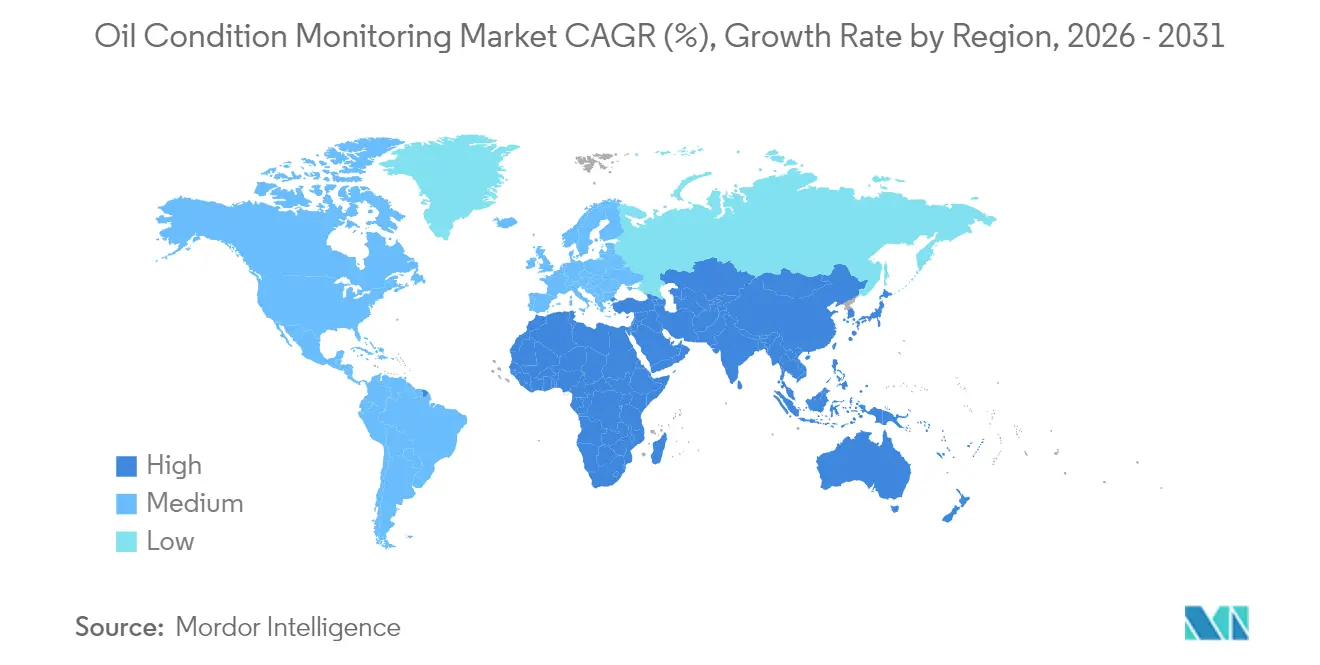
- Regionally, North America dominated with a 34.55% share in 2025, while Asia-Pacific is set to record the fastest 8.05% CAGR.
Note: Market size and forecast figures in this report are generated using Mordor Intelligence’s proprietary estimation framework, updated with the latest available data and insights as of 2026.
Market Trends and Insights
Drivers Impact Analysis of Oil Condition Monitoring Market*
| DRIVER | (~) % IMPACT ON CAGR FORECAST | GEOGRAPHIC RELEVANCE | IMPACT TIMELINE |
|---|---|---|---|
| OEM warranty mandates on lubricant analytics | +0.8% | North America | Short term (≤ 2 years) |
| Offshore wind gearbox failures spurring debris sensors | +0.7% | Europe | Medium term (2-4 years) |
| LNG fleet expansion requiring real-time monitoring | +0.9% | Asia-Pacific & Middle East | Long term (≥ 4 years) |
| Digital-twin programs in Canadian oil sands | +0.5% | North America | Medium term (2-4 years) |
| Mining-insurance incentives for wear monitoring | +0.4% | South America | Short term (≤ 2 years) |
| EU CSRD sustainability rules on oil-life extension | +0.6% | Europe | Long term (≥ 4 years) |
| Source: Mordor Intelligence | |||
OEM warranty mandates
North American heavy-duty OEMs have started tying extended engine warranties to routine submission of oil spectrography reports, driving accelerated uptake of the oil condition monitoring market within dealer networks. The program reduces OEM liability by catching early contamination and wear, while fleet operators gain longer engine life and optimized drain intervals. Major Class-8 truck builders now bundle sensor kits with power-train service contracts, nudging independent maintenance shops toward cloud-based dashboards that can ingest OEM telematics feeds. As warranty cost avoidance is quantified in predictive models, CFOs reallocate budgets from reactive repairs to predictive analytics subscriptions. Adoption remains highest in fleets with 300-plus vehicles that amortize sensor investments quickly.[1]
Offshore wind gearbox failures
Europe’s offshore wind segment experiences gearbox replacement costs that exceed USD 200,000 per turbine, creating a robust business case for inline ferrous-debris monitors. Operators use real-time metal-particle counts to shift from calendar-based drains to data-dictated interventions, reducing crane-vessel deployments in harsh North Sea conditions. Sensor retrofits integrate with SCADA platforms and feed digital twins that model torque, vibration, and lubricant contamination concurrently. EU and UK subsidy structures penalize non-availability, so operators favor technologies that guarantee high service factors. Vendors offering pre-calibrated AI models gain traction because they reduce commissioning complexity, shrinking the payback period to under 18 months.
LNG fleet expansion
Asia-Pacific and Middle East shipyards have a combined orderbook exceeding 200 LNG carriers for delivery through 2030. The engines and cryogenic cargo pumps aboard these vessels demand pristine oil films under fluctuating load profiles, making real-time condition monitoring indispensable. Classification societies now recommend viscosity and PQ-index sensors for dual-fuel two-stroke engines, spurring orders for multiparameter probes rated to Zone 0 hazardous areas. Cloud connectivity enables shore-side engineers to trend wear rates across fleets and pre-position spares before dry-dock windows. As charterers insert uptime clauses in long-term contracts, shipowners view continuous monitoring as a compliance and revenue-assurance tool, accelerating growth of the oil condition monitoring market.
Digital-twin programs in Canadian oil sands
Surface mining assets in Alberta encounter abrasive contaminants that accelerate lubricant degradation. Producers deploy digital twins that fuse load, temperature, and oil chemistry, predicting component failure up to four weeks in advance. Pilot projects on 797F haul trucks recorded a 70% cut in downtime and a USD 2.5 million annual maintenance saving per fleet. Data platforms interface with pit-dispatch systems, balancing production scheduling against maintenance windows. Vendor collaborations focus on edge analytics that filter high-frequency data locally, reducing satellite bandwidth costs and mitigating cybersecurity risks associated with remote sites.
Restraints Impact Analysis of Oil Condition Monitoring Market*
| RESTRAINTS | (~) % IMPACT ON CAGR FORECAST | GEOGRAPHIC RELEVANCE | IMPACT TIMELINE |
|---|---|---|---|
| Capex Burden of Online Sensors for ASEAN SMEs | -0.9% | ASEAN core, spill-over to other emerging markets | Short term (≤ 2 years) |
| Legacy SCADA Integration Issues in US Midstream Pipelines | -0.7% | North America, some EU applications | Medium term (2-4 years) |
| Shortage of Tribologists in African Power Utilities | -0.5% | Sub-Saharan Africa, expanding to Middle East | Long term (≥ 4 years) |
| Ferrography Consumable Supply Disruptions in Eastern Europe | -0.4% | Eastern Europe, spill-over to Central Asia | Short term (≤ 2 years) |
| Source: Mordor Intelligence | |||
Capex Burden of Online Sensors for ASEAN SMEs
Small and medium enterprises across ASEAN markets face significant capital expenditure constraints that limit adoption of online oil condition monitoring systems, despite clear operational benefits. The ASEAN SME Policy Index 2024 highlights that SMEs contribute 64.6% of regional employment and 38.3% to GDP, yet face persistent challenges in accessing capital for technology investments. Online sensor systems typically require USD 5,000-15,000 initial investment per monitoring point, representing a substantial financial barrier for manufacturing SMEs operating on thin margins. The region's heavy reliance on fossil fuels, with oil demand expected to increase 20% by 2035 and annual import bills exceeding USD 200 billion, creates additional cost pressures that limit discretionary technology spending.[2]
Legacy SCADA Integration Issues in US Midstream Pipelines
Aging SCADA infrastructure across U.S. midstream pipeline networks creates substantial technical and economic barriers to implementing modern oil condition monitoring systems. The Center for Midstream Management and Science identifies aging infrastructure as a critical industry concern, with many pipeline operators struggling to integrate new monitoring technologies with legacy control systems. SCADA systems installed 15-20 years ago often lack the communication protocols and processing capabilities required for real-time oil analytics integration, necessitating expensive infrastructure upgrades that can cost millions of dollars per facility.
*Our forecasts treat driver/restraint impacts as directional, not additive. The impact forecasts reflect baseline growth, mix effects, and variable interactions.
Oil Condition Monitoring Market Segment Analysis
By Sampling Type:
Off-site Dominance, On-site MomentumOff-site laboratory testing commanded 59.30% of the oil condition monitoring market in 2025 as heavy industry continued to rely on accredited labs for comprehensive elemental and contamination analyses. The model offers deep data sets but introduces lags between sampling and decision-making, sometimes leading to reactive maintenance. Large refineries and power plants maintain yearly contracts with regional labs covering ICP, FTIR, and ferrous density tests. However, courier delays and manual data entry remain pain points.
On-site systems are the fastest-growing segment, expanding at a 9.02% CAGR as IoT mini-labs shrink footprint and cost. Portable viscometers and infrared spectrometers now fit into ruggedized cases, allowing technicians to cut turnaround time from days to minutes. Plants with continuous processes appreciate the closed-loop feedback that lets them adjust load profiles or filtration regimes immediately. Subscription models offer calibration services and cloud dashboards that archive historic trends across multiple sites. By 2031, on-site deployments could erode the oil condition monitoring market share of external labs among mid-tier manufacturers while labs pivot toward data science services.

By Equipment Application:
Engine Reliability Tops, Hydraulics AccelerateEngines remained the largest application, holding 31.80% of the oil condition monitoring market share in 2025. High-speed rotating parts create metal wear, soot, and acid that demand early detection. Commercial marine, mining haul trucks, and standby power gensets increasingly embed cylinder-liner wear models in enterprise maintenance planning. Extended drain intervals driven by low-sulfur and bio-blend fuels further underline the need for precise lubricant chemistry insights.
Hydraulic systems are projected to grow at 8.72% CAGR as factory automation and mobile equipment sophistication rise. Electrohydraulic actuators in injection-molding lines and precision presses rely on contaminant-free fluids to sustain micron-level tolerances. OEMs now pre-install 4-14 µm particle counters and moisture sensors that alert control-room PLCs in real time. With every unscheduled hydraulic failure reputed to cost USD 12,000 per hour in automotive stamping plants, operators justify sensor investments within a single incident avoidance. The oil condition monitoring market size for hydraulics will expand further as the global motion-control base broadens.
By Sensor Technology:
Viscosity Platforms Lead, Debris Counters SurgeViscosity sensors contributed 23.60% of revenue in 2025 thanks to their broad applicability across engines, turbines, and compressors. As next-generation 0W-20 oils enter heavy-duty fleets under 2027 EPA rules, viscosity monitoring remains central to warranty compliance. Continuous-reading MEMS viscometers, such as the SPL571 from Cambridge Applied Systems, now output kinematic values directly to cloud dashboards.
Ferrous-debris counters are forecast to log the fastest 11.12% CAGR, especially in offshore wind and mining. Hall-effect and inductive technologies detect sub-5 µm particles that predict bearing pitting well before vibration shifts signal damage. As gearbox manufacturers warrant availability under energy-as-a-service contracts, embedded debris counters become standard, adding recurring analytics revenue for vendors. This dynamic will enlarge the oil condition monitoring market size in high-torque applications through 2031.
By Service Offering:
Laboratory Testing Dominates, Software Takes OffLaboratory testing represented 54.40% of the oil condition monitoring market size in 2025. Accredited labs remain indispensable for root-cause failure analysis, especially after warranty claims. They also benchmark additive depletion profiles for formulating drain-interval extensions. Yet their dominance is thinning as analytics platforms post a 12.45% CAGR, reflecting the pivot toward real-time decision support.
Software vendors bundle dashboards, machine-learning models, and ERP connectors that close the loop between detection and work-order generation. Predictive scoring algorithms correlate lubricant anomalies with process data, quantifying failure probability and financial risk. As plants adopt OEE-based performance incentives, maintenance teams rely on heat-map visualizations that prioritize interventions. The oil condition monitoring market will witness greater value migration from hardware to SaaS by decade-end.

By End-User:
Oil & Gas Largest, Renewables FastestOil & gas operators accounted for 27.60% of global spending in 2025. Complex assets such as compressor trains, drilling rigs, and FPSOs operate in harsh conditions where lubricant degradation can trigger safety incidents. National oil companies therefore embed analytics into brownfield upgrades to maintain asset integrity during life-extension projects. The sector’s cyclic CAPEX can, however, temper year-to-year growth.
Renewable-energy owners are projected to record a 9.66% CAGR, reflecting the massive scale-up of offshore wind and utility-scale solar trackers. Stakeholders look to minimize lifecycle emissions not only through clean power generation but also through circular maintenance. Gearbox-oil life-extension goals align with EU CSRD reporting, helping developers secure green financing. As installed wind capacity crosses 190 GW offshore by 2030, the oil condition monitoring market will pivot from conventional fuels toward clean-energy infrastructure.
Geography Analysis
North America Oil Condition Monitoring Market
North America led the oil condition monitoring market with 34.55% revenue share in 2025. Stringent CAFE fuel-efficiency targets and forthcoming 2027 heavy-duty engine oil viscosity standards compel fleets to adopt real-time viscometers, bolstering supplier revenue. Legacy SCADA in midstream pipelines restrains sensor retrofits, yet federal funding for critical-infrastructure upgrades may unlock latent demand.
Europe Oil Condition Monitoring Market
Europe remains the technology incubator, leveraging offshore wind deployment and circular-economy regulations to push oil-life-extension solutions. The EU CSRD forces manufacturers to disclose lubricant conservation metrics, turning compliance into a board-level priority. Scandinavian shipowners also prepare for the Arctic heavy-fuel-oil ban by Transport Canada, investing in condition monitoring to ensure alternative fuels maintain viscosity within safe ranges.
APAC Oil Condition Monitoring Market
Asia-Pacific is the fastest-growing region at 8.05% CAGR as industrialization, LNG fleet growth, and mining automation converge. Governments raise safety standards in petrochemical complexes, creating opportunities for cloud-linked sensors. Yet small and mid-size enterprises face capital constraints, prompting vendors to roll out leasing schemes. In emerging ASEAN markets, off-site labs still dominate, although falling hardware costs will slowly tilt share toward in-plant online sensors, expanding the overall oil condition monitoring market.
Regulatory Landscape
Compliance in oil condition monitoring is increasingly shaped by standards that formalize sampling, interpretation, and condition-based maintenance evidence for lubricants and hydraulic fluids. ISO 14830-1:2019 (tribology-based condition monitoring) was confirmed as an active international standard on March 27, 2025, and is commonly cited alongside ASTM practices such as ASTM D6224-23 for in-service monitoring of lubricating oil in auxiliary power plant equipment.
Environmental and chemical-management rules also pull lubricant analytics into audit trails and electronic reporting. In the United States, the EPA has advanced electronic reporting and instrument monitoring approaches through air programs, including March 2026 final amendments to NESHAP for chemical manufacturing process units (CMPUs) that require electronic reporting and instrument monitoring programs for equipment leaks, and an April 2026 EPA proposal preamble for O&G NESHAP that extends control standards to additional emission points. In Europe, REACH and CLP remain the core disclosure frameworks for industrial lubricant chemistry, while Digital Product Passport requirements under ESPR (Regulation 2024/1781) introduce a traceability anchor. A chemical-sector registry rollout referenced for July 19, 2026 increases the value of standardized, digitally accessible oil-condition records.
Value Chain Analysis
The value chain covers (1) sensing and instrumentation (viscosity, dielectric, wear-debris, and multiparameter probes), (2) data acquisition and edge connectivity (gateway/SCADA/PLC interfaces and cybersecurity controls), (3) analytics layers (rules-based diagnostics through ML models and digital twins), and (4) service execution, including on-site programs and off-site laboratory networks that run ICP, FTIR, and ferrography for confirmation and root-cause analysis. Recent vendor activity reflects a shift from periodic lab reports toward integrated platforms: Cambridge Applied Systems launched the SPL571 real-time viscometer in March 2025, and Kongsberg Digital expanded digital-twin capabilities for midstream operations in January 2025 with higher-density real-time monitoring that supports API-driven links into EAM/CMMS workflows.
Downstream distribution and delivery typically combine OEM/dealer channels, especially where warranty-linked oil analytics are embedded in service contracts, lubrication suppliers, and independent labs that provide sampling kits, logistics, and trend reports. Partnerships between lubricant brands and AI or condition-monitoring specialists are strengthening this mix by bundling lubricant expertise with analytics and alerting, while component sourcing for electronics and sensors remains a practical bottleneck that can extend lead times for online monitoring deployments and encourage phased rollouts focused on critical assets.
Competitive Landscape
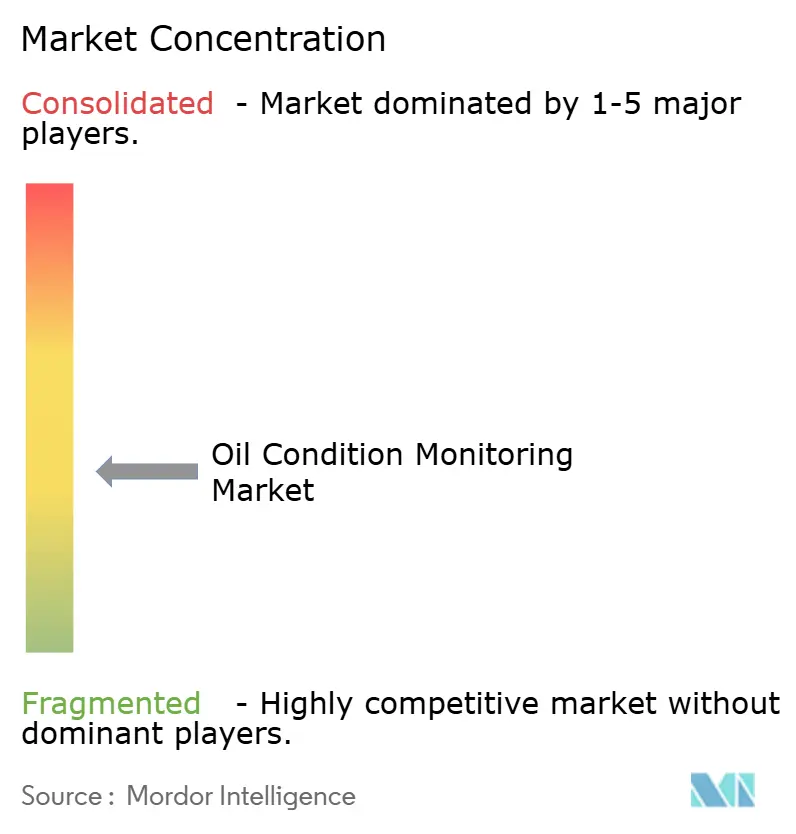
The oil condition monitoring market exhibits moderate fragmentation. Major bearing suppliers, sensor boutiques, and software specialists overlap in value propositions, fueling partnerships and M&A. SKF’s SEK 550 million acquisition of John Sample Group in 2024 expanded its lubrication-management footprint and distribution presence in Southeast Asia. Similar vertical integrations aim to pair mechanical expertise with data sciences, allowing turnkey asset-health solutions.
Sensor innovators focus on multiparameter devices that measure viscosity, dielectric constant, and ferrous debris in one probe, cutting installation costs and simplifying analytics. Cambridge Applied Systems launched the SPL571 viscometer capable of delivering dashboard-ready readings, demonstrating the shift toward plug-and-play designs. AI start-ups add anomaly-detection layers that flag deviations earlier than threshold rules, differentiating offerings in a price-sensitive market.
Cloud-based software platforms battle for enterprise contracts by integrating with EAM and ERP suites. Vendors highlight cybersecurity certifications and low-latency edge architectures to win contracts in regulated utilities. As recurring SaaS revenue rises, equipment manufacturers embed software subscriptions in hardware pricing, blurring competitive lines. Market leaders offer joint warranties covering sensor hardware, data analytics, and on-site service, reinforcing switching costs and increasing market concentration.
Oil Condition Monitoring Industry Leaders
-
General Electric Company
-
Exxon Mobil Corporation
-
Chevron Corporation
-
Shell plc
-
TotalEnergies SE
- *Disclaimer: Major Players sorted in no particular order
Oil Condition Monitoring Market Companies Covered in this Report
- General Electric Company
- Shell plc
- Chevron Corporation
- BP plc (Castrol)
- Exxon Mobil Corporation
- TotalEnergies SE
- Parker-Hannifin Corporation
- Eaton Corporation plc
- Emerson Electric Co.
- SKF AB
- Spectro Scientific (AMETEK Inc.)
- Intertek Group plc
- SGS SA
- Bureau Veritas SA
- ALS Limited
- Techenomics International
- TestOil (Insight Services Inc.)
- C.C. Jensen A/S
- Poseidon Systems LLC
- WearCheck International
- Delta Services Industriels (DSi)
- Lubrication Engineers Inc.
- Hy-Pro Filtration
Market Opportunities and Future Outlook
Software-defined oil condition monitoring that stitches together on-site test results, continuous sensors, and historical lab baselines into automated maintenance actions inside CMMS/EAM environments is forming a clearer whitespace. This is being reinforced by commercial rollouts that productize cloud analytics for lubricant health, including AMETEK Spectro Scientific's May 2026 launch of TruVu 360 Fluid IQ, positioned to integrate onsite oil testing with historical data via predictive algorithms. As more end users move from periodic sampling to mixed architectures such as portable FTIR, inline wear debris, and viscosity measurement, vendors that provide pre-built integrations to industrial data stacks, along with governance features for audit-ready records, have room to expand within capital-intensive verticals including marine, pipelines, mining, and power generation.
Another opportunity is field-ready instrumentation that reduces dependence on centralized labs without sacrificing diagnostic depth. Portable spectroscopy and compact analyzers extend coverage to remote assets and time-sensitive applications, which suits offshore wind, LNG shipping, and dispersed industrial sites where sample logistics can add latency. With EU frameworks such as REACH/CLP and the Digital Product Passport under ESPR (Regulation 2024/1781) pushing more structured product and chemical data management, standardized and shareable oil-condition datasets across operators, OEMs, and lubricant suppliers create room for differentiation around traceability, comparability, and secure cross-site benchmarking for vendors.
Recent Industry Developments in Oil Condition Monitoring Market
- July 2026: PT ExxonMobil Lubricants Indonesia expanded its predictive maintenance service footprint to seven locations, combining the MACHINEXT platform with Mobil Lubricant Analysis. The expansion increases local service availability for condition-based programs and supports scaling oil analytics beyond single-site pilots into multi-location industrial maintenance routines.
- May 2026: AMETEK Spectro Scientific introduced TruVu 360 Fluid IQ, an analytics and intelligence solution designed to integrate onsite oil analysis with historical data for predictive maintenance. By packaging data fusion and algorithms into a deployable platform layer, it supports faster conversion of test results into actionable reliability decisions across fleets of assets.
- April 2026: Gastops launched FluidSIGHT, a real-time oil condition monitoring system for marine and industrial applications that enables continuous insight into engine health. Continuous monitoring strengthens the business case for shifting from calendar-based sampling to in-operation diagnostics, particularly where uptime and safety requirements penalize delayed detection of lubricant degradation.
Oil Condition Monitoring Market Report Scope and Research Methodology
Market Definition and Coverage
We define this market as the revenue generated from oil condition monitoring solutions that measure lubricant health to support predictive maintenance in rotating and hydraulic equipment. Coverage includes on-site monitoring, off-site laboratory testing, and the related hardware and software used to capture, analyze, and report oil condition results.
Scope exclusions: Excludes vibration or thermal condition monitoring when no oil sampling or oil sensing is involved, and excludes lubricant production and bulk oil sales.
Segments Covered in This Report
- By Sampling Type
- On-Site (On-board, Fixed Continuous Monitoring)
- Off-Site (Laboratory-based)
- By Product / Equipment Type
- Turbines
- Engines
- Gear Systems
- Hydraulic Systems
- Compressors
- By Sensor / Measurement Type
- Viscosity Sensors
- Temperature Sensors
- Pressure Sensors
- Dielectric Constant Sensors
- Ferrous Debris Counters
- TAN/TBN Analyzers
- Soot and Oxidation Meters
- Water and Fuel Dilution Detectors
- By Service Offering
- Hardware and Inline Instrumentation
- Software and Analytics Platforms
- Laboratory Testing Services
- By End-user Industry
- Transportation (Road, Rail, Aviation)
- Oil and Gas
- Industrial Manufacturing
- Mining
- Power Generation
- Marine
- Aerospace and Defense
- Renewable Energy (Wind, Solar Thermal)
- By Geography
- North America
- United States
- Canada
- Mexico
- Europe
- United Kingdom
- Germany
- France
- Italy
- Rest of Europe
- Asia-Pacific
- China
- Japan
- India
- South Korea
- Rest of Asia-Pacific
- Middle East
- Israel
- Saudi Arabia
- United Arab Emirates
- Turkey
- Rest of Middle East
- Africa
- South Africa
- Egypt
- Rest of Africa
- South America
- Brazil
- Argentina
- Rest of South America
- North America
Data Sources, Market Sizing, and Validation
Desk Research
Desk research is used to set the guardrails for the market model and to align definitions across industries that rely on lubricants. We relied on public materials such as U.S. Energy Information Administration statistics for industrial and power activity signals, International Energy Agency datasets for energy and industrial output trends, and USGS and national mining statistics for equipment-heavy sectors.
To keep the model workable, we also took additional context from sources such as ISO and ASTM pages for oil analysis methods, customs and trade statistics for equipment movements tied to condition monitoring programs, and peer-reviewed tribology and maintenance journals for sampling intervals and failure-mode indicators. We reviewed company filings, investor presentations, association websites, and reputable press for product mix and adoption cues, and we used paid subscriptions for company financials and patent databases to sanity-check innovation intensity. These desk sources are not exhaustive, and many other public references were used to collect, validate, and clarify data points.
Primary Interviews and Surveys
Primary work was used to pressure-test assumptions that are hard to confirm from public sources, like typical sampling frequency, common test panels, and how pricing changes by asset criticality. We spoke with a mix of service providers, equipment operators, and solution specialists across APAC, EMEA, and the Americas, and we ran the same discussion topics across power generation, mining, transportation, and oil and gas to confirm where adoption patterns differ.
Distribution of primary research fieldwork respondents
| Company type | Respondent position | Region |
|---|---|---|
| Top tier: 36% | CXOs: 17% | APAC: 40% |
| Mid tier: 46% | Functional/Unit leaders: 40% | EMEA: 33% |
| Smaller Players: 18% | Managers: 43% | Americas: 27% |
Market-Sizing & Forecasting
Sizing started with a top-down build where the demand pool was reconstructed from equipment populations that regularly use lubricants and from typical oil sampling and monitoring frequencies by asset class. Once annual test activity was approximated, it was converted to value using a blended price stack that reflects common panels (such as viscosity, water, wear metals, and oxidation) plus the share for sensors, data reporting, and program support.
To keep the totals grounded, results were checked with selective bottom-up approximations, including sampled average selling prices multiplied by estimated test counts, and channel checks on how spend splits between on-site programs and off-site lab work. Key inputs used include sampling intervals by end user, test panel breadth and pricing, share of continuous sensing versus periodic sampling, installed base trends for turbines, engines, gear systems, and hydraulics, and industrial output indicators that influence maintenance intensity. Forecasts were developed using scenario analysis, where adoption and pricing assumptions were adjusted based on expert consensus around reliability budgets, digitization of maintenance workflows, and sector investment cycles, and gaps were handled with ranges that were tightened through follow-up validation.
Data Validation & Update Cycle
Outputs were validated through several checks so the market total stays consistent with observable signals. We compared implied test volumes and spend per asset against independent indicators, and outliers were flagged when a region or end-use result drifted away from expected equipment activity patterns.
Before sign-off, the model and assumptions go through multi-step analyst reviews, and re-contacts are triggered when material variances appear or when new product or pricing signals emerge. The report is refreshed annually, with interim updates when major events affect demand or pricing, and a final pre-delivery pass is completed so clients receive the latest updated view.
Mordor Intelligence's Oil Condition Monitoring Market Sizing Compared With Other Published Estimates
Published market sizes for oil condition monitoring can differ even when the topic looks similar, because the services counted, the year chosen, and the pricing logic are not consistent across publishers. In day-to-day client discussions, the biggest differences usually come from whether lab testing, on-site hardware, and software analytics are all included, and how adjacent condition monitoring tools are treated.
Some external estimates roll broader predictive maintenance spending into the total, including non-oil techniques, and they may also apply a single blended spend per site. For Mordor Intelligence, revenue is counted only when oil analysis or oil sensing is explicitly part of the program, and the sizing is tied back to equipment-linked sampling cadence and test-panel pricing instead of generalized maintenance budgets.
Benchmark comparison
| Source | Market Size | Gaps in Research Methodology |
|---|---|---|
| Mordor Intelligence | USD 1.99 B (2026) | |
| Global Consultancy A | USD 1.81 B (2024) | Uses an earlier base year and a broader framing that can blend in non-oil condition monitoring or general maintenance spend, which shifts totals even when end users overlap. |
| Industry Research House B | USD 2.02 B (2024) | Assumes faster penetration of continuous sensing and a steeper pricing progression in 2024, with fewer explicit checks against test-panel mix and sampling cadence by equipment type. |
The spread across the table mainly reflects base-year choice and how tightly each model is anchored to oil-specific activity measures, such as tests per asset and panel pricing. When those drivers are stated clearly and then cross-checked with expert feedback, the final number becomes easier to reproduce and to update as adoption patterns change.
Key Questions Answered in the Report
What is the current size of the oil condition monitoring market?
The oil condition monitoring market is valued at USD 1.99 billion in 2026 and is forecast to reach USD 2.64 billion by 2031 at a 5.78% CAGR.
Which region leads the oil condition monitoring market?
North America leads with a 34.55% share, driven by stringent emission and warranty regulations.
What segment within equipment applications is growing the fastest?
Hydraulic systems are advancing at a 8.72% CAGR, outpacing engines in growth momentum.
How are regulations influencing market demand?
EPA low-viscosity oil standards, EU CSRD sustainability reporting, and Arctic heavy-fuel-oil bans compel industries to adopt real-time oil monitoring solutions.
Why are on-site systems gaining traction over laboratory services?
On-site systems cut sample-to-decision time from days to minutes, enabling immediate corrective action and reducing unplanned downtime.
Which technology trend offers the largest efficiency gains?
Digital-twin platforms that integrate oil analytics with operational data have demonstrated up to 70% reductions in unplanned downtime for heavy equipment fleets.