
Market Overview
| Study Period | 2021 - 2031 |
|---|---|
| Market Size (2026) | USD 77.59 Billion |
| Market Size (2031) | USD 92.56 Billion |
| Growth Rate (2026 - 2031) | 3.59 % |
| Fastest Growing Market | Asia Pacific |
| Largest Market | North America |
| Market Concentration | Low |
Major Players *Disclaimer: Major Players sorted in no particular order Image © Mordor Intelligence. Reuse requires attribution under CC BY 4.0. | |
Oil And Gas Midstream Market Analysis by Mordor Intelligence
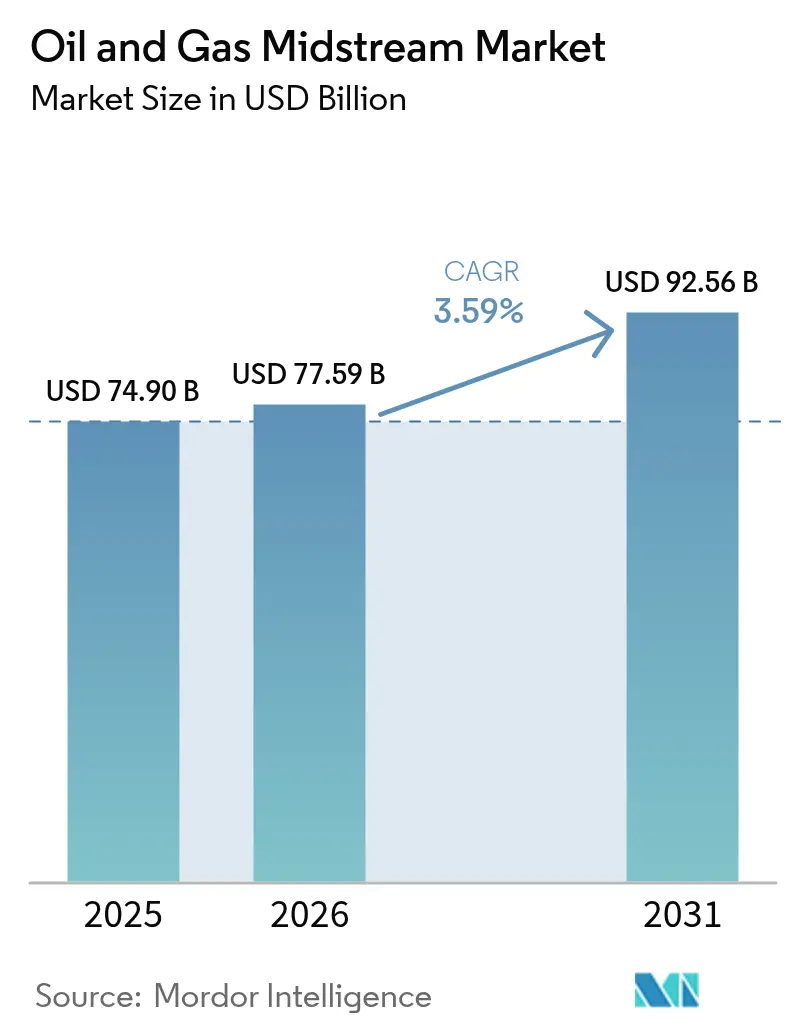
The Oil And Gas Midstream Market size was valued at USD 74.90 billion in 2025 and estimated to grow from USD 77.59 billion in 2026 to reach USD 92.56 billion by 2031, at a CAGR of 3.59% during the forecast period (2026-2031).
Rising U.S. liquefied natural gas (LNG) export capacity, a rapid shift in Asian fuel‐mix preferences, and improving pipeline replacement economics collectively boost project backlogs and lift tariff revenues. Consolidation among master limited partnerships (MLPs) enlarges infrastructure footprints, widens basin optionality, and unlocks operating synergies. Supply-demand volatility tied to renewable energy integration continues to drive up storage values, while cybersecurity and environmental, social, and governance (ESG) considerations influence capital allocation and funding costs.
Key Report Takeaways
- By infrastructure, pipelines commanded 45.02% of the oil and gas midstream market share in 2025, and storage facilities are projected to post the fastest growth rate of 5.14% CAGR through 2031.
- By product type, natural gas accounted for 39.47% of the market in 2025, while LNG is projected to register the highest segmental CAGR of 6.41% over 2026-2031.
- By service type, transportation and logistics led with a 40.12% share of the oil and gas midstream market in 2025 and is likely to grow the fastest, at a 4.44% CAGR over 2026-2031.
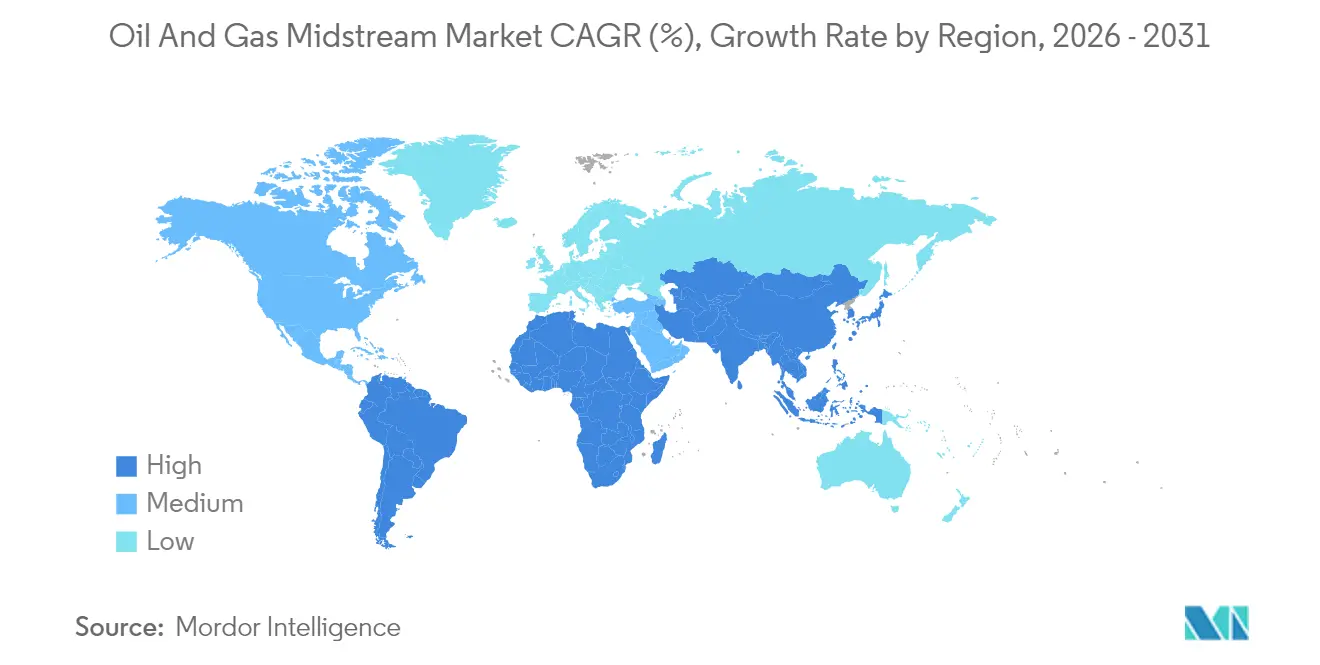
- By geography, North America accounted for 30.22% of the market in 2025, and the Asia-Pacific region is set to record the strongest 4.74% regional CAGR during the forecast period.
Note: Market size and forecast figures in this report are generated using Mordor Intelligence’s proprietary estimation framework, updated with the latest available data and insights as of 2026.
Market Trends and Insights
Drivers Impact Analysis of Oil And Gas Midstream Market*
| Driver | (~) % Impact on CAGR Forecast | Geographic Relevance | Impact Timeline |
|---|---|---|---|
| Surging U.S. LNG export capacity build-out | +1.20% | North America with spillover to global shipping routes | Medium term (2-4 years) |
| Rising Asian gas demand shifting global flow patterns | +0.90% | Asia-Pacific core, extending to Middle-East supply corridors | Long term (≥ 4 years) |
| North American crude-by-rail replacement with pipelines | +0.50% | North America, concentrated in Permian and Canadian oil-sands regions | Medium term (2-4 years) |
| Aging onshore pipelines requiring replacement CAPEX | +0.70% | Global, most acute in North America and Europe | Long term (≥ 4 years) |
| Modular FLNG deployment for stranded gas assets | +0.60% | Southeast Asia and West Africa | Medium term (2-4 years) |
| Growing gas-storage demand to manage renewable intermittency | +0.60% | Global, especially Asia-Pacific and Europe | Short term (≤ 2 years) |
| Source: Mordor Intelligence | |||
Surging U.S. LNG export capacity build-out
U.S. LNG export capacity is on track to rise 80% by 2028 as new Gulf Coast terminals come online. The projects enable the country to supply nearly one-third of global LNG by 2030, spurring investments in upstream gathering, processing, and trunkline infrastructure.(1) Cheniere Energy reported USD 4.6 billion Q2 2025 revenue alongside USD 1.6 billion net income, highlighting robust earnings visibility under long-term take-or-pay agreements. Federal Energy Regulatory Commission approvals dictate construction pacing, yet favorable contract coverage and rising Asian demand keep final investment decisions on track. Liquefaction developers are increasingly partnering with midstream MLPs to secure feed gas and reduce balance-sheet strain.
Rising Asian gas demand shifting global flow patterns
Morgan Stanley projects 5% annual Asian gas consumption growth through 2030, dwarfing 1% in Europe.(2) China imported 79 million tonnes of LNG in 2024 and plans to connect 150 million more residents to pipelines by 2030. India’s 27 million-tonne LNG tally in 2024, up 20% from 2023, aligns with a five-year plan to serve 30 million new consumers. Rising imports stimulate the construction of regasification terminals, storage caverns, and last-mile distribution grids. The demand wave reshapes shipping routes, drives longer-tenor offtake agreements, and underpins LNG-linked midstream tariffs. It also encourages U.S. exporters to secure destination-flexible contracts that capitalize on arbitrage.
Crude-by-rail replacement with pipelines
North American crude-by-rail movements continue to cede share to pipelines as new takeaway capacity cuts transport costs and spill risks. The Matterhorn Express Pipeline commenced operations in November 2024 with a 2.5 Bcf/d gas capacity, indicative of cross-commodity infrastructure development. Permian and Canadian oil sands producers secure multi-year transport contracts to lock in egress and eliminate rail discounts. States tighten rail safety rules, pushing shippers toward safer pipelines, while carbon reduction goals favor lower-emission transport modes. Midstream developers utilize brownfield corridors to expedite permitting and reduce capital intensity.
Aging onshore pipelines requiring replacement CAPEX
Many North American pipelines have surpassed 40 years of operation, coinciding with stricter regulations from the Pipeline and Hazardous Materials Safety Administration. Enterprise Products Partners advanced the Athena gas processing plant, which has a 300 MMcf/d capacity, to integrate with replacement lines and increase recoveries. New materials and fiber-optic monitoring reduce spill frequencies and lower long-term maintenance costs. Utilities accelerate parallel-loop projects to eliminate integrity digs and boost throughput. Replacement CAPEX sustains construction backlogs, lifts service revenues, and supports fee escalators tied to inflation.
Restraints Impact Analysis of Oil And Gas Midstream Market*
| Restraint | (~) % Impact on CAGR Forecast | Geographic Relevance | Impact Timeline |
|---|---|---|---|
| Heightened ESG-driven capital scarcity | −0.8% | Global, most pronounced in Europe and North America | Medium term (2-4 years) |
| Volatile oil-price outlook dampening long-term contracts | −0.6% | Global, with particular impact on crude midstream | Short term (≤ 2 years) |
| Cybersecurity threat premium on midstream assets | −0.5% | Global, concentrated in North American pipeline systems | Short term (≤ 2 years) |
| Renewable-energy growth creating execution risks for LNG jobs | −0.4% | Southeast Asia | Medium term (2-4 years) |
| Source: Mordor Intelligence | |||
Heightened ESG-driven capital scarcity
Large banks continue to tighten their lending to fossil fuels, prompting mid-tier lenders and private equity firms to bridge the resulting funding gaps. Sustainability-linked bonds are gaining traction as operators tie coupon step-ups to methane intensity targets. Mission Secure reports that cyber-hardened facilities cut insurance costs by USD 50,000 per site each year, partially offsetting higher financing spreads.(3) Project developers also explore public-private partnerships to align energy-security goals with environmental mandates. Delays in capital formation lead to contingency budgets and extend payback periods.
Volatile oil price outlook dampening long-term contracts
Spot-market crude swings deter shippers from locking into 10-year transportation deals, constraining pipeline earnings visibility. Counterparties favor volume-based over acreage-dedicated commitments, shifting volume risk back to operators. MLPs respond by diversifying into gas and NGL corridors that enjoy firmer demand. Hedging strategies grow more sophisticated as marketers blend physical storage with futures to manage volatility. While short-term pain suppresses tariff escalations, diversified asset portfolios cushion cash flows.
*Our forecasts treat driver/restraint impacts as directional, not additive. The impact forecasts reflect baseline growth, mix effects, and variable interactions.
Oil And Gas Midstream Market Segment Analysis
By Infrastructure:
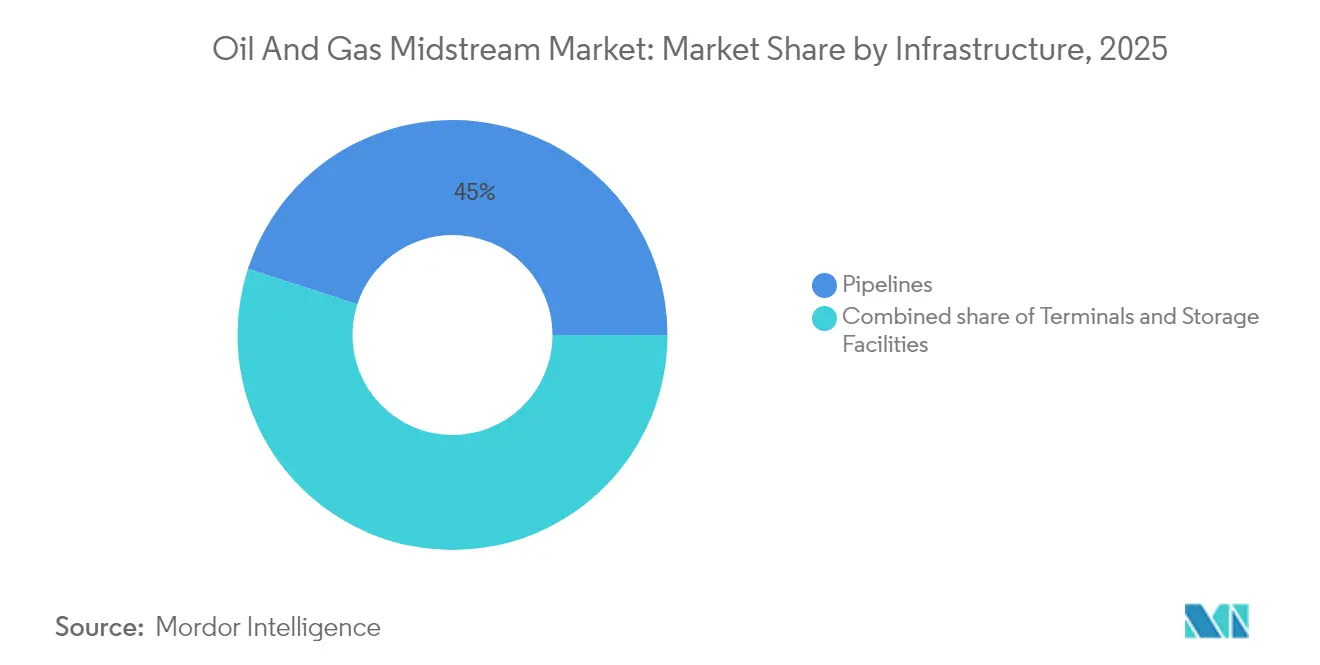
Storage Facilities Drive Capacity ExpansionThe oil and gas midstream market size for pipelines stood at USD 33.72 billion in 2025, equal to 45.02% share, confirming the segment’s backbone status. Storage, however, is projected to expand at a 5.14% CAGR, the fastest among infrastructure categories, as power grids need flexible gas withdrawal to balance renewable intermittency. Enstor’s Mississippi Hub expansion is expected to increase working gas to 56.3 Bcf by 2028, a 2.5-fold increase that highlights investor interest in cavern assets. EnLink’s Jefferson Island Storage will add 8 Bcf capacity under long-term take-or-pay agreements, highlighting how utility customers value seasonal balancing. Cavern projects benefit from favorable geology, low operating cost, and revenue uplift from arbitrage trading between summer injection and winter withdrawal spreads.
Terminals play a critical role in supporting LNG imports, exports, and coastal refined product distribution. Bulgaria’s Chiren facility completed a 20% capacity step-up in 2024 to fortify regional supply resilience. Dubai awarded Baker Hughes its largest integrated compressor contract for the Margham expansion to manage solar-driven demand swings. Terminal operators integrate automation and advanced metering to trim boil-off gas losses and comply with International Maritime Organization regulations. Combined, these investments expand the oil and gas midstream market by raising fee-based revenue streams and enhancing network reliability.

By Product Type:
LNG Acceleration Reshapes Traditional Gas FlowsNatural gas held a 39.47% slice of the oil and gas midstream market share in 2025, reflecting its dominant throughput volume. LNG outpaces all segments with a 6.41% CAGR through 2031 as Shell projects global demand to rise 60% by 2040. China’s 79 million-tonne import volume and India’s 27 million-tonne surge in 2024 strain regasification and storage capacity, accelerating the need for pipeline tie-ins. Marine LNG demand is projected to exceed 16 million tonnes annually by 2030, driving the development of new bunkering infrastructure along major shipping lanes. U.S. Gulf Coast liquefaction terminals anchor upstream gathering systems that transport shale gas from the Permian, Eagle Ford, and Haynesville plays under fixed-margin agreements.
Crude oil volumes face contract headwinds linked to price volatility; however, pipeline optimizations and blending services help mitigate margin erosion. Refined-product corridors innovate with drag-reducing agents and real-time batch tracking to optimize line pack. NGLs benefit from petrochemical growth and propane export arbitrage. Altogether, product diversification shields the oil and gas midstream industry from cyclical exposure, maintaining growth trajectories intact.
By Service Type:
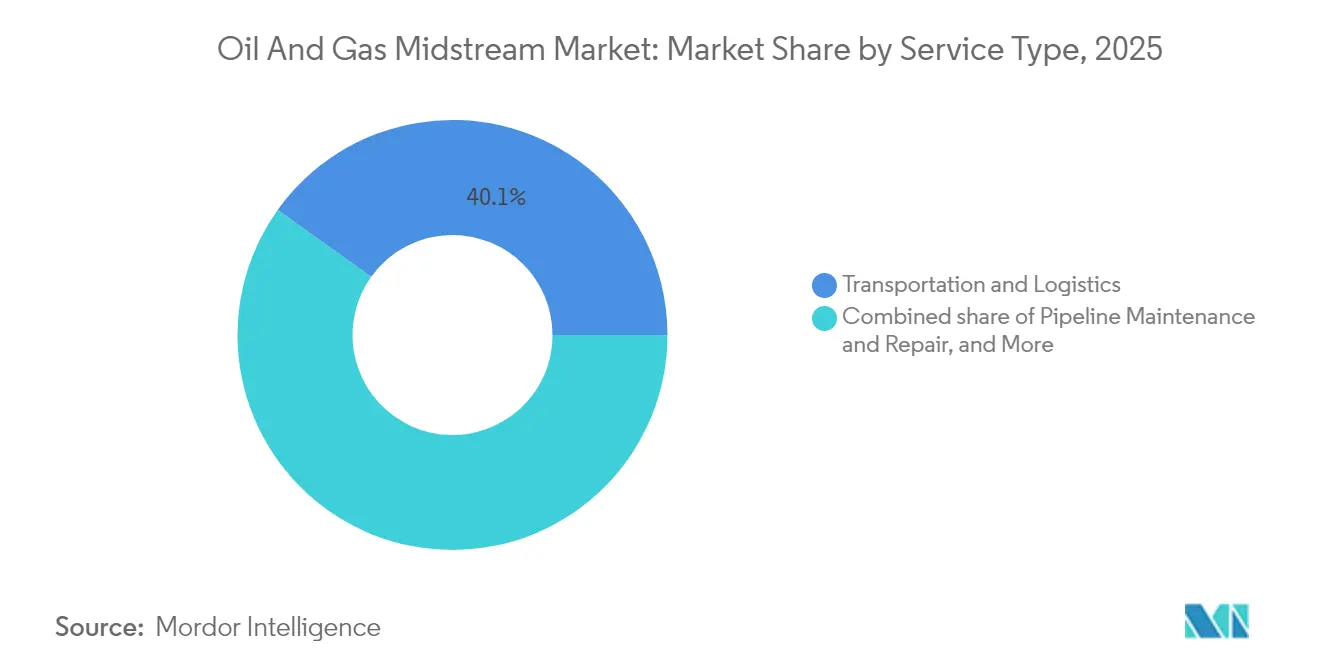
Transportation and Logistics Consolidate Market PositionTransportation and logistics services captured 40.12% of the oil and gas midstream market size in 2025 and led growth at a 4.44% CAGR. Complexity in global trade flows lifts demand for end-to-end scheduling, tariff optimization, and capacity marketing. Howard Energy Partners' Nueva Era Pipeline connects Eagle Ford gas to Monterrey's industrial demand, highlighting the value of cross-border logistics. Vaquero Midstream's 70-mile extension near Waha Hub pairs with a 200 MMcf/d plant to elevate system utilization to 800 MMcf/d. Service providers layer software-defined networking and predictive maintenance to minimize downtime and monetize uncommitted capacity.
Pipeline construction and repair services secure steady workloads from replacement and expansion projects. Storage handling services leverage cavern pressure management know-how and multi-cycle withdrawal rights to extract incremental revenue. Taken together, integrated offerings reinforce customer stickiness, extend contract tenors, and deepen barriers to entry across the oil and gas midstream market.
Geography Analysis
North America Oil and Gas Midstream Market
North America's oil and gas midstream market size reached USD 22.64 billion in 2025, accounting for a 30.22% share, driven by established networks, regulatory clarity, and robust LNG export pipelines. Permian Basin gathering buildouts, such as Matterhorn Express, and Enterprise's Midland Basin acquisitions, highlight a pivot from greenfield to optimization projects. Replacement CAPEX and brownfield loopings dominate spend, while cybersecurity mandates from the Transportation Security Administration widen compliance budgets.
APAC Oil and Gas Midstream Market
The Asia-Pacific region advances at a 4.74% CAGR through 2031, the swiftest among all regions, as coal-to-gas switching accelerates. Countries target household pipeline penetration and peak-shaving storage, driving demand for steel pipes and the rollout of compressive stations. LNG import share eclipses indigenous supply growth, prompting flexible contract structures indexed to Henry Hub rather than oil-linked Japan Korea Marker prices. Geopolitical diversification strategies favor U.S. and Qatari cargoes, reducing the risk of single-supplier dependence and increasing voyage-charter activity.
EMEA and South America Oil and Gas Midstream Market
Europe moderates as energy-security upgrades converge with decarbonization imperatives that prioritize hydrogen networks. South America channels investment to offshore pre-salt gas monetization, notably in Brazil. The Middle East and Africa rely on modular floating LNG to monetize remote fields, while regional storage expansions act as a buffer against seasonal demand spikes. Collectively, these geographically diverse investments sustain a balanced growth profile for the oil and gas midstream market.
Regulatory Landscape
In the United States, midstream tariffs and operating requirements are shaped by Federal Energy Regulatory Commission (FERC) rate mechanisms and Federal pipeline safety oversight. In April 2026, FERC finalized the oil pipeline index for the five-year period starting July 1, 2026, setting a PPI-FG minus 0.55% index level, which affects the ceiling for indexed tariff changes on regulated oil pipelines. Separately, FERC issued a final rule in May 2026 to incorporate mandatory business practice standards for interstate natural gas pipelines (18 CFR 284.12), with compliance filings due September 1, 2026 and implementation aligned to an effective date of January 1, 2027. The changes are intended to reinforce standardized electronic nominations, scheduling, and capacity release processes for shippers.
Safety and emissions compliance also feed into integrity spending and operating procedures for pipelines and related assets. PHMSA moved to modernize anomaly response criteria for gas transmission and hazardous liquid pipelines through a July 2026 NPRM that shifts from rigid timelines to engineering-based, risk-informed response criteria (comments due September 8, 2026). This supports alignment of replacement CAPEX and integrity programs with updated risk frameworks. In Europe, policy has tightened around gas system reform and methane management: the EU adopted the decarbonized gas and hydrogen package in June 2024 (Regulation (EU) 2024/1789 and Directive (EU) 2024/1788), while the EU methane regulation entered into force in August 2024, with reporting obligations beginning to apply from September 2026 and extending compliance requirements across upstream and midstream-linked value chains for imported and domestically supplied gas.
Competitive Landscape
Midstream consolidation continues as operators seek to achieve scale, basin optionality, and cost synergies. DT Midstream’s USD 1.2 billion purchase of three ONEOK gas lines added 3.7 Bcf/d capacity across seven U.S. states and deepened contracted cash flow coverage. Enterprise Products Partners acquired Occidental’s Midland Basin affiliate for USD 580 million, securing 200 miles of pipe and long-term acreage agreements. MPLX spent USD 715 million to acquire BANGL and co-fund major Permian takeaway projects, underscoring the capital requirements for corridor dominance.
Technology adoption emphasizes incremental efficiency rather than disruptive change. Mission Secure’s cyber platform helped a North American operator reduce insurance premiums by USD 50,000 per location annually and enhance real-time monitoring. Baker Hughes secured its largest integrated compressor order for Dubai’s Margham storage project, showcasing the benefits of vendor consolidation in mega-tenders. Operators deploy fiber sensing, drone surveillance, and automated pigging to minimize leak‐related downtime and improve regulatory compliance.
Regulatory frameworks shape competitive dynamics. FERC permitting timelines influence asset valuations, while TSA directives require cyber-incident reporting and minimum protections. Companies with strong balance sheets and diversified business models are best positioned to navigate capital scarcity, ESG scrutiny, and insurance premium inflation. Overall competition centers on securing fee-based contracts, optimizing asset bases, and delivering predictable distributions that attract yield-oriented investors to the oil and gas midstream industry.
Oil And Gas Midstream Industry Leaders
-
APA Group
-
Chevron Corporation
-
BP PLC
-
Enbridge Pipelines Inc.
-
Shell PLC
- *Disclaimer: Major Players sorted in no particular order

Oil And Gas Midstream Market Companies Covered in this Report
- Enbridge Inc.
- Kinder Morgan Inc.
- Enterprise Products Partners L.P.
- TC Energy Corporation
- Williams Companies Inc.
- Energy Transfer L.P.
- Plains All American Pipeline L.P.
- ONEOK Inc.
- Magellan Midstream Partners L.P.
- Cheniere Energy Inc.
- Pembina Pipeline Corporation
- Chevron Corporation
- BP p.l.c.
- Shell p.l.c.
- Gazprom
- Saudi Aramco (Aramco Midstream)
- QatarEnergy
- APA Group
- Baker Hughes Company (Midstream Solutions)
- Eni S.p.A. (Midstream)
Market Opportunities and Future Outlook
Near-term opportunity is centered on lifting utilization and margin capture from existing pipeline, terminal, and storage footprints through debottlenecking and digital optimization, especially where LNG feedgas, power-sector load, and seasonal balancing requirements increase intra-year flow variability. Storage-led flexibility remains a focal area because intermittency management increases the value of multi-cycle injection and withdrawal. Recent capacity moves referenced in the report context, including Enstor's Mississippi Hub expansion to 56.3 Bcf by 2028 and EnLink's Jefferson Island Storage addition under long-term take-or-pay agreements, point to active customer-led contracting for peak-shaving and reliability. On the liquids and terminals side, operating improvements and automation that reduce losses and increase throughput also support fee-based earnings, including Phillips 66 commissioning Advanced Process Control at its Coastal Bend facility in February 2026 to raise throughput from 121,000 bpd toward 130,000 bpd.
Regulatory and operational changes are creating whitespace for service providers and operators in compliance-heavy activities, including integrity management, cyber-hardening, and standardized commercial operations. FERC actions in 2026, including business practice standardization for interstate natural gas pipelines and the oil pipeline index reset for the July 1, 2026 period, reinforce the need for nomination, measurement, scheduling, and tariff-management capabilities that can be productized across multi-asset portfolios. At the asset level, PHMSA's July 2026 proposal to modernize anomaly response criteria supports demand for advanced inline inspection, monitoring, and engineering services that can translate risk-based requirements into repair and replacement programs. For international gas trade corridors, modular FLNG and regasification-linked midstream buildouts continue to be an actionable pathway where stranded or remote gas resources need export solutions, and where LNG-linked logistics and infrastructure partnerships can reduce balance-sheet strain for developers.
Recent Industry Developments in Oil And Gas Midstream Market
- July 2026: Delfin Midstream partnered with EIG's MidOcean Energy to advance its second floating LNG vessel (FLNG2) and issued a Limited Notice to Proceed to Siemens Energy for long-lead equipment. The structure enables earlier procurement and execution discipline while sharing development risk, reinforcing the role of repeatable FLNG designs in bringing additional LNG-linked midstream capacity to market.
- January 2025: DT Midstream completed its USD 1.2 billion acquisition of three natural gas pipelines from ONEOK, adding more than 3.7 Bcf/d of combined capacity across seven US states. The deal expanded DT Midstream's contracted footprint and strengthened scale benefits in operations, scheduling, and commercial optimization across a broader network.
- November 2024: The Matterhorn Express Pipeline began operations with 2.5 Bcf/d capacity, moving Permian Basin gas to Texas markets and Gulf Coast LNG export demand. Full contract coverage at startup highlighted shipper preference for firm takeaway and strengthened the case for complementary gathering and processing investments tied to major trunklines.
Oil And Gas Midstream Market Report Scope and Research Methodology
Market Definition and Coverage
For this methodology, the oil and gas midstream market is defined as the value of services and infrastructure used to move and temporarily store crude oil, natural gas, and related products between production sites and end demand points like refineries, LNG facilities, and distribution hubs.
Scope exclusions: Excludes upstream production activities and downstream refining, retail fuel marketing, and petrochemical manufacturing revenues.
Segments Covered in This Report
- By Infrastructure
- Pipelines
- Terminals
- Storage Facilities (Underground and Above-ground)
- By Product Type
- Crude Oil
- Natural Gas
- Refined Products
- LNG
- By Service Type
- Pipeline Construction
- Pipeline Maintenance and Repair
- Storage and Handling Services
- Transportation and Logistics
- By Geography
- North America
- United States
- Canada
- Mexico
- Europe
- Norway
- United Kingdom
- Russia
- Netherlands
- Germany
- Rest of Europe
- Asia Pacific
- China
- India
- Japan
- South Korea
- ASEAN Countries
- Australia
- Rest of Asia Pacific
- South America
- Brazil
- Argentina
- Colombia
- Rest of South America
- Middle East and Africa
- Saudi Arabia
- United Arab Emirates
- Qatar
- Nigeria
- South Africa
- Rest of Middle East and Africa
- North America
Data Sources, Market Sizing, and Validation
Desk Research
Desk research was used to set the market boundary, map major activity pools (pipeline transportation, terminals, and storage), and build a clean set of external checkpoints before modeling. We referenced public datasets and documents such as the US Energy Information Administration for pipeline flow indicators and storage signals, the International Energy Agency for energy balances and demand context, the International Maritime Organization for shipping and safety context, and trade statistics published by UN Comtrade for product movement signals.
In addition, we reviewed company annual reports, investor presentations, regulator filings where available, and releases from industry bodies such as pipeline and LNG associations to understand capacity additions, utilization direction, and tariff-style pricing. A paid company financials and intelligence subscription was used selectively to standardize revenue splits, track asset additions, and avoid double counting across consolidated entities. The sources listed above are illustrative only, and other public documents and datasets were also consulted for data collection, validation, and clarification.
Primary Interviews and Surveys
Primary interviews focused on validating what is counted as midstream revenue versus adjacent services, and stress-testing key assumptions like throughput, storage turns, and tariff progression. We spoke with a mix of operators, service providers, logistics participants, and informed buyers across Americas, EMEA, and APAC, so gaps left by public disclosures could be closed with grounded checks tied back to how assets are actually utilized and billed.
Distribution of primary research fieldwork respondents
| Company type | Respondent position | Region |
|---|---|---|
| Top tier: 33% | CXOs: 16% | APAC: 49% |
| Mid tier: 51% | Functional/Unit leaders: 39% | EMEA: 31% |
| Smaller Players: 16% | Managers: 45% | Americas: 20% |
Market-Sizing & Forecasting
Market sizing starts with a top-down build where energy supply and demand signals are translated into midstream activity pools, and then tied to service categories that monetize that activity. For oil and gas midstream, the model uses indicators such as crude and gas production trends, pipeline throughput and tariff ranges, storage capacity and utilization patterns, LNG export and import volumes, and major cross-border trade flows as practical inputs that can be checked year to year.
To keep totals realistic, we corroborate the top-down result with selective bottom-up approximations, such as rolling up sampled operator revenues, checking typical revenue per unit of throughput, and using volume times average pricing for storage and terminaling where public clues exist. When a disclosure gap shows up, the missing value is filled using peer averages within the same geography and asset type, then adjusted after interview feedback so the implied utilization does not look abnormal.
For forecasting, scenario analysis is used because new pipeline builds, permitting timelines, and LNG infrastructure ramp-ups can shift the slope quickly. Assumptions on production outlook, export demand, tariff escalation, and capacity additions are reviewed with industry respondents, and the final forecast stays consistent with those variable paths rather than extending a past CAGR.
Data Validation & Update Cycle
Validation is done through multiple checks so the market number aligns with real-world operating signals. We compare the modeled outcomes with independent markers like capacity additions, published storage levels, throughput direction, and trade movements, and then investigate any large variance before internal sign-off.
If a step change is detected, such as a major project delay, a policy-driven constraint, or a sudden volume drop, analysts re-contact sources to confirm what changed and whether the change is temporary or structural. The report is refreshed annually, and interim updates are made when material events alter assumptions, followed by a final pre-delivery review so the latest information is reflected.
Mordor Intelligence's Oil and Gas Midstream Market Size Compared With Other Published Estimates
Published market sizes for oil and gas midstream can look far apart, even when they are describing similar infrastructure, because the counting rules are not consistent across studies. Differences usually come from what gets included as revenue, the year and currency timing used, and whether volumes are tied to observable throughput and storage signals.
The main gap comes from whether processing and downstream-linked activities get bundled into midstream, where Mordor Intelligence counts midstream around transportation, terminals, and storage services tied to oil and gas movements rather than folding in broader processing or end-market sales values. Spreads also show up when some sources use aggressive capacity build assumptions, apply blended global averages without region-level checks, or do not reconcile totals against production, trade, and utilization patterns.
Benchmark comparison
| Source | Market Size | Gaps in Research Methodology |
|---|---|---|
| Mordor Intelligence | USD 77.59 B (2026) | |
| Industry Publisher A | USD 835.70 B (2024) | Uses a much wider value scope that appears to include broad infrastructure and operations, which can pull in processing-linked and other adjacent revenue pools, and it is anchored to a different base year. |
| Market Publisher B | USD 1543.20 B (2025) | Likely counts processing and a wider set of transportation and service activities as part of midstream, which expands the addressable revenue base well beyond transport, terminals, and storage. |
The table shows that scope choices explain most of the spread, and timing adds another layer because base years and currency conversions do not line up. By keeping the market tied to observable midstream activity drivers and then checking the implied results with practical revenue and volume cross-checks, the estimate stays easier to replicate and audit over time.
Key Questions Answered in the Report
What is the 2026 value of the oil and gas midstream market?
It was USD 77.59 billion in 2026.
How fast will global midstream revenue grow through 2031?
The sector is forecast to expand at a 3.59% CAGR between 2026 and 2031.
Which infrastructure type will see the fastest growth?
Gas storage facilities lead with a 5.14% CAGR through 2031.
Which region is poised for the quickest expansion?
Asia-Pacific is projected to grow at 4.74% CAGR over the forecast period.
What drives consolidation among midstream operators?
Scale benefits, geographic diversification, and the push for predictable fee-based cash flows motivate recent mergers and acquisitions.
How does cybersecurity affect midstream financials?
Operators with advanced cyber defenses can lower insurance premiums by approximately USD 50,000 per facility each year.