
Oil & Gas Engineering Services Market Size and Share
Market Overview
| Study Period | 2020 - 2031 |
|---|---|
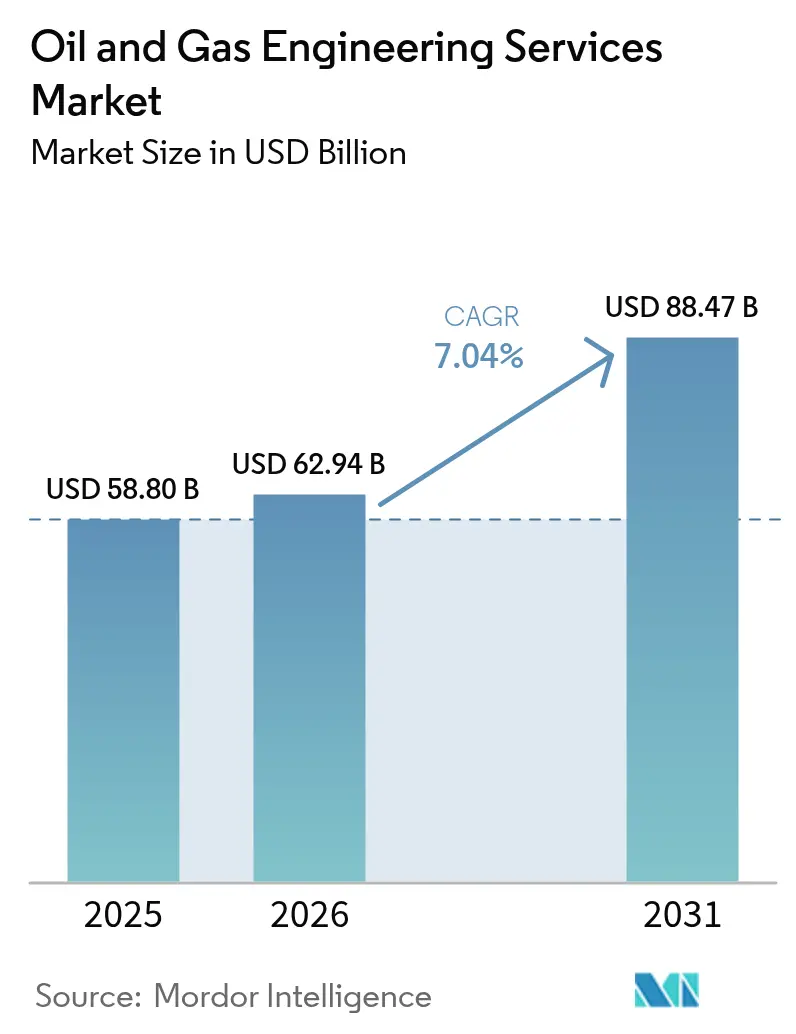
| Market Size (2026) | USD 62.94 Billion |
| Market Size (2031) | USD 88.47 Billion |
| Growth Rate (2026 - 2031) | 7.04 % |
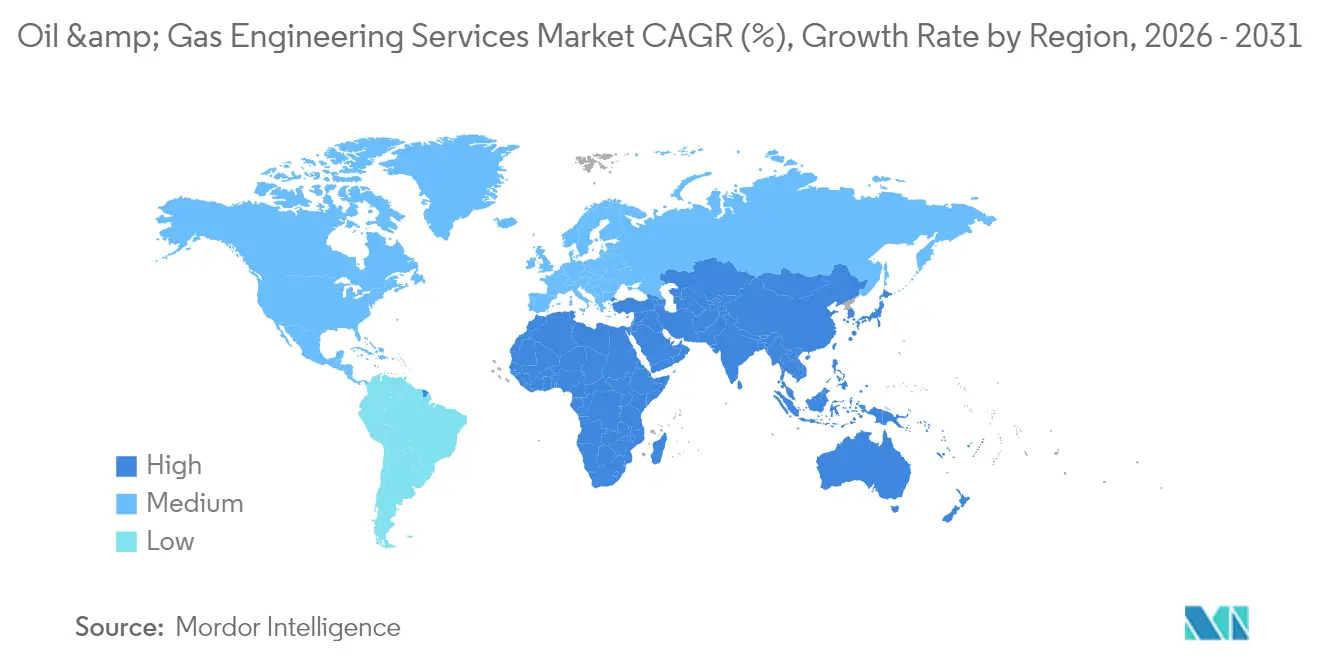
| Fastest Growing Market | Middle-East and Africa |
| Largest Market | Asia Pacific |
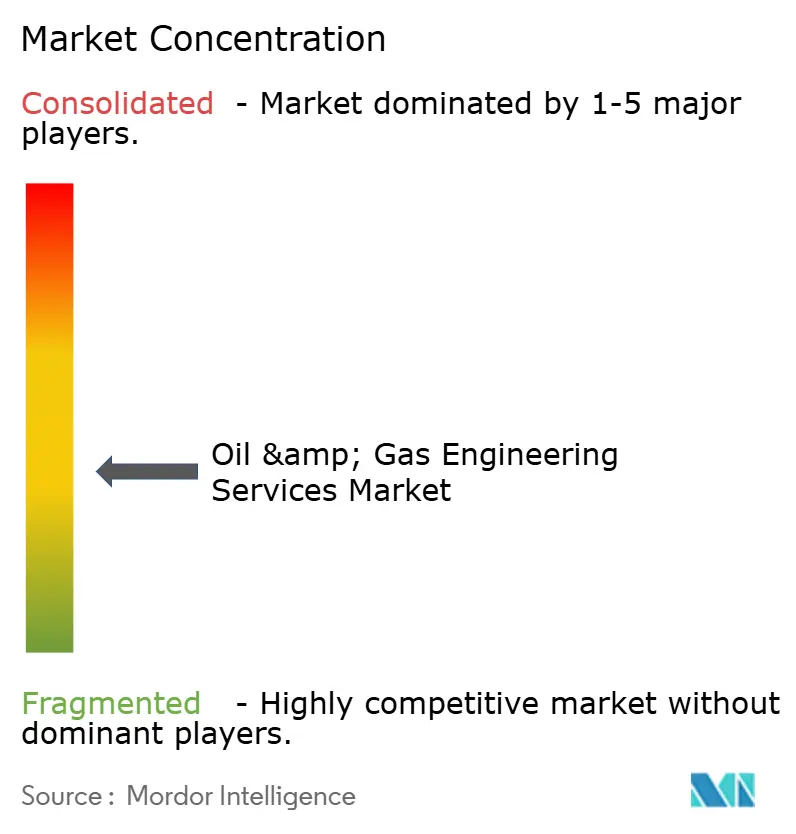
| Market Concentration | Medium |
Major Players *Disclaimer: Major Players sorted in no particular order Image © Mordor Intelligence. Reuse requires attribution under CC BY 4.0. | |
Oil & Gas Engineering Services Market Analysis by Mordor Intelligence
The oil and gas engineering services market size is expected to grow from USD 58.8 billion in 2025 to USD 62.94 billion in 2026 and is forecast to reach USD 88.47 billion by 2031 at 7.04% CAGR over 2026-2031. The broad adoption of digital twins, stricter decarbonization mandates, and relentless cost-optimization programs are accelerating service demand, even as operators navigate volatile commodity cycles. Upstream projects retain the largest slice of spending, yet downstream modernization and integrated petrochemical complexes are pacing the fastest growth as companies pursue higher-value product streams. Digital engineering, ranging from building information modeling to predictive analytics, is reshaping bid criteria, shortening delivery schedules, and lowering lifecycle costs. Regionally, the Asia-Pacific anchors the current demand pool, while the Middle East registers the strongest growth trajectory, driven by mega-projects tied to refining, LNG, and the NEOM industrial program.
Key Report Takeaways
- By type, upstream services captured 41.78% of the oil and gas engineering services market share in 2025, whereas downstream services are projected to expand at an 7.82% CAGR to 2031.
- By service type, detailed engineering and EPCm commanded 30.66% of the oil and gas engineering services market size in 2025, while digital engineering is poised for the fastest 8.46% CAGR through 2031.
- By application, exploration and production accounted for 28.74% of the oil and gas engineering services market size in 2025; refining and petrochemicals are expected to advance at a 8.91% CAGR through 2031.
- By geography, Asia-Pacific led with 20.95% revenue share in 2025; the Middle East is forecast to expand at a 8.74% CAGR between 2026-2031.
Note: Market size and forecast figures in this report are generated using Mordor Intelligence’s proprietary estimation framework, updated with the latest available data and insights as of 2026.
Market Trends and Insights
Drivers Impact Analysis of Oil & Gas Engineering Services Market*
| DRIVER | (~) % IMPACT ON CAGR FORECAST | GEOGRAPHIC RELEVANCE | IMPACT TIMELINE |
|---|---|---|---|
| Growing adoption of automation and digital twins | +1.2% | Global, early gains in North America and Europe | Medium term (2-4 years) |
| Industry-wide cost optimisation imperatives | +0.8% | Global | Short term (≤ 2 years) |
| Rising brownfield asset life-extension projects | +1.0% | North America, Europe, mature Asia-Pacific fields | Long term (≥ 4 years) |
| LNG capacity build-out in emerging markets | +1.5% | Africa, the Middle East, Southeast Asia | Medium term (2-4 years) |
| Decarbonisation mandates (CCUS and methane abatement) | +1.8% | Global, spill-over from Europe to the Asia-Pacific | Long term (≥ 4 years) |
| Surge in private upstream investment in Africa | +1.1% | Africa, early gains in Nigeria, Angola, Mozambique | Medium term (2-4 years) |
| Source: Mordor Intelligence | |||
Growing adoption of automation and digital twins
Shell’s digital twin for its Prelude FLNG facility reduced project execution time by 18% and saved USD 45 million annually in maintenance, demonstrating the business case for real-time data integration. [1]Source: Royal Dutch Shell plc, “Annual Report 2024,” shell.com Asset owners are increasingly specifying digital-twin deliverables at the bidding stage, shifting the service scope toward predictive maintenance and scenario-based optimization. Alignment with API and ISO 55000 standards speeds board approvals and unlocks capital for larger transformation programs. Service providers that have invested in integrated data platforms now win higher-margin outcome-based contracts. This momentum directly feeds into the expanding demand for advanced analytics professionals within the oil and gas engineering services market.
LNG capacity build-out in emerging markets
Africa and Southeast Asia together have more than USD 180 billion in committed LNG projects that require specialized engineering over the next five years.[2]Source: Technip Energies Investor Relations, “Investor Presentation 2024,” technipenergies.com Qatar’s North Field expansion alone has issued over USD 25 billion in engineering contracts covering detailed design, fabrication support, and digital integration. Harsh-environment locations increase per-unit engineering intensity by 40% compared to legacy plants, according to the International Energy Agency.[3]Source: International Energy Agency, “World Energy Outlook 2024,” iea.org Higher complexity translates into premium billing rates, sustaining double-digit growth for LNG-focused service portfolios. The trend anchors robust order backlogs that cushion providers against cyclical dips in upstream spending.
Decarbonisation mandates (CCUS and methane abatement)
Carbon capture projects are projected to generate USD 12 billion in annual engineering expenditures by 2030, creating new revenue streams for multidisciplinary firms.[4]Source: ExxonMobil Corporation, “Form 10-K 2024,” sec.gov European Union methane rules and U.S. EPA standards require retrofits that only seasoned process safety engineers can execute, thereby lifting demand for scarce expertise. Service packages now bundle emissions quantification, technology selection, and permitting support, commanding premium pricing. Operators pay up because daily non-compliance penalties can exceed USD 100,000 for large facilities. Providers with a track record in CO₂ transport and injection infrastructure secure repeat business and strengthen client lock-in across the oil and gas engineering services market.
Industry-wide cost optimisation imperatives
Commodity-price swings drove operators to pursue modular design, lean engineering, and digital collaboration that lower engineering hours by up to 25%. Outcome-based pricing ties fees to realized savings, aligning incentives and reducing change-order disputes. Providers offering standardized equipment catalogs reduce procurement cycles, enabling operators to cut project lead times by four to six months. Competitive tendering now favors firms able to guarantee double-digit cost reductions without compromising safety. As a result, cost-optimization capability has become a core differentiator within the oil and gas engineering services market.
Restraints Impact Analysis of Oil & Gas Engineering Services Market*
| RESTRAINT | (~) % IMPACT ON CAGR FORECAST | GEOGRAPHIC RELEVANCE | IMPACT TIMELINE |
|---|---|---|---|
| Crude-price cyclicality and capex pull-backs | -0.9% | Global | Short term (≤ 2 years) |
| Skilled-labour shortages in specialised disciplines | -0.7% | North America, Europe, Australia | Medium term (2-4 years) |
| Escalating ESG-driven compliance costs | -0.5% | Global, early impact in Europe and North America | Long term (≥ 4 years) |
| Cybersecurity and IP-theft concerns in remote delivery | -0.4% | Global, affecting cross-border projects | Medium term (2-4 years) |
| Source: Mordor Intelligence | |||
Crude-price cyclicality and cap-ex pull-backs
Oil prices oscillating between USD 70 and USD 95 per barrel in 2024 forced multiple project deferrals, slicing ConocoPhillips’ capital budget by USD 1.2 billion and shrinking associated engineering awards by 15%. Operators now stipulate flexible scope clauses that shift risk onto contractors. Firms heavily exposed to mega-projects face lumpy cash flows and must maintain idle capacity during downturns. Smaller, regionally diversified workloads help mitigate revenue volatility; however, balance-sheet resilience remains critical for weathering short-cycle pullbacks within the oil and gas engineering services market.
Skilled-labour shortages in specialised disciplines
Vacancy rates exceed 25% for process-safety, subsea, and digital-integration engineers, inflating subcontractor premiums by 35% at Wood Group in 2024. Aging workforces in North America and Europe exacerbate the gap as seasoned experts retire faster than universities can replenish their talent. Competition from renewables adds wage pressure and lengthens hiring cycles. Providers invest in apprenticeship pipelines, but the requisite four- to seven-year skill curve prolongs capacity constraints. Persistent scarcity threatens project timelines and can cap annual revenue growth for the oil and gas engineering services industry.
*Our forecasts treat driver/restraint impacts as directional, not additive. The impact forecasts reflect baseline growth, mix effects, and variable interactions.
Oil & Gas Engineering Services Market Segment Analysis
By Type:
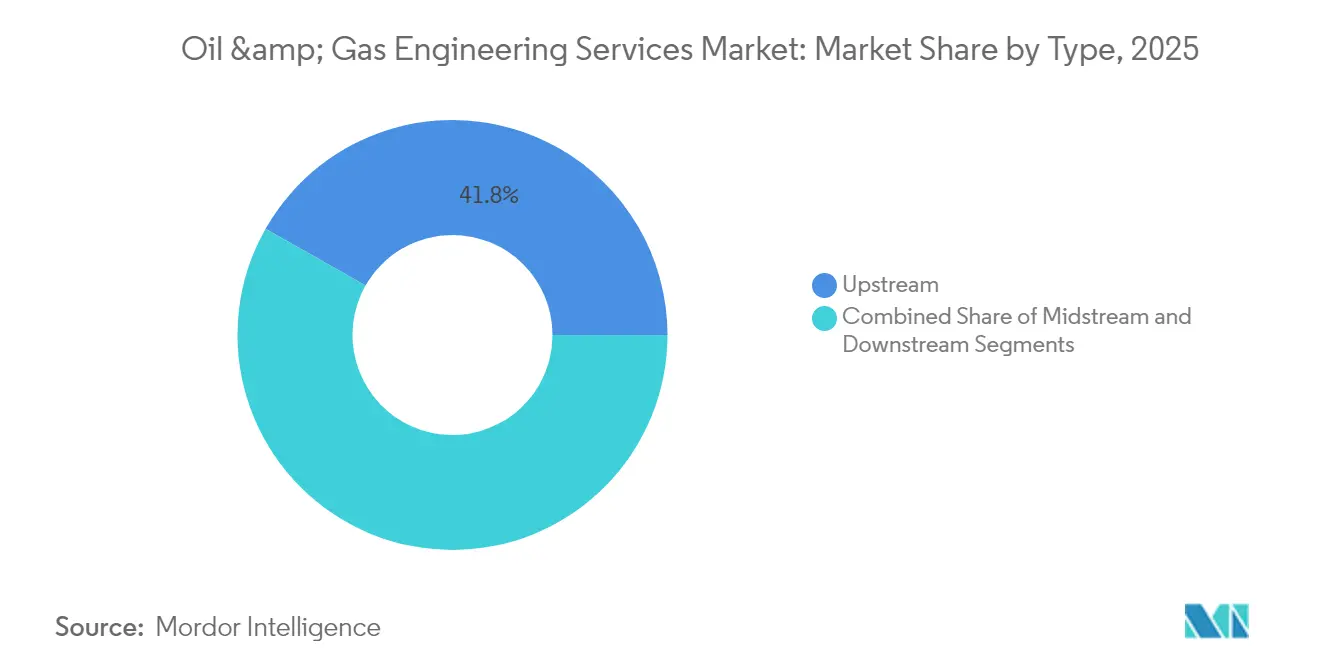
Upstream Dominance Drives Market FoundationUpstream services held a 41.78% market share of the oil and gas engineering services market in 2025, underscoring the capital-intensive nature of deep-water exploration, unconventional resource development, and enhanced recovery programs. Continuous reservoir appraisal and complex well architectures demand integrated subsurface and surface engineering that few competitors can execute at scale. Upstream workloads also include digital field life-cycle modeling, which informs production optimization and extends contract duration across the development horizon.
The downstream arena, although smaller, is growing faster at 7.82% CAGR as refiners modernize and integrate petrochemicals to maximize margins. Saudi Aramco’s USD 20 billion Jazan complex exemplifies the high-value projects driving downstream momentum. Stricter environmental rules raise technology requirements for sulfur removal, flare reduction, and energy efficiency, boosting consulting and execution revenues. Midstream, anchored by LNG facilities and pipelines, captures roughly 27.65%, providing steady income from long-dated infrastructure programs. Together, these dynamics reinforce a balanced opportunity set across the oil and gas engineering services market.


By Service Type:
Digital Engineering Accelerates Traditional ServicesDetailed engineering and EPCm accounted for 30.66% of the oil and gas engineering services market size in 2025, reflecting their indispensability for end-to-end project execution. The scope encompasses 3D modeling, procurement support, construction supervision, and commissioning. Clients prize vendors that can compress schedules without quality tradeoffs, sustaining healthy margins despite competitive tendering.
Digital engineering, though a smaller base, is expanding at an 8.46% CAGR. Worley’s deployment of digital twins across 150 projects cut engineering hours by 20% and boosted construction productivity by 15%. These gains, combined with richer life-cycle insights, position digital deliverables as table stakes in upcoming bids.
By Application:
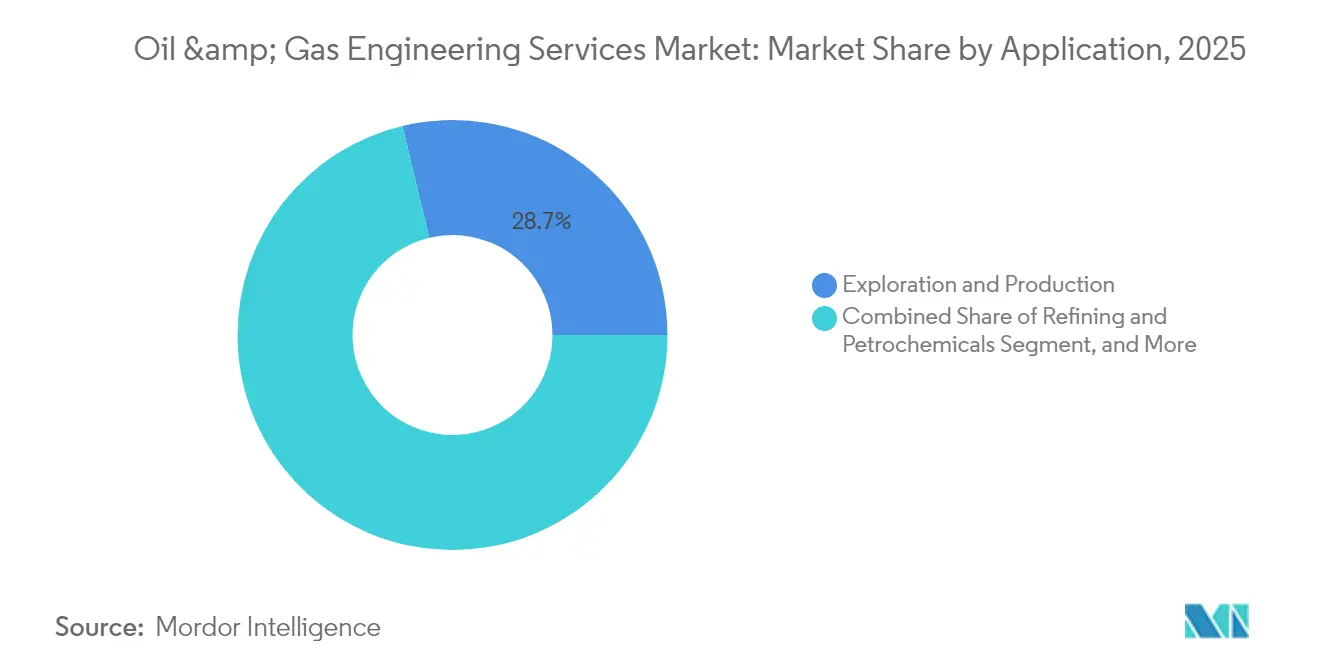
Refining and Petrochemicals Drive Growth AccelerationExploration and production projects accounted for 28.74% of the oil and gas engineering services market size in 2025, encompassing reservoir characterization, well design, and the development of production facilities. High-pressure, high-temperature wells and deep-water tie-backs prolong service involvement across decades, ensuring durable revenue streams. LNG and gas processing capture a significant share, driven by energy security and preferences for lower-carbon fuels.
Refining and petrochemicals, however, chart the fastest path at 8.91% CAGR to 2031, supported by China’s 1.6 million barrels-per-day capacity additions and India’s multi-billion-dollar petrochemical self-sufficiency push. Complex feedstock slats and circular-economy imperatives create specialized engineering needs in catalytic cracking, aromatics production, and polymer recycling. Meanwhile, pipeline and storage applications round out the mix by enabling crude evacuation and strategic reserve builds, particularly in emerging economies.
Geography Analysis
APAC Oil & Gas Engineering Services Market
The Asia-Pacific region led with 20.95% of global revenue in 2025, driven by massive investments in refining, petrochemicals, and LNG, exceeding USD 150 billion through 2030. China’s carbon-neutrality pledge stimulates CCUS engineering demand, while India’s downstream build-out drives the design of complex process units.
North America Oil & Gas Engineering Services Market
North America contributed a significant share in 2025. Shale optimization, LNG export terminals, and refinery upgrades, each of which focuses on energy efficiency, remain key drivers. EPA methane rules sharpen demand for emissions-control engineering, and the Permian Basin sustains sizeable brown-field enhancement programs. Canada’s oil sands drive carbon-intensity reduction projects that require novel solvent-based extraction methods.
EMEA Oil & Gas Engineering Services Market
The Middle East and Africa jointly register the sharpest expansion at 8.74% CAGR. Saudi Arabia’s NEOM initiative, ADNOC’s Ruwais expansion, and Qatar’s LNG megaprojects form a multi-year workload pipeline surpassing USD 200 billion. Africa’s Coral Sul FLNG and Nigerian deep-water fields open premium opportunities for remote-environment specialists. Europe sustains stable demand through decarbonization retrofits, North Sea field life extension, and renewable integration projects under the European Green Deal framework.

Regulatory Landscape
Regulation affecting oil and gas engineering services is tightening around emissions, measurement integrity, and safety assurance, which is expanding engineering scope for monitoring, retrofit design, and compliance documentation. In the United States, the EPA finalized NSPS OOOOb and Emissions Guidelines OOOOc in May 2024, expanding monitoring and emission control requirements for new and existing oil and gas operations and enabling the use of advanced monitoring technologies through an Alternative Test Method (ATM) pathway.
Offshore and pipeline regimes are also adding design and verification requirements, which increases third-party review and automation needs. BSEE implemented a final rule effective October 2024 that adds requirements for new or unusual technology (including HPHT equipment) and mandates independent third-party review for certain deepwater projects. It later issued a final rule effective August 10, 2026 for OCS operations that incorporates updated production measurement and safety standards. In parallel, PHMSA issued an April 2026 proposed rule to revise rupture-mitigation valve requirements and extend certain operational deadlines, while EPA issued March 2026 technical changes related to temporary flaring provisions and monitoring, reinforcing demand for process safety, controls, and data traceability aligned with standards such as IEC 61511 and IEC 62443.
Competitive Landscape
The top five players together hold a significant share of the oil and gas engineering services market, among regionally focused firms and digital specialists. Consolidation continues as incumbents acquire niche digital or sustainability assets to deepen value propositions. Wood Group’s 2025 acquisition of Cognite for USD 850 million enhanced its AI and digital-twin portfolio, while Worley’s diversification into renewable engineering broadened its energy-transition revenue mix.
Competitive advantage increasingly stems from proprietary data platforms, emissions-reduction expertise, and outcome-based pricing. Technip Energies leverages a deep LNG reference list to secure USD 3.2 billion for Saudi Aramco’s Jafurah project, illustrating the impact of domain credibility on mega-project awards. Fluor’s integrated EPC management on ExxonMobil’s Baytown modernization highlights the premium attached to compliance-driven refinery upgrades.
Emerging challengers utilize cloud collaboration, AI-guided design, and modular work-sharing to execute projects with lower overhead, capturing a share in cost-sensitive bids. In response, legacy giants upgrade their cybersecurity, invest in remote delivery centers, and pilot no-code automation for repetitive design tasks. Specialists offering CCUS, methane abatement, and bio-refinery conversions unlock high-margin niches. Overall, the oil and gas engineering services market balances scale efficiencies with agile innovation, rewarding firms that master both dimensions.
Oil & Gas Engineering Services Industry Leaders
Wood Group PLC
Worley Limited
Technip Energies N.V.
Fluor Corporation
Saipem S.p.A.
- *Disclaimer: Major Players sorted in no particular order
Oil & Gas Engineering Services Market Companies Covered in this Report
- Wood Group PLC
- Worley Limited
- Technip Energies N.V.
- Fluor Corporation
- Saipem S.p.A.
- KBR Inc.
- Petrofac Limited
- Larsen & Toubro Technology Services Ltd.
- SNC-Lavalin Group Inc. (AtkinsRéalis)
- Hatch Ltd.
- WSP Global Inc.
- Tetra Tech Inc.
- Toyo Engineering Corporation
- JGC Holdings Corporation
- McDermott International Ltd.
- Hyundai Engineering Co., Ltd.
- Samsung Engineering Co., Ltd.
- CIMC Raffles Offshore Ltd.
- Mannvit Engineering
- Citec Group Oy Ab
- Arseal Technologies
- QuEST Global Services Pte. Ltd.
- M&H Consulting Engineers LLC

Market Opportunities and Future Outlook
A key opportunity is the shift from digital decision-support toward integrated, operationally embedded digital engineering that links well planning, field development planning, and production optimization across disciplines. SLB expanded multi-year deployments of its Delfi enterprise digital platform in 2026, including a three-year agreement with Azule Energy in Angola (March 2026) and an expanded collaboration with Vaar Energi on the Norwegian Continental Shelf (May 2026). These programs increase recurring engineering demand for data integration, model governance, and standardized digital deliverables that owners are increasingly specifying at bid stage.
LNG and gas infrastructure projects are also bundling automation and engineering scopes, creating demand for EPCm providers and digital engineering specialists that can support integrated controls, cybersecurity, and commissioning. Yokogawa being selected as main automation contractor for the USD 13 billion Commonwealth LNG project in Louisiana (July 2026) shows automation system integration moving into core project execution. Technip Energies receiving Full Notice to Proceed for Commonwealth LNG (May 2026) further supports active contracting momentum around new export capacity. Operators are also pushing automation deeper into drilling and production operations, highlighted by Halliburton and Eni completing an integrated closed-loop rig automation and managed pressure drilling deployment on a deepwater exploration well offshore Indonesia (July 2026). This setup supports demand for engineering services that combine controls, well design, and real-time operational workflows.
Recent Industry Developments in Oil & Gas Engineering Services Market
- July 2026: Worley was awarded a five-year project management consultancy agreement by Aramco to support energy and chemicals infrastructure projects in Saudi Arabia. The multi-year structure extends engineering workloads and deepens integration into owner delivery systems, reinforcing the role of program and project controls capabilities in large national oil company portfolios.
- June 2026: Technip Energies secured an EPCIC contract from Mozambique Rovuma Venture for the Coral Norte floating LNG project in Mozambique. The award expands near-term LNG engineering and execution activity in a complex offshore environment, lifting demand for multidisciplinary engineering, modularization, and digital execution practices.
- September 2025: Technip Energies obtained a USD 3.2 billion EPC contract for Saudi Aramco’s Jafurah gas-processing facilities. The win reflects continued investment in large-scale gas processing and associated infrastructure, sustaining demand for detailed engineering, project management, and digital integration services across long project timelines.


Oil & Gas Engineering Services Market Report Scope and Research Methodology
Market Definition and Coverage
For this study, the oil and gas engineering services market is defined as third-party revenue earned from engineering and related technical services used to plan, design, and execute oil and gas assets across upstream, midstream, and downstream activities.
Scope exclusions: We exclude pure drilling and well intervention services, equipment sales, and in-house engineering cost that is not billed as an external service.
Segments Covered in This Report
- By Type
- Upstream
- Midstream
- Downstream
- By Service Type
- Design and Front-End Engineering
- Detailed Engineering and EPCm
- Asset Integrity and Maintenance
- Digital Engineering (BIM, XR, Analytics)
- Consulting and Advisory
- By Application
- Exploration and Production
- Refining and Petrochemicals
- LNG and Gas Processing
- Pipeline and Storage
- By Geography
- North America
- United States
- Canada
- Mexico
- South America
- Brazil
- Argentina
- Rest of South America
- Europe
- Germany
- United Kingdom
- France
- Russia
- Rest of Europe
- Asia-Pacific
- China
- Japan
- India
- South-East Asia
- Rest of Asia-Pacific
- Middle East and Africa
- Middle East
- Saudi Arabia
- United Arab Emirates
- Rest of Middle East
- Africa
- South Africa
- Egypt
- Rest of Africa
- Middle East
- North America
Data Sources, Market Sizing, and Validation
Desk Research
Desk research starts with building a clean view of where engineering demand comes from in oil and gas, and how that demand turns into paid service revenue. We leaned on public energy and project signals from sources such as the U.S. Energy Information Administration, International Energy Agency, OPEC, World Bank commodity price series, and U.S. Bureau of Labor Statistics wage and employment data for engineering and technical services.
To make the sizing inputs practical, we also used public project and operating indicators from sources such as U.S. BOEM offshore activity releases and U.S. Federal Energy Regulatory Commission pipeline filings, along with company annual reports, investor presentations, contract announcements, and reputable industry press. Where it helped to validate supplier footprints and award timing, we referenced paid subscriptions for company financial intelligence, news and financials, and global contracts and tenders tracking. These examples are not exhaustive, and many other public and paid sources were consulted to collect data, validate assumptions, and clarify gaps.
Primary Interviews and Surveys
Primary work was used to pressure-test the desk assumptions on what is counted as engineering services revenue and how pricing is shifting in the current year. We spoke with a mix of project engineering leads, procurement and contracting teams, and delivery managers across major oil and gas regions, then used the inputs to align scope boundaries, typical fee structures, and utilization trends before finalizing the model.
Distribution of primary research fieldwork respondents
| Company type | Respondent position | Region |
|---|---|---|
| Top tier: 36% | CXOs: 13% | APAC: 42% |
| Mid tier: 50% | Functional/Unit leaders: 43% | EMEA: 36% |
| Smaller Players: 14% | Managers: 44% | Americas: 22% |
Market-Sizing & Forecasting
The core sizing logic uses a top-down build that starts from oil and gas capital spending and active project pipelines, then translates that into an engineering services demand pool using service intensity factors by asset type and project phase. To keep the totals grounded, we corroborate the results with selective bottom-up checks, including sampled contract fee benchmarks, a limited roll-up of known service revenues in key basins, and volume-based approximations where project counts are visible.
Inputs used in the model include indicators like upstream and downstream project sanctioning pace, brownfield upgrade activity, offshore development cycle timing, engineering headcount and utilization direction, and fee rate movement by discipline (for example, detailed design versus project management). Since oil and gas work is sensitive to oil price swings and award timing, forecast paths were built using scenario analysis around capex confidence, project delays, and pricing normalization. The scenarios were screened against what interviewees expect over the next few budgeting cycles. Where data was thin for smaller markets, we used regional proxy ratios tied to visible project pipelines and then adjusted those ratios after interviews clarified local contracting practices.
Data Validation & Update Cycle
Validation is done through several checks so the final number is not driven by a single data series. We compare the model output against independent signals such as announced engineering awards, project start and completion patterns, and reported order intake commentary, then investigate outliers before sign off.
A second analyst review is completed to recheck scope alignment, math flow, and currency handling, followed by a final consistency pass across regions and time series. Reports are refreshed annually, and interim updates are triggered when material events occur, such as sudden capex revisions, large project delays, or major pricing shifts. Before delivery, the latest public updates are reviewed again so clients receive an up-to-date view.
Mordor Intelligence's Oil and Gas Engineering Services Market Estimate Compared With Other Published Estimates
Published market values for oil and gas engineering services can vary because the timing of currency conversion, the way fee rates are stepped up year to year, and the refresh cadence for newly awarded projects are handled differently across studies.
When exchange rates are taken from a different month, or when pricing is assumed to rise uniformly instead of reflecting discipline-level tightness, the total can move by several billion dollars. With rechecks on late-year award slippage and fee rate adjustments based on recent contract language, the 2026 value is anchored to current conditions. This is also where Mordor Intelligence tends to land closer to the engineering-only demand pool.
Benchmark comparison
| Source | Market Size | Gaps in Research Methodology |
|---|---|---|
| Mordor Intelligence | USD 62.94 B (2026) | |
| Global Consultancy A | USD 59.60 B (2025) | Uses an earlier base year and smoother fee-rate uplifts, which can miss short-cycle pricing jumps when utilization tightens in detailed design and project management, and it can apply different currency timing. |
| Trade Journal B | USD 127.45 B (2024) | Appears to include a wider services basket that can pull in EPC management and broader oilfield services spend, which inflates totals versus engineering services billed as stand-alone work. |
Across the three figures, the spread is mostly explained by what is counted as engineering services versus adjacent project spending, and by how currency timing and fee-rate progression are applied. Our workflow keeps the totals traceable to visible project signals and repeatable fee assumptions, so the market value can be updated cleanly when new awards or pricing shifts occur.


Key Questions Answered in the Report
What is the current size of the oil and gas engineering services market?
The oil and gas engineering services market size is USD 62.94 billion in 2026.
How fast is spending on engineering services expected to grow over the next five years?
Aggregate spending is projected to rise at a 7.04% CAGR, taking the market to USD 88.47 billion by 2031.
Which segment is expanding the quickest?
The downstream segment leads growth with an 7.82% CAGR, driven by refinery modernization and petrochemical integration.
Why are digital twins important for engineering services?
Digital twins cut project execution time up to 18%, slash maintenance costs, and enable predictive asset management.
Which region exhibits the strongest growth momentum?
The Middle East shows the highest forecast CAGR at 8.74% through 2031 due to large gas, LNG, and industrial mega-projects.
Page last updated on:


 Your data is secure and never sold or shared.


