
Market Overview
| Study Period | 2021 - 2031 |
|---|---|
| Market Size (2026) | USD 104.03 Billion |
| Market Size (2031) | USD 125.74 Billion |
| Growth Rate (2026 - 2031) | 3.86 % |
| Fastest Growing Market | Asia Pacific |
| Largest Market | Asia Pacific |
| Market Concentration | Low |
Major Players *Disclaimer: Major Players sorted in no particular order Image © Mordor Intelligence. Reuse requires attribution under CC BY 4.0. | |
Oil And Gas Downstream Market Analysis by Mordor Intelligence
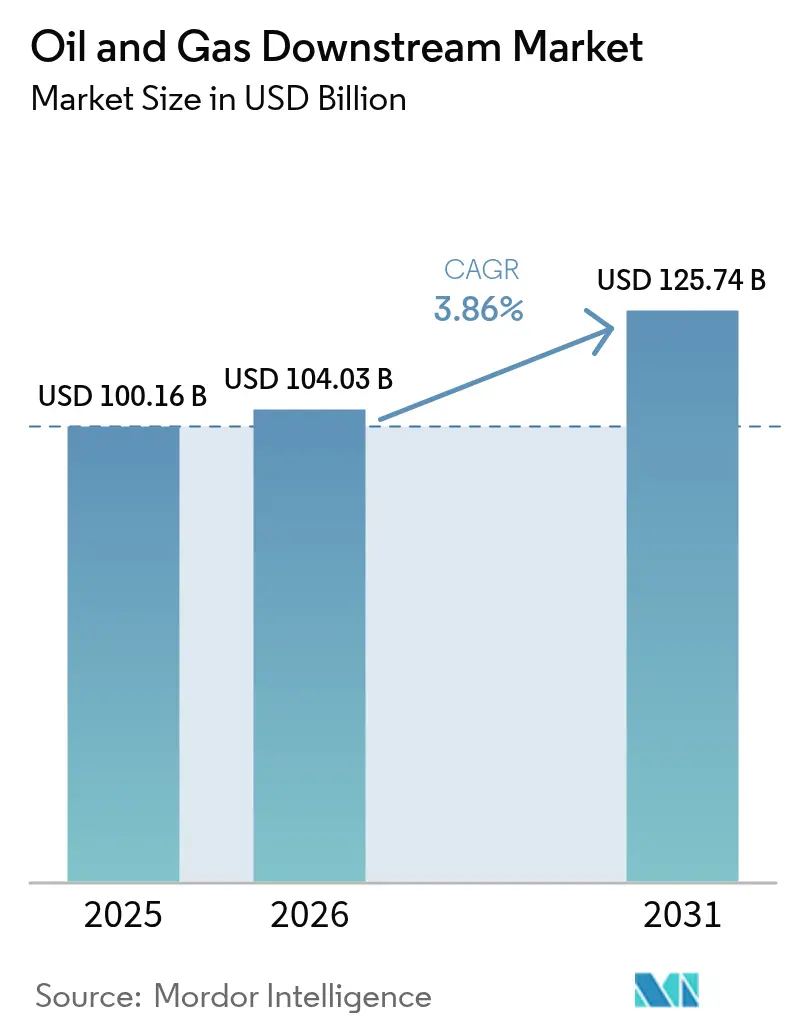
Oil And Gas Downstream Market size market size in 2026 is estimated at USD 104.03 billion, growing from 2025 value of USD 100.16 billion with 2031 projections showing USD 125.74 billion, growing at 3.86% CAGR over 2026-2031.
Expansion is driven by capacity additions in the Asia-Pacific region, rising petrochemical integration, and sustained demand for diesel and jet fuel, even as gasoline volumes ease in electrified transport corridors. Tight sulfur rules, aviation fuel mandates, and digital twin optimization collectively lift margins, while elevated interest rates and net-zero pledges temper greenfield spending. Competitive dynamics feature integrated operators shifting toward higher-value chemical feedstocks, leveraging hydrogen monetization, and exploiting scale advantages in refining and petrochemical complexes. Investment flows concentrate where feedstock is advantaged, regulations are supportive, and product-export routes are efficient, positioning the oil and gas downstream market for steady, if selective, growth through the decade.
Key Report Takeaways
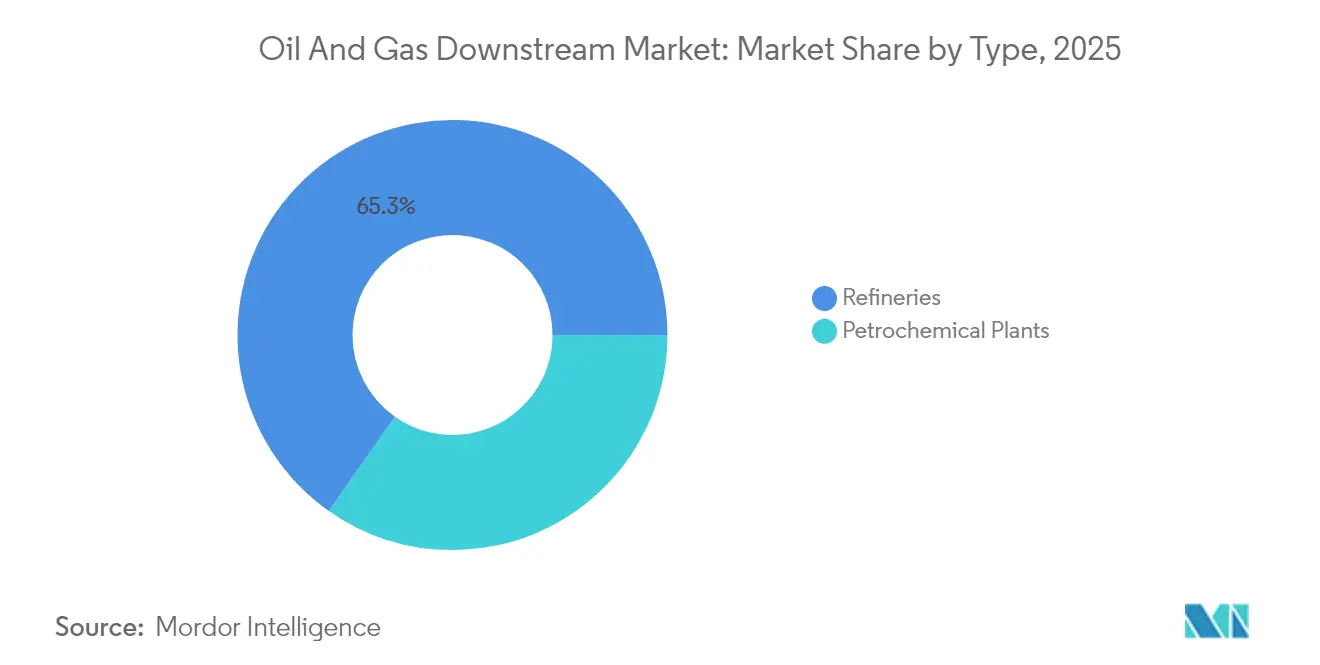
- By type, refineries captured 65.25% of the Oil & Gas Downstream market share in 2025, while petrochemical plants are set to log the fastest expansion at a 4.72% CAGR to 2031.
- By product type, refined petroleum products commanded 69.75% of the Oil & Gas Downstream market size in 2025; petrochemicals, however, are projected to advance at a 4.22% CAGR over the same horizon.
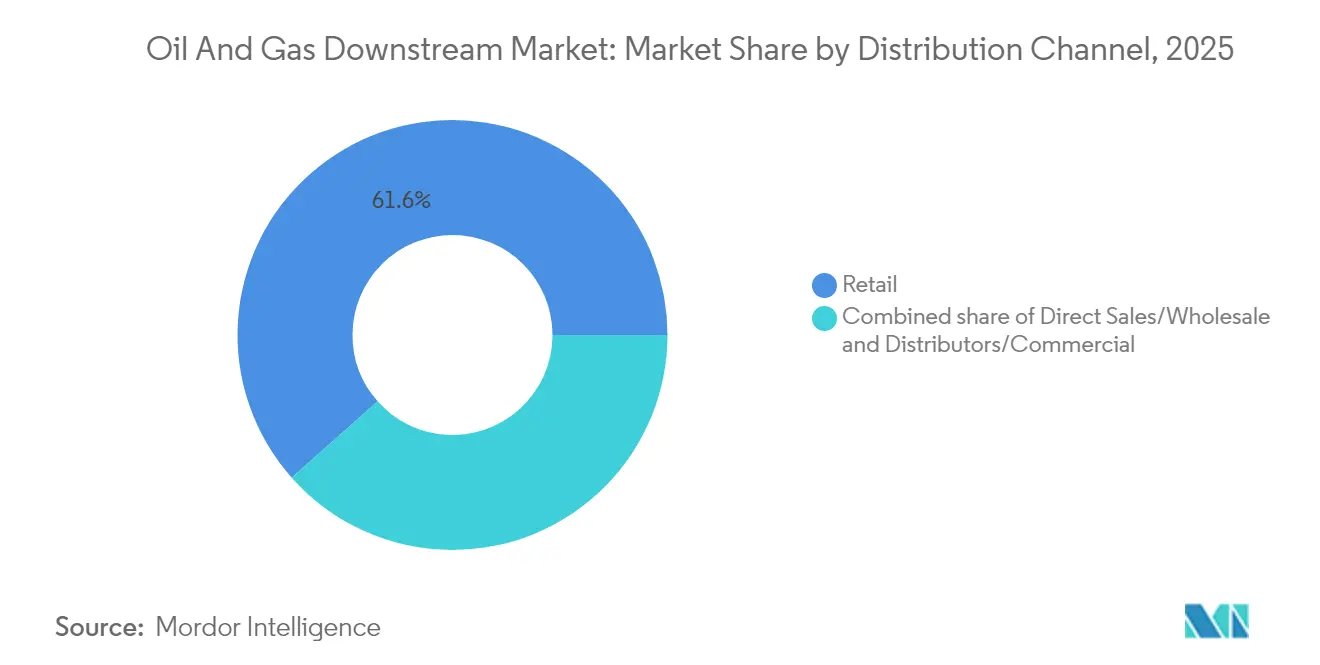
- By distribution channel, retail networks dominated with 61.55% revenue share in 2025, and this channel is projected to expand at a 4.41% CAGR through 2031.
- By geography, Asia-Pacific held 32.85% of 2025 sales and is expected to post the quickest regional growth at 4.92% CAGR to 2031
Note: Market size and forecast figures in this report are generated using Mordor Intelligence’s proprietary estimation framework, updated with the latest available data and insights as of 2026.
Market Trends and Insights
Drivers Impact Analysis of Oil And Gas Downstream Market*
| Driver | (~) % Impact on CAGR Forecast | Geographic Relevance | Impact Timeline |
|---|---|---|---|
| Surge in refining capacity | 1.20% | APAC core, Middle East | Medium term (2-4 years) |
| Booming petrochemical demand | 0.90% | Global, APAC lead | Long term (≥ 4 years) |
| Stricter IMO sulfur rules | 0.60% | Global maritime | Short term (≤ 2 years) |
| Aviation-fuel rebound & SAF mandates | 0.70% | North America, EU | Medium term (2-4 years) |
| Digital-twin/AI OPEX optimization | 0.50% | Global early adopters | Long term (≥ 4 years) |
| Hydrogen co-product monetization | 0.40% | North America, Europe | Long term (≥ 4 years) |
| Source: Mordor Intelligence | |||
Surge in Refining Capacity Expansion Drives Regional Rebalancing
Asia-Pacific and Middle Eastern projects, totaling 4.9 million b/d between 2024 and 2028, are tilting global economics toward these hubs, giving integrated operators scale and feedstock proximity advantages while compressing European and North American margins.[1]U.S. Energy Information Administration, “International Energy Outlook,” eia.gov
Petrochemical Demand Growth Transforms Refinery Economics
Petrochemicals already account for 14% of global oil demand and are expected to rise further, prompting refiners to reconfigure their operations toward naphtha cracking and aromatics extraction in integrated complexes, as exemplified by Saudi Aramco’s Motiva and China’s coastal mega-projects.[2]International Energy Agency, “The Future of Petrochemicals,” iea.org
IMO Sulfur Regulations Drive Ongoing Compliance Investments
Very-low-sulfur fuel oil now dominates bunker sales, rewarding refiners with desulfurization units and prompting shifts in crude slate, secondary unit revamps, and new outlets for marine gas oil and methanol.
Aviation-Fuel Recovery and SAF Mandates Create New Revenue Streams
The rebound in jet-fuel demand, paired with the U.K.’s 10% SAF mandate by 2030 and U.S. capacity reaching 15.8 million gallons in 2024, opens up premium niches for HEFA and power-to-liquids pathways at refineries with feedstock flexibility.[3]UK Department for Transport, “Sustainable Aviation Fuel Mandate Consultation,” gov.uk
Restraints Impact Analysis of Oil And Gas Downstream Market*
| Restraint | (~) % Impact on CAGR Forecast | Geographic Relevance | Impact Timeline |
|---|---|---|---|
| EV penetration eroding gasoline demand | -0.80% | North America, Europe | Medium term (2-4 years) |
| Net-zero policies curbing fossil fuels | -0.60% | Europe, North America | Long term (≥ 4 years) |
| Climate-risk downtime & insurance | -0.40% | Gulf Coast, coastal sites | Short term (≤ 2 years) |
| High interest rates limit projects | -0.50% | Global, emerging markets | Short term (≤ 2 years) |
| Source: Mordor Intelligence | |||
Electric Vehicle Adoption Pressures Gasoline Demand Fundamentals
Global EV sales reached 14 million units in 2024, accelerating the decline in gasoline demand in Europe and certain segments of China, prompting refiners to shift their focus toward diesel, jet fuel, and petrochemicals.
Net-Zero Climate Policies Constrain Long-Term Investment Horizons
EU Fit-for-55 measures and U.S. low-carbon standards place a price on carbon, deterring long-duration crude units and nudging capital toward renewable integration and flexible product slates.[4]European Commission, “Fit for 55 Package,” europa.eu
*Our forecasts treat driver/restraint impacts as directional, not additive. The impact forecasts reflect baseline growth, mix effects, and variable interactions.
Oil And Gas Downstream Market Segment Analysis
By Type:
Integrated refineries sharpen competitive edgeRefineries accounted for 65.25% of the Oil & Gas Downstream market in 2025 and should advance at a 4.52% CAGR, a pace underpinned by asset-utilization upgrades and petrochemical add-ons. This segment benefits from a flexible configuration that toggles between transport fuels and chemical feedstocks based on real-time margin signals. Saudi Aramco’s Motiva expansion and Reliance’s Jamnagar complex exemplify the scale synergies that lower per-barrel costs and enhance hydrocracker yields. Integrated builds blur the lines with petrochemical plants, raising barriers for smaller standalone facilities.
Petrochemical plants, although holding a smaller 34.75% share, post a 4.72% trajectory as naphtha crackers and propane dehydrogenation units proliferate in the Asia-Pacific region. Operators bundle shared utilities, logistics, and hydrogen networks to exploit co-product valorization. Yet feedstock-price swings and competition from integrated mega-sites temper standalone economics. Overall, the Oil & Gas Downstream market size gains resilience from this dual-track capacity strategy.


By Product Type:
Refined petroleum products sustain volume leadershipRefined petroleum products accounted for 69.75% of the Oil & Gas Downstream market size in 2025 and are expected to grow at a rate of 4.05% annually, as diesel, jet, and compliant marine fuels offset the decline in gasoline barrels. Aviation recovery and IMO sulfur rules underpin volume stability, while diesel’s role in freight and off-road machinery remains robust. Petrochemicals, although an embedded subset, outpace fuels as demand for packaging, automotive, and construction intensifies across the APAC region.
Lubricants occupy a niche but lucrative corner, leveraging longer drain intervals and industrial specialty grades that secure premium realization. As electrified drivetrains grow, automotive lubricant volumes ease, but industrial and marine sectors sustain baseline demand. Product-mix optimization, therefore, becomes a core competency for operators seeking to lift margins in the Oil & Gas Downstream market.
By Distribution Channel:
Retail stations secure margin advantagesRetail outlets generated 61.55% of 2025 revenue and are projected to log a 4.41% CAGR through 2031, attesting to their pricing power, brand leverage, and data-rich customer interfaces. Loyalty apps and on-site convenience retail diversify earnings, guarding against fuel-only margin compression. Direct sales and wholesale shipments remain vital for industrial volumes and fleet contracts, but yield thinner spreads.
Digitally enabled service-station formats now bundle EV charging, food service, and parcel lockers, anchoring foot traffic while cushioning the transition from internal-combustion to low-carbon mobility. Such diversification helps the oil and gas downstream market maintain its relevance in the retail sector even as vehicle fleets electrify.
Geography Analysis
APAC Oil and Gas Downstream Market
The Asia-Pacific region leads with a 32.85% share in 2025 and is expected to grow at a rate of 4.92% annually due to capacity surges in China, India, and Southeast Asia, where demographic tailwinds, industrialization, and policy support converge. China’s petrochemical pull counters peaking gasoline use, while Indian refiners chase export premiums to Africa and Latin America. Indonesia, Malaysia, and Thailand strengthen their product balance through hub-and-spoke logistics along vital sea lanes.
North America Oil and Gas Downstream Market
North America, despite a decline in gasoline demand, exploits ethane-rich shale to feed petrochemical crackers and hydrotreaters, thereby anchoring competitive cash costs. U.S. consolidators such as Phillips 66 retrofit units for renewable diesel to align with California’s LCFS and federal SAF incentives. Canada’s heavy-oil upgraders and Mexico’s government-driven builds diversify feedstock slates, though financing hurdles persist for new standalone capacity.
EMEA and South America Oil and Gas Downstream Market
Europe navigates declining fuel volumes under the Fit-for-55 umbrella by converting sites into bio-hubs producing HVO and SAF, while integrating CCS clusters to mitigate residual CO₂. Middle Eastern projects, such as ADNOC’s Ruwais Phase II, leverage gas-liquids streams and subsidized utilities to serve EU and Asian importers. Africa is witnessing emerging complexes in Nigeria and Angola, but it is contending with capital scarcity. Meanwhile, Brazil’s Petrobras balances domestic demand coverage with volatility in currency and policy cycles, collectively steering the regional mosaic of the oil and gas downstream market.


Regulatory Landscape
Regulation affecting the global oil and gas downstream market continues to tighten around fuel quality, emissions transparency, and low-carbon blending obligations, which in turn influences refinery upgrade cycles and product slate decisions. In the United States, the Environmental Protection Agency (EPA) finalized Renewable Fuel Standard (RFS) obligations covering 2026 and 2027, reinforcing biofuel blending compliance requirements across transportation fuels and sustaining demand for co-processing and renewable fuel blending infrastructure in refining and marketing networks.
In Europe, methane-related compliance is becoming more structured through measurement, reporting, and verification (MRV) requirements under EU Regulation 2024/1787, expanding oversight across fossil gas and LNG-related supply chains, including storage and terminals that feed into downstream logistics. Product storage safety and handling standards also moved forward in 2026, with the European Commission adopting Implementing Decision (EU) 2026/989 to update the harmonized standard EN 13616-1:2025 for overfill prevention devices used in liquid fuel static tanks, shaping equipment compliance for depots and retail-adjacent storage across the region.
Competitive Landscape
The oil and gas downstream market exhibits moderate concentration, with numerous regionally entrenched competitors. Saudi Aramco, Sinopec, Exxon Mobil, and Shell anchor the global league, yet none surpasses a 12% revenue stake, preserving competitive plurality. Strategies center on integration: combining refining, petrochemical, and power assets to unlock economies of scope and capture higher-margin chemical streams. Operators prioritizing digital-twin analytics and predictive maintenance, such as Shell and TotalEnergies, achieve throughput gains and energy-intensity reductions that widen their EBITDA spreads.
Portfolio realignment remains brisk. Chevron’s USD 53 billion Hess takeover extended feedstock access and U.S. Gulf Coast refining heft, while Energy Transfer’s WTG Midstream purchase sharpened logistics reach in Permian supply corridors. Private-equity vehicles continue cherry-picking mid-sized North American refineries, aggregating assets for scale. Meanwhile, APAC national oil companies are tilting their capital toward integrated build-outs that embed plastics and chemicals alongside fuels—a hedge against long-term gasoline erosion.
Innovation hotspots include SAF, renewable diesel, and hydrogen as key vectors for decarbonization. Phillips 66, TotalEnergies, and Valero repurpose hydrotreaters for HVO and HEFA pathways, accessing low-carbon credit revenue streams. Europe’s carbon-pricing regimes and the U.S. IRA incentives accelerate these pivots, reshaping product mixes across the oil and gas downstream market.
Oil And Gas Downstream Industry Leaders
BP PLC
Saudi Aramco
China Petroleum & Chemical Corp. (Sinopec)
Exxon Mobil Corporation
Shell plc
- *Disclaimer: Major Players sorted in no particular order

Oil And Gas Downstream Market Companies Covered in this Report
- China Petroleum & Chemical Corp (Sinopec)
- Exxon Mobil Corporation
- Royal Dutch Shell plc
- Saudi Arabian Oil Company (Saudi Aramco)
- BP plc
- TotalEnergies SE
- China National Petroleum Corporation (CNPC)
- Reliance Industries Limited
- Indian Oil Corporation Limited
- Chevron Corporation
- Phillips 66 Company
- Marathon Petroleum Corporation
- Valero Energy Corporation
- Petróleo Brasileiro S.A. (Petrobras)
- ENI S.p.A.
- PTT Public Company Limited
- SK Innovation Co., Ltd.
- Kuwait Petroleum Corporation
- Lukoil PJSC
- OMV Group

Market Opportunities and Future Outlook
Integration of refining with petrochemicals and adjacent gas processing creates a practical development pathway for operators looking to protect margins by shifting output toward higher-value chemical feedstocks and improving site-level utility and hydrogen economics. Large, disclosed investments reinforce this direction. In July 2026, Tasnee completed a USD 500 million expansion at the Saudi Ethylene and Polyethylene Company (SEPC) cracker in Al Jubail Industrial City, increasing olefins output by 18% and underscoring how Middle East operators are adding petrochemical capacity alongside advantaged feedstock and utilities.
Opportunities also show up in debottlenecking and infrastructure that supports exportable products, including NGL and LNG-linked value chains that add feedstock optionality for downstream hubs. In May 2026, Cheniere Partners signed an EPC contract with Bechtel for Phase 1 of the Sabine Pass Expansion Project (including Train 7 and a boil-off gas re-liquefaction unit), expanding LNG handling capacity and tightening integration between gas supply, liquids management, and downstream distribution. In parallel, Phillips 66 announced development of the 300 MMcf/d Zeus Gas Plant in the Permian Basin and a third 100 MBD Coastal Bend NGL fractionator in Robstown, Texas, pointing to whitespace for integrated wellhead-to-market systems that improve feedstock resilience for Gulf Coast refining and petrochemical corridors.
Recent Industry Developments in Oil And Gas Downstream Market
- July 2026: Adnoc Distribution agreed to acquire Shell plc's network of around 600 fuel retail stations in South Africa in a transaction reported at about USD 1 billion. The deal expands Adnoc Distribution's downstream retail footprint in a large African fuels market and changes competitive positioning in branded marketing and convenience-led station economics.
- December 2025: ExxonMobil, Saudi Aramco, and SAMREF signed a venture framework agreement to evaluate upgrading and integrating the SAMREF refinery in Yanbu into a petrochemical complex. The framework points to continued capital allocation toward refinery-to-chemicals integration to lift yield value and extend asset relevance under shifting transport-fuel demand.
- October 2024: The European Union advanced methane emissions oversight for fossil energy value chains through Regulation (EU) 2024/1787, establishing MRV-related obligations that also touch LNG facilities and storage. This increases compliance and data transparency requirements that affect downstream-adjacent logistics, contracting, and reporting practices for companies serving the European market.


Oil And Gas Downstream Market Report Scope and Research Methodology
Market Definition and Coverage
For this study, the oil and gas downstream market is defined as the value created from refining crude and processing downstream feedstocks into saleable petroleum and chemical products, and moving them through downstream distribution routes to end buyers.
Scope exclusions: Upstream exploration and production, midstream pipeline and storage services as standalone services, and crude oil trading without downstream conversion are excluded.
Segments Covered in This Report
- By Type
- Refineries
- Petrochemical Plants
- By Product Type
- Refined Petroleum Products
- Petrochemicals
- Lubricants
- By Distribution Channel
- Direct Sales/Wholesale
- Distributors/Commercial
- Retail
- By Geography
- North America
- United States
- Canada
- Mexico
- Europe
- Germany
- United Kingdom
- Norway
- Netherlands
- Russia
- Rest of Europe
- Asia-Pacific
- China
- India
- Japan
- South Korea
- ASEAN Countries
- Australia
- Rest of Asia Pacific
- South America
- Brazil
- Argentina
- Colombia
- Rest of South America
- Middle East and Africa
- Saudi Arabia
- United Arab Emirates
- Qatar
- South Africa
- Nigeria
- Rest of Middle East and Africa
- North America
Data Sources, Market Sizing, and Validation
Desk Research
Desk research was used to set the base structure of the model and to keep throughput, yield, and price conversion assumptions within realistic ranges. We referenced public sources such as the U.S. Energy Information Administration, the International Energy Agency, OPEC statistical publications, and energy ministry or national statistics portals that publish refinery runs, product demand, and inventory signals.
To reduce gaps, additional checks were done using sources such as UN Comtrade trade statistics for refined products, central bank and IMF series for inflation and exchange rates, and peer reviewed energy economics journals for demand patterns and regulation impacts. Company annual reports, investor decks, and plant level announcements were also reviewed, and a paid subscription for company financials and patent databases was used where it helped validate capacity additions and technology shifts. The sources listed here are illustrative, and many other public references were used for collection, cross-checking, and clarification.
Primary Interviews and Surveys
Primary work focused on validating how utilization, product slates, and realized pricing move across cycles, which is where published series can be slow or inconsistent. We covered refiners, downstream marketers, equipment and service participants, and independent experts across APAC, EMEA, and the Americas so assumptions could be tested by region and by exposure to fuels and petrochemical demand.
Distribution of primary research fieldwork respondents
| Company type | Respondent position | Region |
|---|---|---|
| Top tier: 38% | CXOs: 12% | APAC: 46% |
| Mid tier: 48% | Functional/Unit leaders: 30% | EMEA: 34% |
| Smaller Players: 14% | Managers: 58% | Americas: 20% |
Market-Sizing & Forecasting
Sizing starts with a top-down build where refinery and petrochemical activity is reconstructed from nameplate capacity, utilization, and typical product yield patterns, and then translated into value using blended price baskets for major product groups. Results are then corroborated with selective bottom-up approximations, such as sampled plant throughput mapped to typical realized spreads, along with channel checks on sales mixes, before totals are adjusted.
Inputs that matter in this market include refinery crude runs and utilization rates, regional product demand by fuel type, export and import balances for refined products, petrochemical feedstock shifts (naphtha versus LPG and ethane), and average product price movements tied to benchmark differentials. For forecasting, scenario analysis is used to reflect different paths for demand growth, capacity additions, and regulation driven fuel specification changes, and the final path is aligned to expert expectations on utilization and price progression. Where plant level or country series are missing, proxy indicators are applied (for example, using similar refinery configurations and trade patterns) and later rechecked during primary validation.
Data Validation & Update Cycle
Outputs are validated through cross-checks that link the final value back to independent signals, such as implied product consumption, reported refinery runs, and trade flows, so the totals stay consistent with physical market activity. When a region shows a sudden jump, variance checks are run and the drivers are traced to capacity events, price moves, or definition mismatches before sign-off.
A second analyst review is completed for key assumptions, and follow-up outreach is triggered when interview feedback conflicts with the modeled utilization or pricing path. Reports are refreshed annually, with interim updates for material events like major shutdowns, new capacity starts, or sharp currency movements. Before delivery, a fresh pass is completed so clients receive the latest updated view.
Mordor Intelligence's Oil and Gas Downstream Market Sizing Compared With Other Published Estimates
Published market values for downstream oil and gas often vary because the timing of price capture, currency conversion dates, and how blended selling prices are built can shift results even when similar assets are being described. Differences also show up when authors include broader distribution and retail margins, or when petrochemicals are treated as a full value chain rather than a plant level activity.
Because quarterly swings in product cracks and FX rates can change the USD total fast, the model is refreshed using updated regional price baskets and utilization checks before release, and that refresh-first discipline is one reason Mordor Intelligence does not land near broader downstream totals.
Benchmark comparison
| Source | Market Size | Gaps in Research Methodology |
|---|---|---|
| Mordor Intelligence | USD 100.16 B (2025) | |
| Global Consultancy A | USD 2801.00 B (2024) | Uses a wider value scope that appears to count the full downstream value pool, including broad distribution and marketing layers, which increases totals versus a plant activity and output value lens. |
| Industry Publisher B | USD 2498.14 B (2025) | Builds value from a broad downstream umbrella across refining, distribution, and end use categories, and the reported totals can shift based on how retail fuel value, duties, and nominal USD conversion timing are treated. |
Overall, the spread is mainly driven by scope boundaries and by the timing choices behind pricing and FX conversion, not by a single growth assumption. When the counted activities stay tied to refinery and petrochemical plant operations and are checked against observable run rates and trade signals, the resulting size is easier to trace and repeat.


Key Questions Answered in the Report
How large is the Oil & Gas Downstream market in 2026?
It is projected to close 2026 at USD 104.03 billion, tracking the 3.86% CAGR outlined in this analysis.
Which region leads downstream growth this decade?
Asia-Pacific leads, expanding at a 4.92% CAGR on the back of Chinese and Indian integrated complex additions.
What is driving jet-fuel and SAF demand?
Post-pandemic flight recovery and mandates such as the U.K.’s 10% SAF target by 2031 are lifting jet-fuel volumes and premium SAF margins.
How are refiners mitigating gasoline demand decline?
They pivot toward diesel, jet fuel, and petrochemicals, retrofit units for renewable fuels, and monetize surplus hydrogen.
What operational technologies boost refinery margins?
Digital twins and AI-based predictive maintenance cut downtime and energy use, translating into measurable EBITDA gains.
Which product segment grows fastest through 2031?
Petrochemicals outpace fuels as global plastics, packaging, and specialty-chemical demand continues to rise.
Page last updated on:


 Your data is secure and never sold or shared.


