
Offshore Oilfield Services Market Size and Share
Market Overview
| Study Period | 2021 - 2031 |
|---|---|
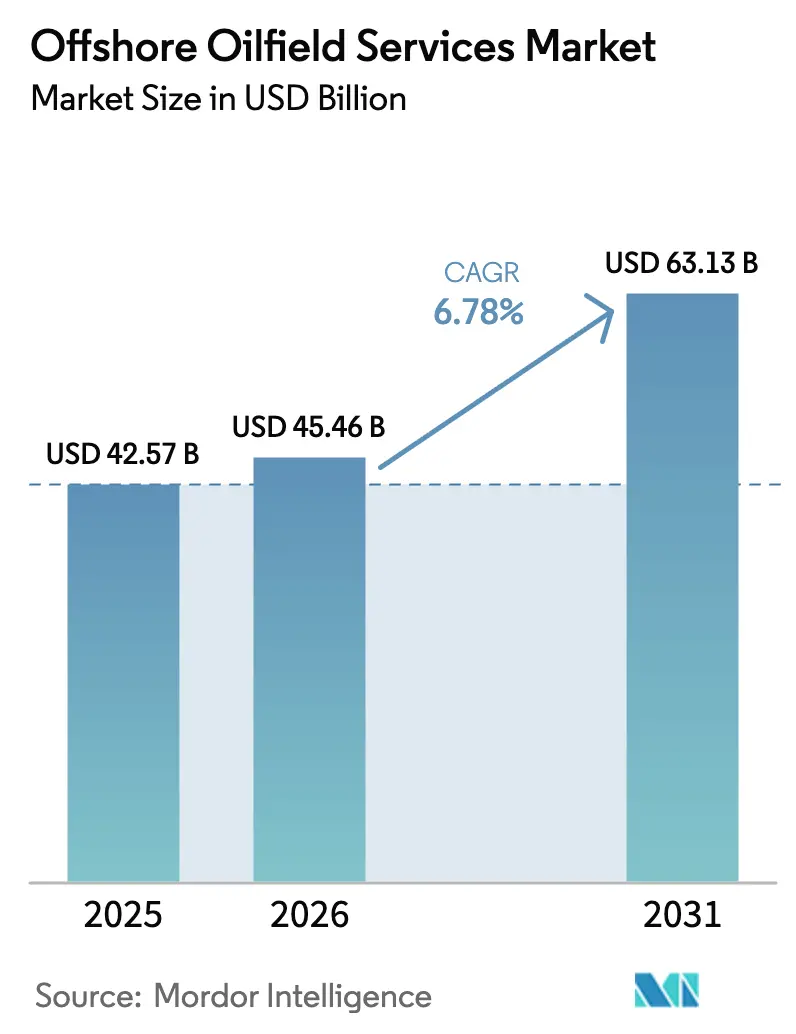
| Market Size (2026) | USD 45.46 Billion |
| Market Size (2031) | USD 63.13 Billion |
| Growth Rate (2026 - 2031) | 6.78 % |
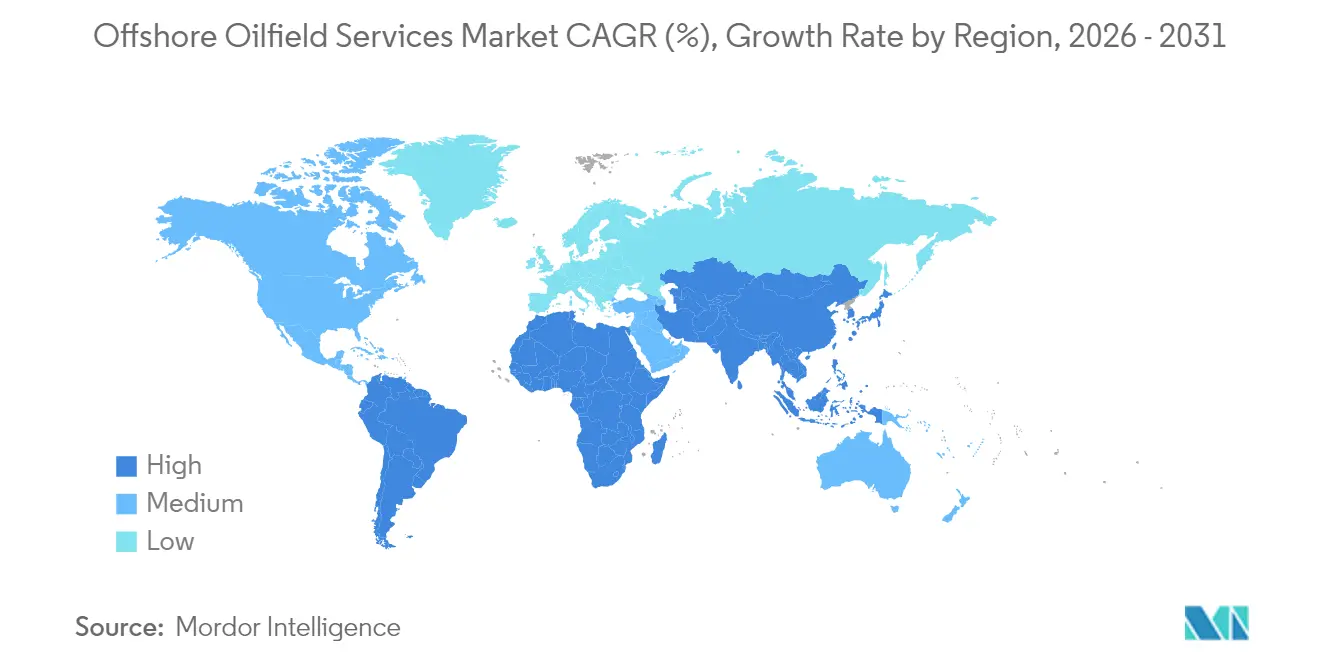
| Fastest Growing Market | South America |
| Largest Market | Asia Pacific |
| Market Concentration | Medium |
Major Players *Disclaimer: Major Players sorted in no particular order Image © Mordor Intelligence. Reuse requires attribution under CC BY 4.0. | |
Offshore Oilfield Services Market Analysis by Mordor Intelligence
Offshore Oilfield Services Market size in 2026 is estimated at USD 45.46 billion, growing from 2025 value of USD 42.57 billion with 2031 projections showing USD 63.13 billion, growing at 6.78% CAGR over 2026-2031.
Rebounding deep- and ultra-deepwater projects, tighter availability of premium rigs, and mandates for lower-emission operations contribute to the renewed momentum. Operators channel capital toward high-impact barrels while utilizing digital tools to enhance drilling efficiency and maintain breakeven costs below USD 50 per barrel. Contractors respond by expanding high-specification fleets, integrating real-time analytics into well delivery, and aligning with national content policies to secure long-term charters. Energy-security agendas in Asia-Pacific and the Middle East underpin multiyear drilling programs, while South American pre-salt developments anchor the next growth frontier.
Key Report Takeaways
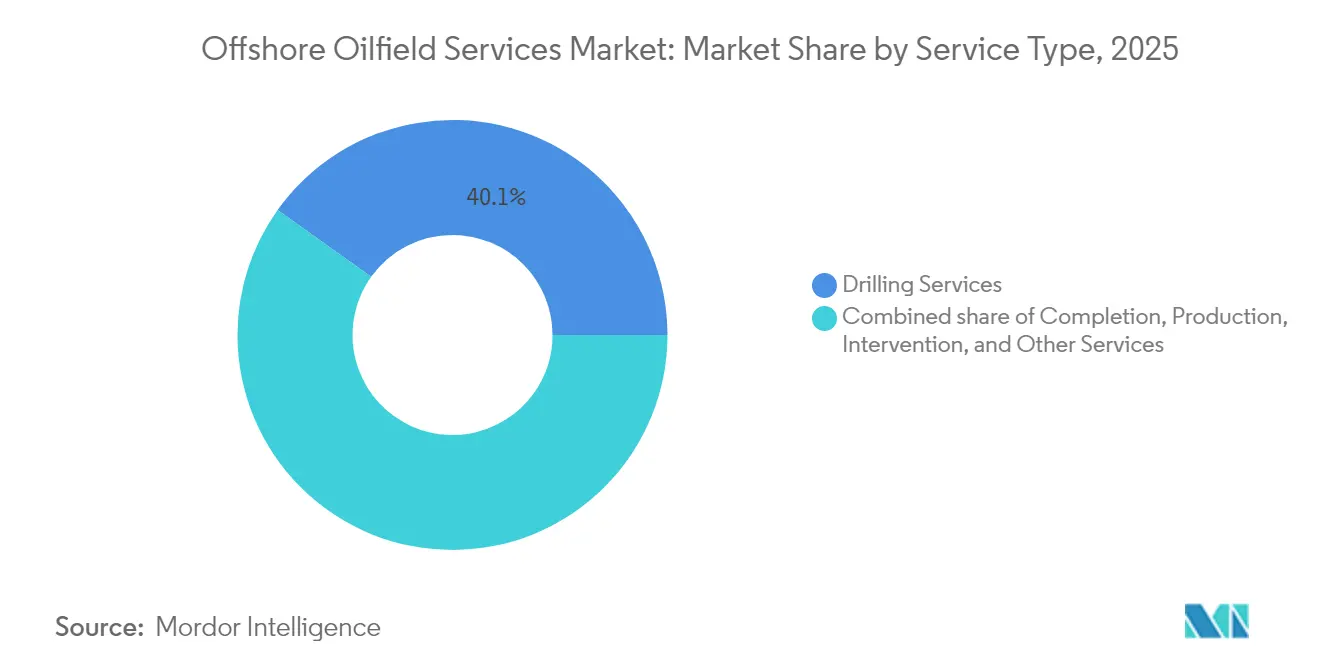
- By service type, drilling held 40.12% of the offshore oilfield services market share in 2025; production and intervention services are forecast to expand at a 7.25% CAGR through 2031.
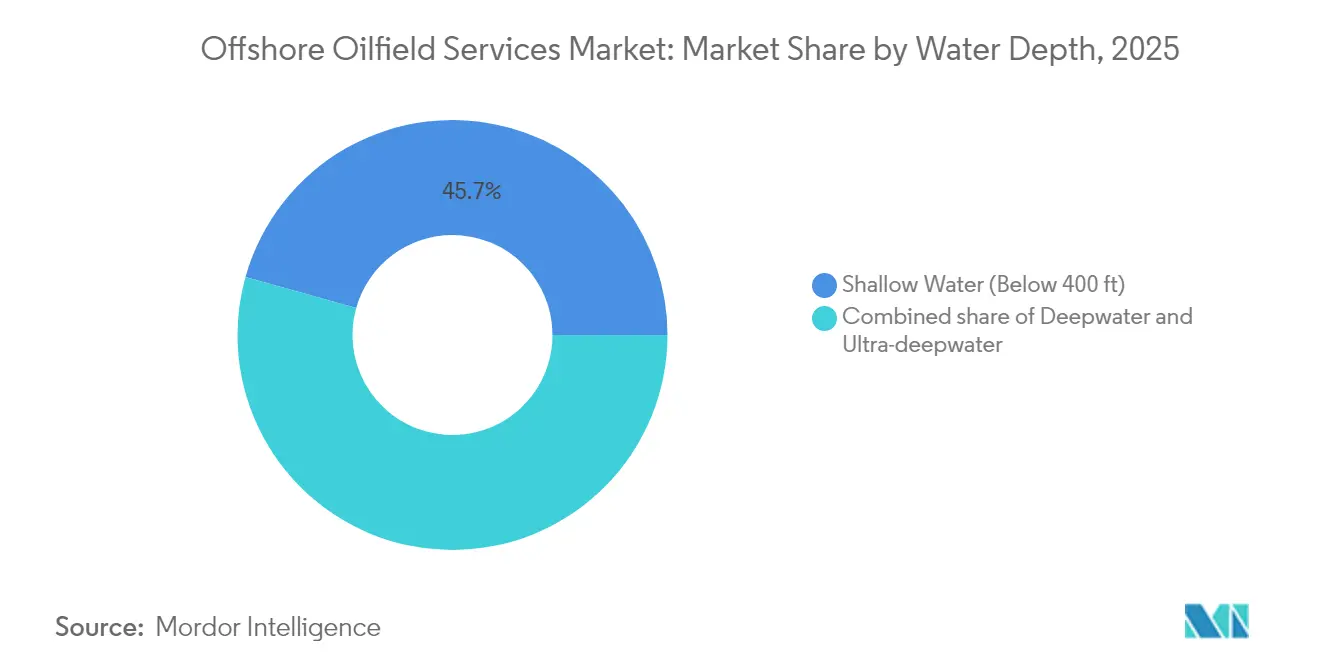
- By water depth, shallow-water operations below 400 ft led with 45.65% share in 2025; ultra-deepwater projects above 5,000 ft are set to grow at an 8.12% CAGR to 2031.
- By geography, Asia-Pacific commanded 47.15% of 2025 revenue, while South America is projected to record an 7.62% CAGR through 2031.
Note: Market size and forecast figures in this report are generated using Mordor Intelligence’s proprietary estimation framework, updated with the latest available data and insights as of 2026.
Global Offshore Oilfield Services Market Trends and Insights
Drivers Impact Analysis*
| Driver | (~) % Impact on CAGR Forecast | Geographic Relevance | Impact Timeline |
|---|---|---|---|
| Deep- & ultra-deepwater drilling up-cycle | +0.9% | Gulf of Mexico, Brazil, West Africa | Medium term (2-4 years) |
| Modern jack-up and 7G drillship shortage | +0.7% | Asia-Pacific, Middle East | Short term (≤ 2 years) |
| Energy-security charter push in Asia & MENA | +0.6% | Asia-Pacific core, spill-over to MENA | Long term (≥ 4 years) |
| Digital-first integrated service contracts | +0.5% | North America, Europe, global follow-on | Medium term (2-4 years) |
| Decommissioning wave in mature basins | +0.4% | UKCS, Australia, Gulf of Mexico | Long term (≥ 4 years) |
| Methane-credit rules for offshore vessels | +0.3% | Europe, North America, global enforcement | Medium term (2-4 years) |
| Source: Mordor Intelligence | |||
Up-cycle in Deep- & Ultra-Deepwater Drilling Commitments
Drillship utilisation is on track to hit 97% in 2025, a sharp reversal from the lows of 2020, as projects such as SLB’s USD 800 million Trion contract in Mexico and BP’s Kaskida development re-enter execution phases[1]. Namibia’s recent multi-billion-barrel finds add fresh acreage to the deepwater pipeline. Contractors lean on dual-BOP drillships, dynamic positioning, and subsea processing to unlock once uneconomic resources. Operators, confident in long-run demand, accept longer lead times in exchange for scalable barrels and inject digital twins to keep well costs predictable. Ultra-deepwater reservoirs above 5,000 ft therefore emerge as core acreage for future production growth.
Supply–Demand Crunch for Modern Jack-ups & 7G Drillships
Seventh-generation drillships now command day rates near USD 500,000 and secure multi-year deals, exemplified by Noble Corporation’s fleet expansion and USD 7.5 billion backlog following its Diamond Offshore purchase[2]. Jack-up utilisation is projected to be 86% in 2025 across Southeast Asia and the Middle East, where shallow-water demand remains resilient. Limited newbuild activity since 2015, combined with the accelerated scrapping of older rigs, underpins the tightness. Operators therefore lock in rigs earlier and for longer terms, while contractors fast-track reactivations and invest in dual-activity upgrades to capture premium pricing.
National Energy-Security Push in Asia & MENA
Long-term charters are gaining traction as governments prioritize domestic output. Qatar committed more than USD 5 billion to offshore LNG and oil developments, while Kuwait extended its six-well offshore campaign to 2026. China launched the Meng Xiang deep-ocean vessel, capable of drilling 11 km, signaling its intent to reduce foreign rig reliance. These charters often include technology-transfer clauses and local-content quotas, reshaping service models and giving regional contractors larger roles.
Digital-First Integrated Service Contracts
Baker Hughes’ AI-enabled well optimisation for Saudi Aramco reduced non-productive time by double-digit percentages, demonstrating real-time optimisation at scale[3]. Oceaneering International’s connected ROV fleet shows similar gains in subsea inspection. Operators are increasingly bundling drilling, completions, and production monitoring into outcome-based contracts, shifting risk to service providers that can deliver data-driven execution. This digital shift is especially valuable in deepwater, where real-time alerts prevent high-cost downtime and improve safety.
Restraints Impact Analysis*
| Restraint | (~) % Impact on CAGR Forecast | Geographic Relevance | Impact Timeline |
|---|---|---|---|
| SEMI-sub day-rate compression amid fleet over-capacity | -0.5% | Global, particularly North Sea and Gulf of Mexico | Short term (≤ 2 years) |
| FX-driven cost inflation for crew & consumables | -0.4% | Global, with acute impact in emerging markets and cross-border operations | Short term (≤ 2 years) |
| ESG-driven capital rationing by Western lenders | -0.3% | North America & EU, with spillover to global projects | Medium term (2-4 years) |
| Chronic shortage of HPHT-graded BOP spare parts | -0.2% | Global deepwater operations, concentrated in Gulf of Mexico, Brazil, West Africa | Medium term (2-4 years) |
| Source: Mordor Intelligence | |||
Semi-Sub Day-Rate Compression Amid Fleet Over-Capacity
Fifth- and sixth-generation semi-submersibles face muted demand as deepwater clients pivot to more versatile drillships. Several Gulf of Mexico units roll off contract in 2025 without timely follow-up work, pulling regional utilisation below fleet averages. Operating costs for semi-submersibles remain higher than those of drillships at comparable water depths, limiting their competitiveness outside specific harsh-environment niches. Contractors defer upgrades and, in some cases, recycle ageing units to stabilise supply. The imbalance weighs on profitability and acts as a drag on new technology investment.
ESG-Driven Capital Rationing by Western Lenders
Banks in Europe and North America are attaching stricter emissions criteria to upstream funding, thereby rerouting some capital toward renewables. Smaller independents struggle to secure project finance and often look to national oil companies or specialised energy lenders willing to accept higher carbon footprints. The funding gap accelerates asset divestitures, prompting consolidation in the offshore oilfield services industry as larger players use balance-sheet strength to acquire distressed assets.
*Our forecasts treat driver/restraint impacts as directional, not additive. The impact forecasts reflect baseline growth, mix effects, and variable interactions.
Segment Analysis
By Service Type: Drilling Dominance Amid Production Growth
Drilling services continued to lead the offshore oilfield services market with 40.12% revenue share in 2025, supported by capital-intensive rigs that remain indispensable for field development. The offshore oilfield services market size tied to drilling is driven by long-cycle deepwater projects that require high-specification assets for several years. High day-rates improve contractor margins and enable reinvestment in dual-activity and automation upgrades. Completion and workover scopes expand as designs become more complex, while data-rich logging guides stimulation programs that enhance recovery factors.
Production and intervention services are poised for a 7.25% CAGR through 2031 as operators maximise output from existing wells using coiled-tubing, wireline, and hydraulic intervention packages. This pivot aligns with capital discipline, offering shorter payback windows compared with new field developments. Ancillary services—such as seismic, aviation, offshore support vessels, and decommissioning—add resilience to the offshore oilfield services market, broadening contractor portfolios. Seadrill’s merger talks with Transocean exemplify the sector’s consolidation drive, aiming for operating synergies and balanced exposure across drilling and production services.

By Water Depth: Shallow Foundations, Ultra-Deep Frontiers
Shallow-water campaigns below 400 ft accounted for 45.65% of 2025 revenue, as jack-ups delivered cost-effective solutions in the Middle East, Southeast Asia, and Mexico. Established pipelines, processing hubs, and shorter development cycles keep operating costs low, enabling national oil companies to secure rapid production additions. The offshore oilfield services market size associated with shallow-water rigs remains sizable, yet growth moderates as easy barrels decline.
Ultra-deepwater projects above 5,000 ft are expected to register the fastest 8.12% CAGR to 2031, driven by pre-salt Brazil, frontier Namibia, and resource-rich US Gulf prospects. Floating production units, long-distance tiebacks, and next-generation blowout preventer systems increase service complexity and value per well. China’s Meng Xiang vessel, capable of drilling to a depth of 11 km, underscores the technology race to reach deeper reservoirs. Contractors that combine rig capability with integrated well services capture larger work scopes and higher margins, reinforcing a two-track market where shallow-water volume supports stability and ultra-deepwater innovation propels premium growth.
Geography Analysis
Asia-Pacific accounted for 47.15% of 2025 revenue, a leadership position anchored by China’s drive for supply security, Southeast Asia’s mature brownfields, and Australia’s emerging USD 60 billion decommissioning opportunity. CNOOC plans to exceed 2 million BOE per day in 2025, backed by RMB 125–135 billion (USD 17.4–18.8 billion) capital expenditure focused on Bozhong 26-6, Kenli 10-2, and Yellowtail. New Chinese rigs, such as Meng Xiang, lift domestic capability and reduce reliance on foreign units, while long-term charters secure drilling capacity for LNG-expansion projects.
South America is the fastest-growing region, projected to grow at a 7.62% CAGR. Petrobras has earmarked USD 111 billion for the 2025–2029 period, with the Búzios 7 and Mero phases requiring extensive subsea, FPSO, and well-construction services. Guyana is expected to reach an output of 800,000 bpd by 2025, creating significant demand for subsea trees, support vessels, and topside modifications. Suriname and Trinidad add exploration upside, sustaining multi-rig campaigns that feed the regional project queue.
North America’s Gulf of Mexico retains a deepwater core of high-productivity assets, benefiting the offshore oilfield services market through steady appraisal wells and brownfield redevelopments. Europe balances the decline in the North Sea with a growing decommissioning backlog that requires plug-and-abandonment expertise. The Middle East and Africa see diversified growth: Qatar, UAE, and Saudi Arabia invest in gas capacity, while Namibia, Angola, and Nigeria court exploration budgets for frontier plays.
Regulatory Landscape
Regulation for offshore oilfield services is tightening around safety assurance, emissions performance, and leasing predictability, with basin- and regulator-specific requirements. In the United States, the Outer Continental Shelf Lands Act underpins the federal framework, with BOEM administering the 11th National OCS Oil and Gas Leasing Program (public comment periods opened in April 2025 and November 2025, with the latest closing in January 2026). In parallel, BSEE continues its hybrid prescriptive and performance-based oversight for offshore operations, and in March 2026 advanced proposed revisions (AA63) tied to blowout preventer systems and well-control submissions, which raises the emphasis on documented BOP readiness and standardized compliance workflows across drilling and well-intervention scopes.
Outside the United States, operators and NOCs increasingly build national and regional compliance expectations into contracting, including technology-transfer and local-content provisions that shape how service providers staff, source, and execute work. This is visible in long-duration offshore programs in Asia and the Middle East, where tender qualification and contract award pathways favor suppliers that can demonstrate auditable HSE systems, traceable equipment maintenance, and in-country capability building alongside emissions-related operating practices for rigs and offshore support fleets.
Competitive Landscape
The offshore oilfield services market exhibits moderate concentration, as integrated majors such as Schlumberger, Halliburton, and Baker Hughes combine digital platforms with global asset bases to secure outcome-based contracts. Drilling contractors such as Transocean, Valaris, and Noble Corporation differentiate themselves on fleet capability, safety metrics, and execution track record; the latter now commands the largest set of 7G dual-BOP drillships following its acquisition of Diamond Offshore.
Helmerich & Payne’s USD 1.97 billion purchase of KCA Deutag rebalanced its land-rig exposure by adding 88 offshore units and asset-light management contracts in the North Sea and Africa. Consolidation delivers scale, broader geographic reach, and cost synergies in procurement and maintenance. Smaller specialists remain competitive in niches—such as subsea intervention, wellbore cleanup, and FPSO maintenance—where proprietary tools or certifications create high entry barriers.
Technology adoption now sits at the centre of differentiation. AI-based drilling parameter optimisation reduces stuck-pipe incidents, while predictive maintenance slashes unplanned downtime on critical rotating equipment. ESG credentials also influence tender outcomes: contractors that certify lower-carbon rigs, electrify support vessels, or integrate methane-capture kits gain scoring advantages during bid evaluations.
Offshore Oilfield Services Industry Leaders
-
Transocean LTD
-
Schlumberger Limited
-
Baker Hughes Company
-
Halliburton Company
-
TechnipFMC
- *Disclaimer: Major Players sorted in no particular order

Market Opportunities and Future Outlook
Near-term whitespace for offshore oilfield services clusters around technically complex deepwater developments, where integrated delivery models reduce interfaces across drilling, subsea, and production systems. Contracting activity in 2026 points to this shift: TechnipFMC secured an iEPCI award for bp's 20,000 psi Tiber project in the Gulf of America, underscoring demand for high-pressure equipment and end-to-end project execution capabilities. The North Sea is also showing renewed subsea and field-development workscopes, with TechnipFMC winning iEPCI work for Vaar Energi, supporting opportunities for subsea trees, umbilicals, and installation services tied to multi-project portfolios.
A second opportunity cluster is forming around long-term capacity commitments for high-specification rigs and associated marine logistics, especially in harsh-environment and energy-security-driven basins. Transocean's June 2026 multi-rig agreement with Equinor for three harsh-environment semisubmersibles on the Norwegian shelf (over USD 1 billion in contract backlog across seven rig years) signals multi-year demand visibility that can cascade into risers, well-control equipment support, subsea intervention readiness, and shore-base services. As operators move toward outcome-based and digital-first contracting, service providers with real-time optimization tools, connected subsea fleets, and reliable spares visibility across global supply chains have room to expand wallet share, particularly where BOP spare-part constraints and premium-rig tightness raise the value of reliability and uptime.
Recent Industry Developments
- July 2026: SLB OneSubsea joint venture secured a multi-well EPC contract from Eni to deliver complete subsea production systems for 13 wells at Phase 3 of the deepwater Baleine project offshore Cte d'Ivoire. The deal expands offshore installation capabilities and strengthens subsea system integration for deepwater developments, supporting project execution efficiency and long-term production uptime in West Africa.
- June 2026: Transocean announced a multi-rig agreement with Equinor for three Cat D harsh environment semisubmersibles on the Norwegian shelf, valued at over $1 billion in contract backlog across seven rig years. The agreement expands Transocean's presence in Norway and provides high-specification capacity to support multi-year drilling programs in harsh environments.
- June 2026: Transocean announced contract awards for two harsh environment semisubmersibles totaling $185 million, including a five-well contract for Transocean Norge with Harbour Energy (Norway) and a two-well contract for Transocean Equinox with Santos (Australia). The awards diversify utilization across Norway and Australia, boosting near-term backlog and reinforcing high-spec fleet utilization for regional projects.
Research Methodology Framework and Report Scope
Market Definition and Coverage
For this study, the offshore oilfield services market is defined as revenue earned from services delivered to offshore upstream projects. This includes drilling, well completion, and production and intervention work across offshore assets globally.
Scope exclusions: We exclude onshore oilfield services and pure equipment manufacturing sales unless they are bundled and priced as a service under the offshore contract.
Segmentation Overview
- By Service Type
- Drilling Services
- Completion Services (Cementing, Hydraulic Fracturing)
- Production and Intervention Services
- Other Services (OSV, seismic, decomm., aviation)
- By Water Depth
- Shallow Water (Below 400 ft)
- Deepwater (400 to 5,000 ft)
- Ultra-deepwater (Above 5,000 ft)
- By Geography
- North America
- United States
- Canada
- Mexico
- Europe
- Germany
- United Kingdom
- Norway
- Russia
- Rest of Europe
- Asia-Pacific
- China
- India
- Thailand
- Vietnam
- Australia
- Rest of Asia-Pacific
- South America
- Brazil
- Trinidad and Tobago
- Rest of South America
- Middle East and Africa
- Saudi Arabia
- United Arab Emirates
- Qatar
- Egypt
- Nigeria
- Angola
- Namibia
- Rest of Middle East and Africa
- North America
Data Sources, Market Sizing, and Validation
Desk Research
Desk research was used to build the initial demand and activity view for offshore projects, and to align the model with common industry definitions. We mainly pulled offshore upstream context from public sources such as the IEA, the US EIA, and OPEC, along with offshore project and permitting signals from sources such as the US Bureau of Ocean Energy Management (BOEM) and the Norwegian Petroleum Directorate.
To support the rate and activity side, we also reviewed public offshore statistics and reports from sources such as the International Association of Drilling Contractors (IADC) and offshore regulator publications across key producing regions. We then tied these signals back to company annual reports, investor presentations, and contract award coverage in business press. For consistency checks, a paid subscription database was used for company financials and news screening, and a paid patent database was used to sense-check subsea and intervention technology direction. The sources listed here are illustrative only, and additional public and paid references were used to collect data, validate it, and clarify open questions during the work.
Primary Interviews and Surveys
Primary work was used to pressure test desk assumptions and to separate offshore service revenue that is truly addressable from adjacent offshore spending. We spoke with a mix of contractors, offshore operators, and project support participants, and the discussions covered APAC, EMEA, and the Americas so regional cycles and pricing differences were reflected in the final model.
Distribution of primary research fieldwork respondents
| Company type | Respondent position | Region |
|---|---|---|
| Top tier: 25% | CXOs: 14% | APAC: 44% |
| Mid tier: 61% | Functional/Unit leaders: 31% | EMEA: 36% |
| Smaller Players: 14% | Managers: 55% | Americas: 20% |
Market-Sizing & Forecasting
The sizing starts with a top-down build where offshore activity and spending signals are reconstructed into an addressable services pool by service intensity. We use indicators such as offshore upstream spending direction, active offshore rig signals, offshore well count and complexity, and deepwater versus shallow-water mix so totals do not drift away from what is feasible in the field.
After that, selective bottom-up approximations are used to corroborate the totals. This mainly involves rolling up a sample of supplier revenues tied to offshore work, then checking the implied pricing against rate direction shared by interviewees. Where company disclosures mix offshore and onshore, allocation keys are applied using business mix cues and contract language, followed by a recheck through follow-up calls so gaps do not remain unresolved.
For forecasting, scenario analysis is used because the market is sensitive to offshore approvals, project timing slips, and cost inflation. The forward view is anchored on variables such as offshore project sanction pipeline, expected deepwater share, service pricing progression, brownfield intervention needs, and regional permitting cadence, and then adjusted with expert consensus where public data is thin.
Data Validation & Update Cycle
Outputs are triangulated against independent signals, such as offshore upstream capex direction, regional offshore activity indicators, and implied revenue per unit of work, before numbers are finalized. When a variance shows up, it is traced to a specific driver such as water-depth mix, service price movement, or a one-off project start. Assumptions are then revised and checked again.
Each study is reviewed in multiple analyst steps, with targeted re-contacts triggered when the model conflicts with field feedback or when large contract awards shift near-term demand. Reports are refreshed annually, with interim updates for material events, and a final pre-delivery pass completed so clients receive the latest updated view.
Mordor Intelligence's Offshore Oilfield Services Market Estimate Compared With Other Published Estimates
Published market sizes for offshore oilfield services can diverge because the counted service lines are not always the same, and base years, currency timing, and pricing progression assumptions can differ. Some sources group offshore services into broader upstream spending buckets, which can quietly expand the total even when the title appears similar.
The table shows the spread, and in Mordor Intelligence's model, the 2026 value is built from offshore drilling, completion, and production and intervention services only. It is kept separate from offshore equipment sales that are not priced as part of a service contract, which can otherwise inflate broader estimates.
Benchmark comparison
| Source | Market Size | Gaps in Research Methodology |
|---|---|---|
| Mordor Intelligence | USD 45.46 B (2026) | |
| Industry Publisher A | USD 87.20 B (2024) | This figure is commonly presented as a wider offshore spend view that can blend services with equipment and integrated project value, and it can also use different base-year pricing and currency timing. |
| Industry Publisher B | USD 48.95 B (2026) | This estimate can run higher when more offshore support activities are included under services and when day-rate and service-rate escalation is applied more aggressively through the base period. |
Across the three figures, most of the difference comes from scope boundaries around what counts as a service, and then from how rate escalation and currency timing are handled. Our model keeps assumptions tied to observable offshore activity and rate signals, which makes the total easier to reproduce and refresh when project timing changes.
Key Questions Answered in the Report
What is the current value of the offshore oilfield services market?
The market is valued at USD 45.46 billion in 2026 and is expected to reach USD 63.13 billion by 2031.
Which service segment leads revenue generation?
Drilling services top the revenue chart with 40.12% share in 2025, reflecting the capital-intensive nature of offshore exploration.
Which region is growing the fastest?
South America is projected to grow at an 7.62% CAGR through 2031, led by Brazil’s pre-salt and Guyana’s new production.
Why are ultra-deepwater projects gaining traction?
Technological breakthroughs in subsea processing and high-specification drillships enable cost-competitive access to reserves deeper than 5,000 ft.
How does digital technology affect offshore service contracts?
Real-time analytics and remote operations reduce non-productive time, prompting operators to shift toward outcome-based integrated service agreements.
What drives consolidation among drilling contractors?
Asset scarcity, the need for balanced global footprints, and the pursuit of cost synergies encourage mergers such as Noble’s purchase of Diamond Offshore and H&P’s acquisition of KCA Deutag.