
Offshore Drilling Market Size and Share
Market Overview
| Study Period | 2021 - 2031 |
|---|---|
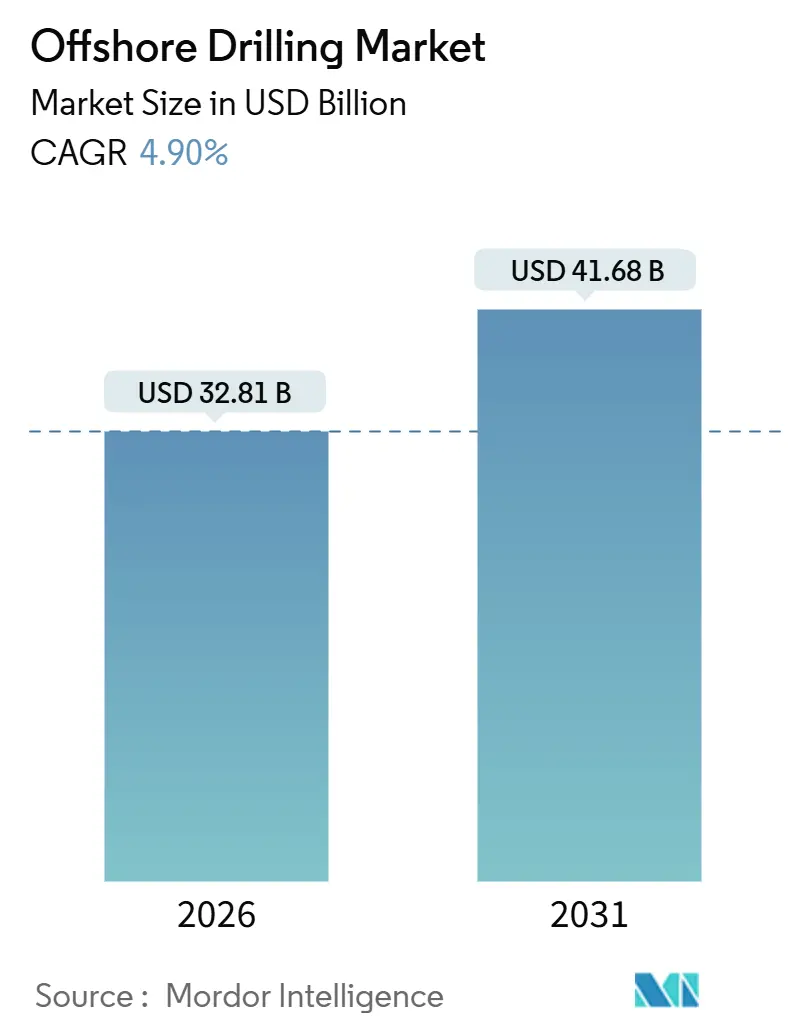
| Market Size (2026) | USD 32.81 Billion |
| Market Size (2031) | USD 41.68 Billion |
| Growth Rate (2026 - 2031) | 4.90 % |
| Fastest Growing Market | Middle-East and Africa |
| Largest Market | Middle East and Africa |
| Market Concentration | Medium |
Major Players *Disclaimer: Major Players sorted in no particular order Image © Mordor Intelligence. Reuse requires attribution under CC BY 4.0. | |
Offshore Drilling Market Analysis by Mordor Intelligence
The offshore drilling market size reached USD 31.22 billion in 2025 and is projected to climb to USD 32.81 billion in 2026, eventually advancing to USD 41.68 billion by 2031 at a 4.90% CAGR, underscoring a steady upswing in upstream spending on complex wells and longer-life reservoirs. Energy-security mandates in the Middle East and Asia continue to steer capital into multi-decade offshore programs, while deepwater discoveries in Guyana, Brazil, and Namibia shift contractor focus toward high-specification drillships. Tight supply of hybrid-ready rigs, the adoption of autonomous drilling systems, and a structural crew shortage are elevating day rates and stretching backlogs. Simultaneously, national oil companies are crowding out independent explorers, reshaping demand cycles, and reducing the volatility previously caused by short-term shale swings. Competitive positioning now hinges on emissions-reduction technology and digital uptime tools that translate directly into lower fuel burn and higher well counts per rig.
Key Report Takeaways
- By well type, conventional wells held 90.33% of the offshore drilling market share in 2025; unconventional wells are poised to expand at a 10.49% CAGR through 2031.
- By water depth, shallow-water projects captured 51.11% of the offshore drilling market size in 2025, while deepwater and ultra-deepwater activity is advancing at a 6.11% CAGR through 2031.
- By service, the exploration and development drilling segment captured a 40.64% share of the market size in 2025; plug and abandonment is projected to grow at a 10.67% CAGR through 2031.
- By geography, the Middle East and Africa commanded 31.09% of 2025 revenue, and the same is projected to grow at 5.50% over the forecast horizon, outpacing North America and Europe.
Note: Market size and forecast figures in this report are generated using Mordor Intelligence’s proprietary estimation framework, updated with the latest available data and insights as of January 2026.
Market Trends and Insights
Drivers Impact Analysis of Offshore Drilling Market*
| Driver | (~) % Impact on CAGR Forecast | Geographic Relevance | Impact Timeline |
|---|---|---|---|
| Growing jack-up demand in Middle East mega-programs | 1.2% | Middle East (UAE, Qatar, Kuwait), with spillover to India and Southeast Asia | Medium term (2-4 years) |
| Deepwater discoveries in Brazil, Guyana & Namibia | 1.5% | South America (Brazil, Guyana), Africa (Namibia, Angola) | Long term (≥4 years) |
| E&P CAPEX rebound above 2014 levels | 0.9% | Global, concentrated in Middle East, North America, Asia-Pacific | Short term (≤2 years) |
| Hybrid-powered low-carbon rigs slash fuel burn | 0.6% | Global, early adoption in North Sea, Gulf of Mexico, Brazil | Medium term (2-4 years) |
| Autonomous drilling & digital twins lift uptime | 0.5% | North America, Europe (Norway, UK), Asia-Pacific (Australia) | Medium term (2-4 years) |
| Growing demand for natural gas and developing gas infrastructure | 0.8% | Asia-Pacific (China, India, ASEAN), Middle East (Qatar), Australia | Long term (≥4 years) |
| Source: Mordor Intelligence | |||


Growing Jack-up Demand in Middle East Mega-Programs
Multi-year contracts signed by national oil companies in the Arabian Gulf keep jack-up utilization above 90% even as Saudi production cuts introduce spot-rate volatility. ADNOC’s USD 1.15 billion award for two high-specification units in May 2025, locked in fifteen-year charters and expanded the contractor’s fleet past 140 rigs, mirroring QatarEnergy’s requirement for additional capacity tied to a 126 million-tonnes LNG build-out.[1]Abu Dhabi National Oil Company, “Investor Presentation May 2025,” adnoc.ae Shelf Drilling and Borr Drilling benefit from this surge, while India’s ONGC pursues a similar long-term model in the Krishna-Godavari basin. The offshore drilling market, therefore, enjoys improved backlog visibility, though episodic oversupply remains possible whenever OPEC+ quotas constrain Saudi activity.
Deepwater Discoveries in Brazil, Guyana & Namibia
Ultra-deepwater finds exceeding 7,500 feet are redefining commercial breakevens, with Petrobras, ExxonMobil, and TotalEnergies sanctioning multi-billion-barrel fields that favor dynamic-positioning drillships. Atapu-2 and Sépia-2 anchor Transocean and Noble backlogs through the decade, while Equinor’s Bacalhau delivered first oil at sub-USD 35/bbl breakevens in 2025.[2]Petrobras, “Investor Relations Presentation 2025,” petrobras.com.br Namibia’s Orange Basin attracts early-stage capital, indicating that the offshore drilling market will lean increasingly on frontier basins for future growth.
E&P CAPEX Rebound Above 2014 Levels
Global upstream investment exceeded the prior-cycle peak in 2025 as Middle East national oil companies accounted for a record 20% share, redirecting funds from shale toward sustained offshore campaigns. Cost inflation cooled to 3% in 2025, improving project return profiles even as labor expenses rose. Independent North American producers, however, trimmed deepwater budgets in favor of the Permian, consolidating offshore drilling market demand among capital-rich majors and state-owned entities.
Hybrid-Powered “Low-Carbon” Rigs Slash Fuel Burn
Hybrid battery integration reduces fuel use by 15-25%, delivering USD 3–5 million in annual savings per rig. Transocean’s Deepwater Atlas posted a 20% fuel cut and 96% uptime in the Gulf of Mexico, while Seadrill’s Capella achieved similar gains in the North Sea.[3]Transocean Ltd., “Form 10-K 2024,” transocean.com Favorable economics and looming IMO Tier III rules accelerate adoption, giving technologically advanced contractors an edge in negotiating premium day rates.
Restraints Impact Analysis of Offshore Drilling Market*
| Restraint | (~) % Impact on CAGR Forecast | Geographic Relevance | Impact Timeline |
|---|---|---|---|
| Accelerating switch to offshore wind lease blocks | -0.7% | Europe (UK, Netherlands, Germany), North America (US East Coast), Asia-Pacific (Taiwan, Japan) | Medium term (2-4 years) |
| Volatile Brent breakevens curb FIDs | -0.5% | Global, acute in North America (Gulf of Mexico), Europe (North Sea) | Short term (≤2 years) |
| Offshore-crew shortage inflates OPEX | -0.4% | Global, most severe in North America, Europe, Australia | Medium term (2-4 years) |
| ESG-driven capital drought for newbuild rigs | -0.3% | Europe, North America, with spillover to Asia-Pacific | Long term (≥4 years) |
| Source: Mordor Intelligence | |||
Accelerating Switch to Offshore Wind Lease Blocks
Seabed acreage and heavy-lift vessels are being redirected to UK, U.S., and Dutch wind projects, tightening resource pools that once served offshore hydrocarbon campaigns. Labor premiums for crane operators and subsea technicians climbed 25-30% between 2024 and 2025, squeezing operating margins for drilling contractors.
Volatile Brent Breakevens Curb FIDs
Price swings between USD 70–90/bbl delayed marginal deepwater projects in the Gulf of Mexico and the North Sea. Operators now require multi-year price certainty to greenlight billion-dollar developments, trimming near-term rig demand even as low-breakeven South American projects proceed.[4]Chevron Corporation, “Investor Day Transcript 2025,” chevron.com
*Our forecasts treat driver/restraint impacts as directional, not additive. The impact forecasts reflect baseline growth, mix effects, and variable interactions.
Offshore Drilling Market Segment Analysis
By Well Type:
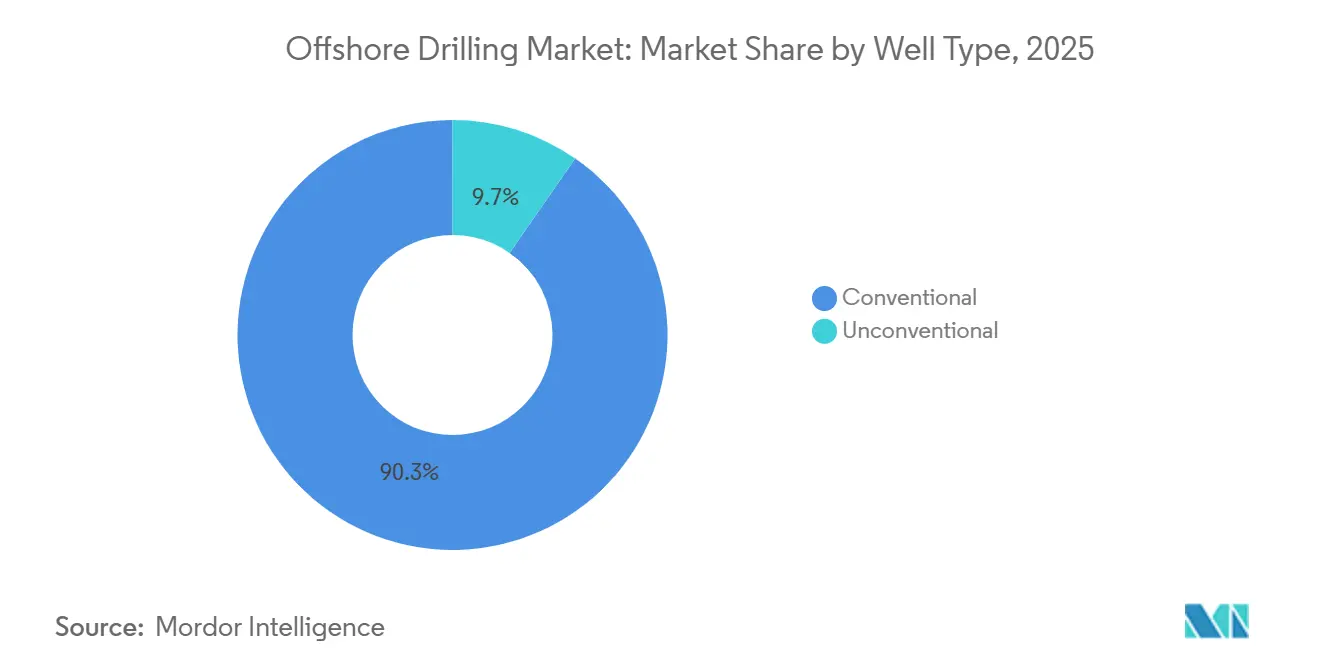
Unconventional Offshore Gains TractionConventional wells controlled 90.33% of the offshore drilling market share in 2025, reflecting decades of accumulated subsurface data that de-risk projects in the Gulf of Mexico, the North Sea, and offshore. Predictable geology and proven completion techniques let operators convert prospects quickly, keeping development cycles short and cash-flow visibility high. However, unconventional offshore wells are expanding at a 10.49% CAGR through 2031 as horizontal drilling and hydraulic-fracturing methods, refined onshore, migrate to shallow-water settings and unlock tight reservoirs previously viewed as non-commercial. Extended-reach and multilateral designs allow producers to tap new pay zones from existing platforms, trimming upfront capital and stretching field life. The unconventional offshore drilling market size associated with these developments, therefore, represents a growing slice of new-project sanctioning as conventional discovery rates wane and lease inventories mature.
Momentum is sharpest in basins where legacy assets offer infrastructure head starts, letting operators drill long-step-out laterals without building new hubs. BP’s “design one and build many” template for compact facilities exemplifies how simplified topsides, standardized wellhead trees, and factory-style execution lower break-evens and shorten schedules. Contractors that supply precision rotary-steerable systems, high-horsepower frac spreads, and real-time downhole telemetry stand to benefit as operators seek tighter well spacing and higher stimulated reservoir volumes. Because unconventional programs often involve a higher well count per field, service intensity rises, anchoring a durable demand stream that augments traditional exploration and appraisal work. As a result, the offshore drilling market is transitioning toward a dual-track model in which high-spec rigs chase deepwater prospects while adaptable jackups and platform rigs exploit near-field unconventional targets.


By Water Depth:
Ultra-deepwater Economics Redefine Value CreationShallow-water wells less than 400 ft deep accounted for 51.11% of the offshore drilling market share in 2025, supported by mature infrastructure and short, two-to-three-year lead times that let operators react quickly to price swings. Saudi Aramco’s jack-up program has pushed regional utilization above 84%, preserving a large, low-cost production base even as discovery sizes decline. These projects continue to attract capital because they can be tied back to existing platforms at modest cost, yet rising depletion has forced producers to lean on infill drilling and unconventional targets to sustain output.
Ultra-deepwater campaigns beyond 1,500 m are expanding at a 9.22% CAGR through 2031 as technological advances and multi-billion-barrel finds flip the cost-of-supply curve in their favor. BP’s planned final investment decision on the 6 billion-boe Tiber discovery and TotalEnergies’ Venus success in 2,000-m water prove that breakevens can dip below USD 20 per barrel, redefining the offshore drilling market size that operators target for growth. Drillship utilization is on track to hit 97% in 2025, handing pricing power to contractors equipped with seventh-generation, dual-BOP units that can handle extreme depth and high-pressure wells. Deepwater programs in the 400-1,500 m band maintain steady activity, bridging legacy shelf projects and frontier ultra-deepwater plays while offering mid-cycle economics that diversify portfolio risk. Together, the bifurcated depth mix underscores how shallow water preserves volume leadership through efficiency, whereas ultra-deepwater now captures value leadership by pairing giant resource potential with rapidly improving technology.
By Service:
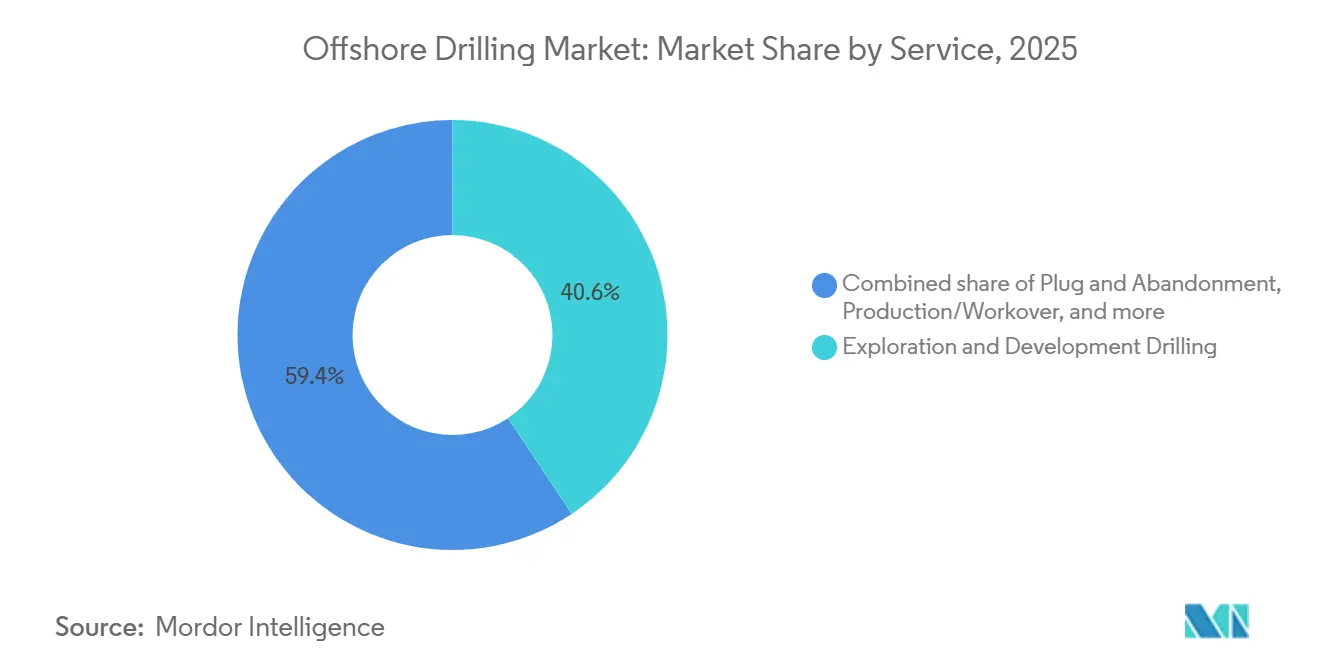
Decommissioning Drives Service Mix EvolutionExploration and development drilling delivered 40.64% of 2025 spending, buttressed by USD 214 billion of sanctioned offshore projects focused on high-return assets in Brazil, Guyana, and Namibia, where breakevens sit below USD 30 per barrel. Production drilling added steady volumes as operators pursued infill campaigns, while workover and intervention jobs kept mature fields online. Yet plug and abandonment (P&A) is the fastest-growing service line, advancing at a 10.67% CAGR through 2031 as infrastructure installed during the 1970-1990 build-out reaches end-of-life. The United Kingdom alone forecasts GBP 21 billion in decommissioning outlays this decade, prompting grants for AI-enabled planning tools and remote subsea cutting systems that can shrink project time and cost.
Saudi Arabia’s recent award to Subsea7 for well-abandonment work shows that even relatively young provinces are preparing for long-term liabilities. Regulators now demand full-scope removals and verified environmental baselines, cementing P&A as a non-discretionary spend category within the offshore drilling market size earmarked for services. Contractors that develop rigless abandonment spreads, dual-mode vessels, and in-situ pipe-cutting robotics can capture premium margins as operators prioritize risk reduction and stakeholder optics. The rising P&A backlog, therefore, rebalances the service mix, ensuring that cash flows from late-life asset retirement partially offset the cyclicality of front-end exploration drilling.
Geography Analysis
The Americas, EMEA and APAC Offshore Drilling Market
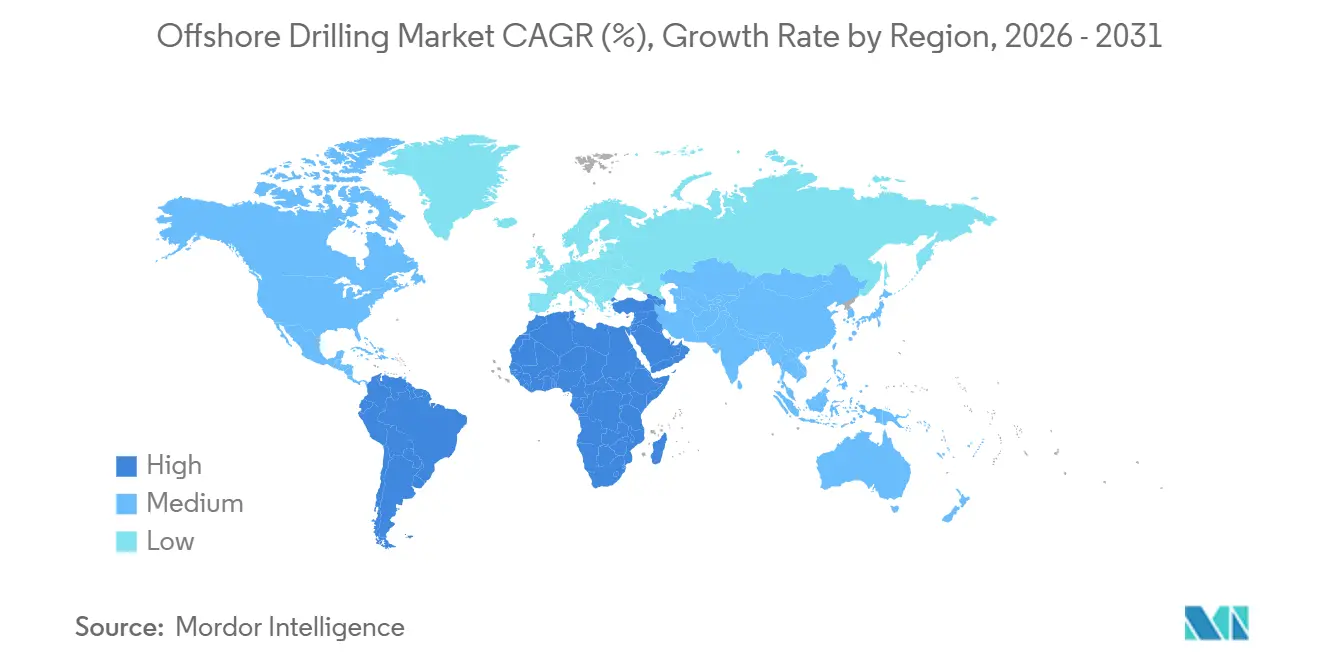
The Middle East and Africa lead the offshore drilling market with a 31.09% share and a 5.50% forecast CAGR. Long-term LNG-linked projects in Qatar, gas development in Saudi Arabia, and deepwater prospects in Nigeria and Angola underpin expansion. South America follows at roughly 22%, driven mainly by Brazil’s pre-salt and Guyana’s Stabroek Block. North America’s 18% share centers on the Gulf of Mexico, where high-pressure technology unlocks new reservoirs but competes with shale capital. Europe’s 15% share is anchored by Norwegian output, but wind-lease priority narrows hydrocarbon acreage. Asia-Pacific’s 14% stake reflects China’s Bohai Bay, India’s KG Basin, and Australia’s Scarborough gas project, each sustaining localized rig demand despite weather and logistics hurdles. These regional dynamics collectively give the offshore drilling market a balanced mix of mature and frontier opportunities.

Regulatory Landscape
In the United States, the Bureau of Safety and Environmental Enforcement (BSEE) has advanced multiple rule actions across 2024-2026 that affect deepwater planning, technology qualification, and equipment approval processes. An October 2024 final rule added requirements for new or unusual offshore technology (including HPHT) and revised Deepwater Operations Plan (DWOP) submissions, and a February 2026 proposal would revise the 2023 Blowout Preventer (BOP) Systems and Well Control Rule to streamline submissions and BOP approval procedures.
Outside the United States, regulators are increasingly shifting toward performance-based environmental compliance while expanding climate-related assessment requirements for offshore projects. Canada amended the Canada-Newfoundland and Labrador Offshore Area Petroleum Operations Framework Regulations in June 2026, moving from a volume-based gas venting limit to a general prohibition on venting subject to regulatory authorization, which raises the compliance bar for operating practices and monitoring. In the United Kingdom, OPRED issued supplementary guidance in June 2026 on assessing downstream scope 3 climate emissions within the offshore environmental legislation framework, adding another layer of environmental documentation that can influence project screening and approvals, especially for new developments and material changes to existing projects.
Competitive Landscape
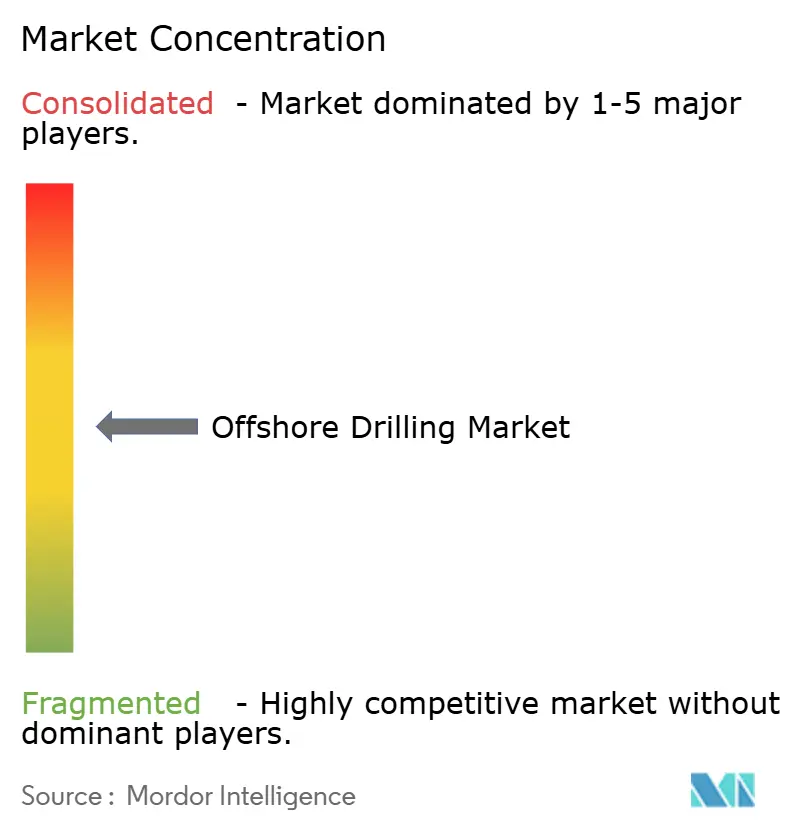
Transocean, Valaris, Noble, Seadrill, and COSL together control about 55% of marketed rigs, making the sector moderately concentrated. The Noble-Maersk merger created scale economies and triggered cold-stacking of inefficient units, while Transocean’s USD 7.8 billion backlog illustrates pricing power in tight segments. Technology adoption differentiates leaders: hybrid power, automation, and digital-twin systems secure premium contracts with supermajors seeking emissions cuts. Smaller challengers such as Shelf Drilling and Borr Drilling capture spot opportunities in Southeast Asia and the Middle East, but their short-term model heightens exposure to utilization swings. Taken together, competitive intensity pushes the offshore drilling market toward a higher-specification, lower-emission fleet profile.
Offshore Drilling Industry Leaders
Valaris plc
China Oilfield Services Ltd. (COSL)
Transocean Ltd.
Noble Corp.
Seadrill Ltd.
- *Disclaimer: Major Players sorted in no particular order
Offshore Drilling Market Companies Covered in this Report
- Transocean Ltd.
- Valaris plc
- China Oilfield Services Ltd. (COSL)
- Noble Corp.
- Seadrill Ltd.
- Shelf Drilling Ltd.
- Borr Drilling Ltd.
- ADNOC Drilling
- PetroSaudi
- KCA Deutag
- Saipem SpA
- Odfjell Drilling
- Stena Drilling
- Maersk Drilling (Noble)
- Baker Hughes Co.
- Halliburton Co.
- Schlumberger Ltd.
- Weatherford Int'l
- Petrofac Ltd.
- Exalo Drilling

Market Opportunities and Future Outlook
Activity signals are visible in Brazil and the Atlantic Margin, where Equinor began drilling the Raia gas development offshore Brazil in March 2026 using Valaris DS-17 in 2,900 m water depth. Petrobras approved the SEAP I FID in April 2026 for the Sergipe-Alagoas Basin under a build-operate-transfer model with SBM Offshore.
Technology-led differentiation is expanding opportunities for service providers that standardize automation and pressure-control workflows across deepwater campaigns. In July 2026, Halliburton and Eni completed a closed-loop rig automation and managed pressure drilling MPD application on an Eni-operated deepwater well offshore Indonesia, showing how software-enabled practices can be replicated across wells. In June 2026, Technip Energies won a contract for the Coral North FLNG project in Mozambique, broadening the set of long-cycle offshore developments that require advanced appraisal and development activities.
Recent Industry Developments in Offshore Drilling Market
- June 2026: Transocean entered an agreement with Equinor for three harsh-environment semisubmersibles on the Norwegian shelf, reinforcing capacity for high-spec operations in the North Sea. The arrangement supports complex, high-capital projects in the region.
- May 2025: ExxonMobil advanced a deepwater wells program offshore Nigeria. The development supports continued demand for advanced drilling services in West Africa.
- August 2024: BSEE implemented a final rule that added requirements for new or unusual offshore technologies (including HPHT) and revised Deepwater Operations Plan submission requirements. The change increased emphasis on technology qualification and documentation in deepwater planning, influencing timelines for operators and drilling contractors.


Offshore Drilling Market Report Scope and Research Methodology
Market Definition and Coverage
This market captures revenue generated from offshore drilling activity, where rigs and related offshore services are used to drill wells in shallow water, deepwater, and ultra-deepwater locations. The sizing follows spending tied to offshore well programs across key basins and regions.
Scope exclusions: Onshore drilling, midstream logistics, downstream refining, and general oilfield services that are not directly linked to offshore drilling execution are excluded.
Segments Covered in This Report
- By Well Type
- Conventional
- Unconventional
- By Water Depth
- Shallow Water (Below 400 ft)
- Deepwater (400 to 5,000 ft)
- Ultra-deepwater (Above 5,000 ft)
- By Service
- Exploration and Development Drilling
- Production/Workover
- Plug and Abandonment
- Subsea Support
- By Geography
- North America
- United States
- Canada
- Mexico
- Europe
- Germany
- United Kingdom
- Norway
- Russia
- Rest of Europe
- Asia-Pacific
- China
- India
- Thailand
- Vietnam
- Australia
- Rest of Asia-Pacific
- South America
- Brazil
- Trinidad and Tobago
- Rest of South America
- Middle East and Africa
- Saudi Arabia
- United Arab Emirates
- Qatar
- Egypt
- Nigeria
- Angola
- Namibia
- Rest of Middle East and Africa
- North America
Data Sources, Market Sizing, and Validation
Desk Research
Desk research was used to set the factual base for the model and to keep assumptions realistic across offshore drilling cycles. We referenced public sources such as EIA publications, IEA market balances, OPEC monthly reports, the U.S. Bureau of Safety and Environmental Enforcement statistics, and offshore licensing and field development releases from regulators, which helped us map activity direction by region.
In parallel, company filings, investor presentations, fleet status updates, and trusted press were reviewed to understand day-rate movement, utilization changes, and shifts in contract duration. Selected paid subscriptions were also used for company financials and intelligence, and for global news and financials, mainly to cross-check timelines and avoid missing major contract awards or rig reactivations. These sources are illustrative, and other public references were also used for data collection, validation, and clarification.
Primary Interviews and Surveys
Primary work was used to pressure-test the desk assumptions and fill gaps that are not consistently published, especially around effective day rates, warm stacked supply, and realistic mobilization timing. We spoke with a mix of drilling contractors, offshore service providers, and project side stakeholders, and then balanced the inputs across APAC, EMEA, and the Americas so the global totals did not get skewed by one basin.
Distribution of primary research fieldwork respondents
| Company type | Respondent position | Region |
|---|---|---|
| Top tier: 25% | CXOs: 12% | APAC: 48% |
| Mid tier: 61% | Functional/Unit leaders: 29% | EMEA: 34% |
| Smaller Players: 14% | Managers: 59% | Americas: 18% |
Market-Sizing & Forecasting
Sizing was built using a top-down approach where offshore activity and spending signals were reconstructed by region, and then translated into market value using observed utilization and pricing behavior. To keep totals grounded, results were corroborated with selective bottom-up approximations, such as sampled day rate times contracted rig days and cross-checks against supplier and channel commentary.
The model used practical inputs including active rig count and marketed supply, utilization and reactivation trends, average contract day rates by rig class, the mix shift between shallow water and deep and ultra-deepwater work, and the pace of offshore project sanctions and development drilling. When data was thin for a country or basin, gaps were handled using regional proxies that were validated in interviews, followed by adjustments so the implied utilization and day-rate outcomes stayed realistic.
For forecasting, scenario analysis was applied, anchored to expected offshore capex direction and supply tightness, and then refined with expert views on day-rate escalation and contract duration. The final forecast was checked for smooth transitions so short-cycle rebounds did not create sharp jumps that the industry cannot execute in practice.
Data Validation & Update Cycle
Outputs were validated through several checks, where the modeled market value was compared against independent signals such as offshore capex commentary, rig utilization ranges, and visible contract coverage. Variances were investigated region by region, and outliers were sent back into review so assumptions like day rates, reactivation timing, and mix shifts could be corrected before sign-off.
A multi-step internal review is followed, and if a key input changes materially, follow-up outreach is triggered to re-confirm the direction with industry participants. The report is refreshed annually, and interim updates are made when major events occur, such as sharp oil price swings, large contract waves, or meaningful rig supply changes. Before delivery, a final pass is completed so clients receive the most current view.
Mordor Intelligence's Offshore Drilling Market Size Compared With Other Published Estimates
Published market sizes for offshore drilling can look far apart, even when they appear to describe the same industry. The main reasons are usually different time windows, differences in what gets counted as drilling revenue, and different ways of handling day-rate inflation and utilization over the cycle.
Offshore drilling equipment sales and broader oilfield services are the most common add-ons that create higher totals, and in Mordor Intelligence's model those items sit outside the offshore drilling scope, which keeps the number tied to drilling activity and contracted work rather than adjacent spending. Differences also come from whether a source uses an aggressive recovery case, how it converts currencies across regions, and whether assumptions were rechecked with recent contract and fleet signals.
Benchmark comparison
| Source | Market Size | Gaps in Research Methodology |
|---|---|---|
| Mordor Intelligence | USD 32.81 B (2026) | |
| Industry Publisher A | USD 39.61 B (2024) | Uses an earlier base year and a broader activity interpretation, and its growth path appears to assume faster pricing and utilization normalization across regions, which can lift the total when compared on like-for-like years. |
| Global Consultancy B | USD 38.40 B (2023) | Starts from an older year and applies a high-growth recovery profile through the forecast window, and the public summary does not clearly spell out how day-rate escalation and reactivation supply were constrained, which can widen totals. |
Seen together, the spread is mainly explained by base-year choices and what is included around drilling versus adjacent categories, and then amplified by different pricing and utilization assumptions. Our approach keeps the chain of logic traceable to activity, fleet tightness, and contract pricing signals, which makes the estimate easier to reproduce and update when conditions change.


Key Questions Answered in the Report
What is the current value of the offshore drilling market?
The offshore drilling market size stood at USD 32.81 billion in 2026 and is on track to reach USD 41.68 billion by 2031.
Which rig type is expanding fastest?
Drillships are growing at a 6.95% CAGR thanks to ultra-deepwater commitments in Brazil, Guyana, and Namibia.
Which region leads in offshore drilling activity?
The Middle East and Africa hold the largest share at 31.09% and are forecast to grow at 5.50% through 2031.
How are hybrid power systems affecting rig economics?
Hybrid batteries cut fuel consumption by up to 25%, saving USD 3–5 million per rig each year and meeting IMO Tier III standards.
What is the main restraint facing future offshore drilling projects?
Competition from offshore wind lease blocks is diverting vessels, labor, and seabed acreage, creating a structural supply challenge for oil and gas operators.
Page last updated on:


 Your data is secure and never sold or shared.


