
Offshore AUV And ROV Market Size and Share
Market Overview
| Study Period | 2021 - 2031 |
|---|---|
| Market Size (2026) | USD 4.11 Billion |
| Market Size (2031) | USD 6.78 Billion |
| Growth Rate (2026 - 2031) | 10.54 % |
| Fastest Growing Market | Europe |
| Largest Market | Middle East and Africa |
| Market Concentration | Medium |
Major Players *Disclaimer: Major Players sorted in no particular order Image © Mordor Intelligence. Reuse requires attribution under CC BY 4.0. | |
Offshore AUV And ROV Market Analysis by Mordor Intelligence
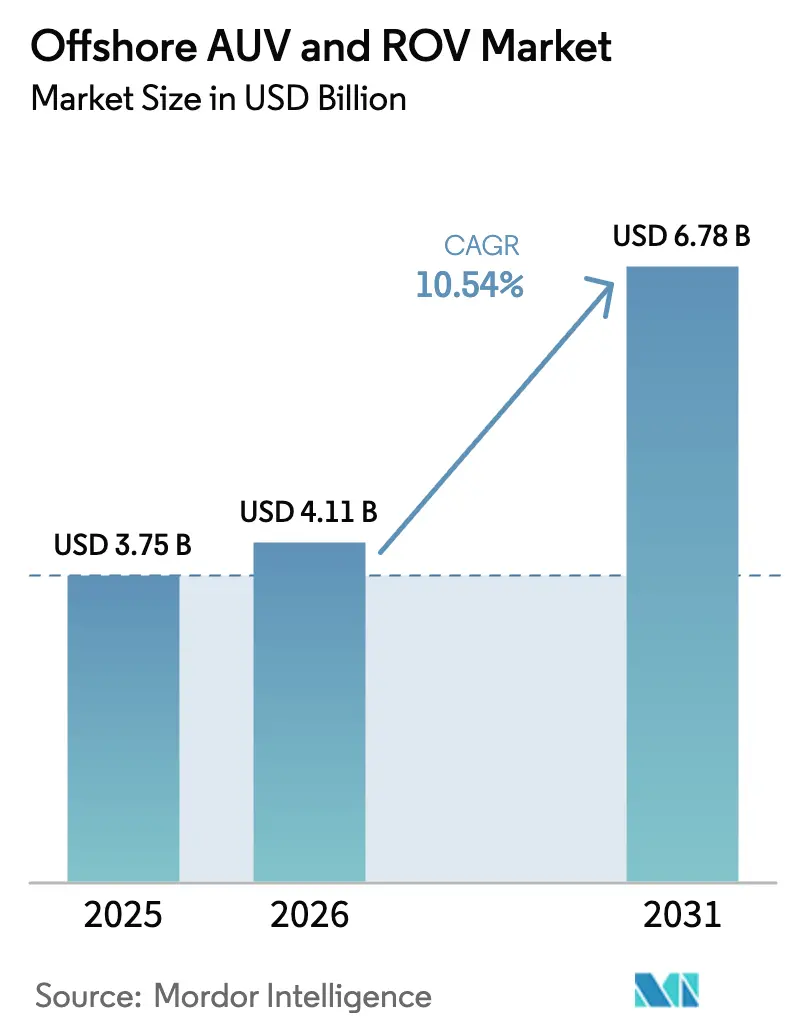
The offshore AUV and ROV market size is valued at USD 4.11 billion in 2026 and is projected to reach USD 6.78 billion by 2031, registering a 10.54% CAGR over the forecast period, underscoring the sector’s rapid monetization curve and resilient demand drivers. Oil-and-gas operators are reinvesting in deep-water assets, offshore wind developers are scaling inspection fleets, and defense ministries are fortifying seabed infrastructure, collectively shortening payback periods for subsea robotics at depths beyond diver limits. Remotely operated vehicles currently dominate deployments, yet autonomous underwater vehicles are accelerating fastest as large-area survey and predictive maintenance missions displace towed arrays. Electric propulsion continues to lead thanks to lower topside weight and minimal leakage risk, while hybrid powertrains are gaining traction where torque-intensive tooling and extended endurance converge. The convergence of hydrocarbon extraction, renewable-energy servicing, and maritime security is insulating the offshore AUV and ROV market from oil-price swings and creating multiyear visibility for equipment suppliers.
Key Report Takeaways
- By vehicle type, remotely operated vehicles held 90.8% of the offshore AUV and ROV market share in 2025, while autonomous underwater vehicles are forecast to expand at a 13.5% CAGR through 2031.
- By vehicle class, work-class platforms commanded a 74.2% share of the offshore AUV and ROV market size in 2025 and are expected to grow at a 12.1% CAGR to 2031.
- By depth rating, operations deeper than 1,000 meters captured 66.3% of offshore AUV and ROV market share in 2025, yet shallow-water missions are projected to progress at a 14.4% CAGR through 2031.
- By propulsion system, electric architectures dominated 80.5% of the offshore AUV and ROV market size in 2025, whereas hybrid designs are poised for a 15.3% CAGR to 2031.
- By activity, inspection, repair, and maintenance accounted for 31.7% of revenue in 2025 and is advancing at a 12.0% CAGR through 2031.
- By end-user, oil and gas represented 83.6% of revenue in 2025; offshore wind is on track for a 20.8% CAGR through 2031, outpacing every other segment.
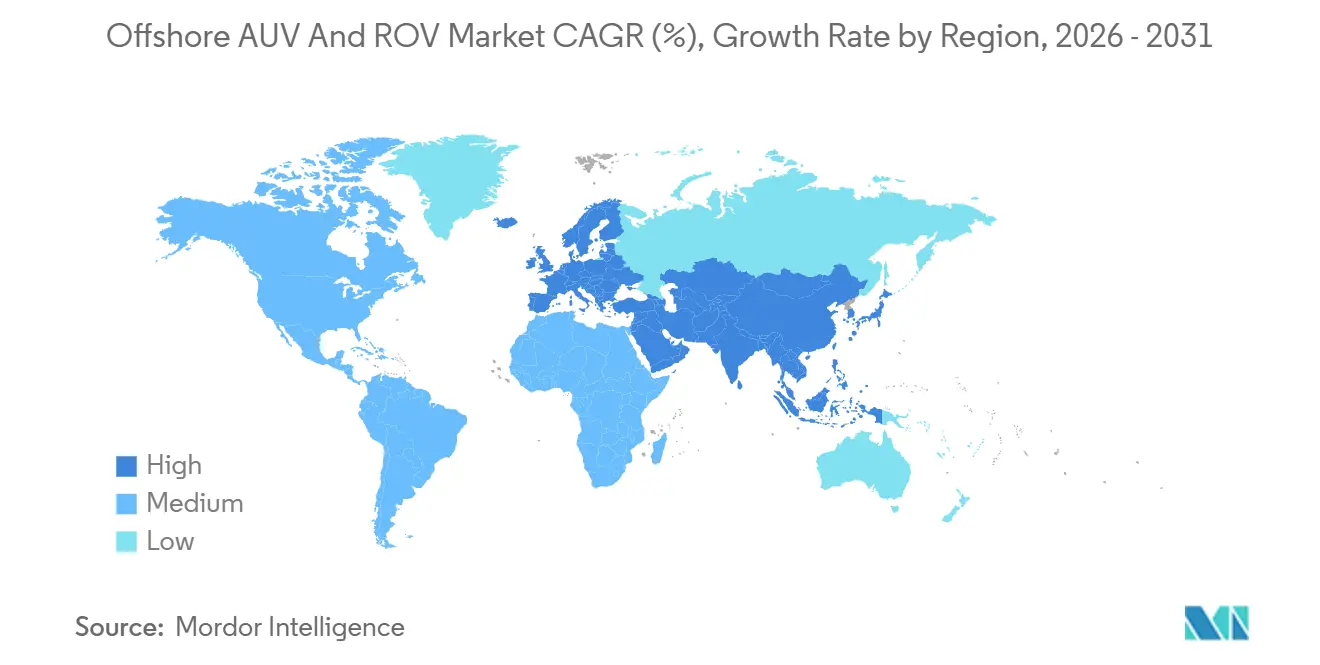
- By geography, the Middle East and Africa held a dominant 36.1% share of the offshore AUV and ROV market. Meanwhile, Europe is projected to experience robust growth, with an anticipated CAGR of 18.7% extending to 2031.
Note: Market size and forecast figures in this report are generated using Mordor Intelligence’s proprietary estimation framework, updated with the latest available data and insights as of January 2026.
Market Trends and Insights
Drivers Impact Analysis of Offshore AUV And ROV Market*
| Driver | (~) % Impact on CAGR Forecast | Geographic Relevance | Impact Timeline |
|---|---|---|---|
| Upsurge in deep-water E&P spending post-2024 oil-price recovery | 3.2% | Global, with early gains in MEA, Brazil | Medium term (2-4 years) |
| Accelerating offshore wind capacity build-outs in Europe, APAC & U.S. | 2.7% | Europe, APAC, U.S. East Coast | Long term (≥ 4 years) |
| Remote-operations cost savings >40% via ROC/USV-AUV workflows | 1.6% | North Sea, Gulf of Mexico, APAC | Short term (≤ 2 years) |
| Resident subsea robotics hubs at ≥1 km depth (Equinor, Petrobras pilots) | 1.1% | Norway, Brazil, GoM | Medium term (2-4 years) |
| AI-enabled multi-modal inspection vehicles reducing IRM downtime | 1.0% | Global, concentrated in mature O&G basins | Short term (≤ 2 years) |
| Growing defense budgets for seabed-infrastructure protection (AUKUS, NATO) | 0.6% | U.S., UK, Australia, NATO member states | Short term (≤ 2 years) |
| Source: Mordor Intelligence | |||
Upsurge In Deep-Water E&P Spending Post-2024 Oil-Price Recovery
Brent crude stabilized above USD 80 per barrel through 2025, reinstating final investment decisions on ultra-deep projects that had stalled during the pandemic downturn. Petrobras allocated USD 102 billion for 2024-2028 capital spending, with 80% directed to pre-salt fields exceeding 2,000 meters, each requiring heavy-duty work-class ROVs for riser installation and tree intervention. Chevron raised upstream capex by 10% for 2026, prioritizing Gulf of Mexico tie-backs and West African prospects that demand resident inspection drones to minimize rig time. Global offshore capital expenditure is projected to climb to USD 180 billion by 2027, a 22% rise over 2023, with deep-water projects accounting for 60% of incremental spending.[1] Extended field life for aging North Sea platforms, owing to delayed decommissioning, is sustaining demand for inspection ROVs capable of evaluating fatigue and plugging suspended wells.
Accelerating Offshore Wind Capacity Build-Outs In Europe, APAC & U.S.
The Global Wind Energy Council recorded 35 GW of new offshore wind commissioned in 2024, with Europe and China delivering 28 GW.[2] The International Energy Agency projects annual additions above 40 GW by 2027 as fixed-bottom and floating arrays reach commercial operation. The United Kingdom’s Dogger Bank, at 3.6 GW, requires year-round cable-burial verification via electric-propulsion AUVs outfitted with multibeam sonar and sub-bottom profilers. Denmark’s Energy Island initiative aims for 10 GW by 2030, mandating real-time inspections of inter-array cables to preserve grid reliability under Energinet standards. Japan designated 11 promotion zones in 2025, prompting Mitsubishi Heavy Industries to trial ROVs for floating-platform mooring checks in typhoon-exposed waters. Taiwan’s 5.6 GW target by 2026 has driven Ørsted and JERA to contract dedicated subsea fleets for scour monitoring in high-current environments.
Remote-Operations Cost Savings above 40% Via ROC/USV-AUV Workflows
Equinor’s Hydrone-R deployment at the Njord field in 2024 cut intervention vessel days by 35% through shore-based piloting.[3] Saipem’s Hydrone-W, stationed at 1,200 meters on TotalEnergies’ Ikike field, eliminated a dedicated support vessel, trimming mobilization costs by 40%. ISO 19901-10 formalized guidance for unmanned offshore installations in 2025, while IMCA published best practices for pairing USVs with tethered or autonomous subsea assets. Satellite connectivity, such as Inmarsat Fleet Xpress, enables real-time video streaming to onshore control rooms, allowing 24/7 operations without crew-change cycles. Harsh-weather basins like the Barents Sea particularly benefit as limited weather windows restrict conventional vessel use.
AI-Enabled Multi-Modal Inspection Vehicles Reducing IRM Downtime
Nauticus Robotics introduced the Aquanaut 2 in 2025, embedding computer-vision models trained on 500,000 subsea images that detect corrosion and marine growth with 95% accuracy, cutting data-processing time from weeks to hours. TechnipFMC’s iEPCI digital twin predicts valve-actuator failures via acoustic-signature analysis, enabling scheduled maintenance that preempts unplanned shutdowns. API’s Recommended Practice 2MIM endorses AI-assisted inspection, and ISO 16708 amendments are underway to incorporate autonomous defect classification. Fugro’s cloud analytics reduced inspection cycles for Shell’s Prelude FLNG by 28% in 2025, confirming the commercial case for predictive workflows. Operators are bundling digital twins with long-term service agreements, effectively locking in recurring revenue for analytics vendors.
Restraints Impact Analysis of Offshore AUV And ROV Market*
| Restraint | (~) % Impact on CAGR Forecast | Geographic Relevance | Impact Timeline |
|---|---|---|---|
| Shallow-water O&G licence bans in California, New Zealand, parts of EU | -1.7% | California, New Zealand, North Sea, select EU | Medium term (2-4 years) |
| Tight global supply of deep-rated Li-ion batteries (sub-sea qualified) | -1.4% | Global, acute in APAC and EU | Short term (≤ 2 years) |
| Tariff-driven surge in specialty-alloy & servo-motor import costs (US-2025) | -0.9% | U.S., with spill-over to North America supply | Short term (≤ 2 years) |
| Acoustic spectrum crowding hindering reliable subsea comms in brownfields | -0.6% | Mature O&G basins (North Sea, Gulf of Mexico) | Short term (≤ 2 years) |
| Source: Mordor Intelligence | |||
Shallow-Water O&G Licence Bans In California, New Zealand, Parts Of EU
California extended its offshore drilling moratorium to 2030 via Executive Order N-82-20, freezing new leases within state waters and curtailing shallow-water ROV demand in the Santa Barbara Channel.[4] New Zealand’s Crown Minerals Act amendment imposed a permanent ban on new offshore exploration in 2024, re-directing subsea robotics toward decommissioning of legacy Taranaki basin assets. Denmark halted new North Sea licensing rounds in 2024 under its Climate Agreement, accelerating platform removal timelines. Although exploration declines, regulatory directives such as EU Directive 2013/30/EU obligate well plugging and structure removal, sustaining ROV utilization for abandonment campaigns.
Tight Global Supply Of Deep-Rated Li-Ion Batteries (Subsea Qualified)
Pressure-compensated lithium-ion modules remain capacity-constrained as automotive and grid storage absorb worldwide cell production. Blue Logic’s subsea battery, integral to resident drones, relies on specialized electrolyte chemistries manufactured by a limited supplier base, including Saft and EnerSys, stretching lead times to 18 months in 2025. The U.S. Department of Energy classified battery-grade lithium and cobalt as supply-chain vulnerabilities, citing 70% of cell output concentrated in East Asia. Delivery delays have forced North Sea offshore wind operators to specify hybrid propulsion that combines smaller battery packs with hydraulic systems, slightly raising vessel dependence. IEC 62619 lacks subsea-specific testing protocols, compelling OEMs to shoulder proprietary qualification costs that inhibit economies of scale.
*Our forecasts treat driver/restraint impacts as directional, not additive. The impact forecasts reflect baseline growth, mix effects, and variable interactions.
Offshore AUV And ROV Market Segment Analysis
By Vehicle Type:
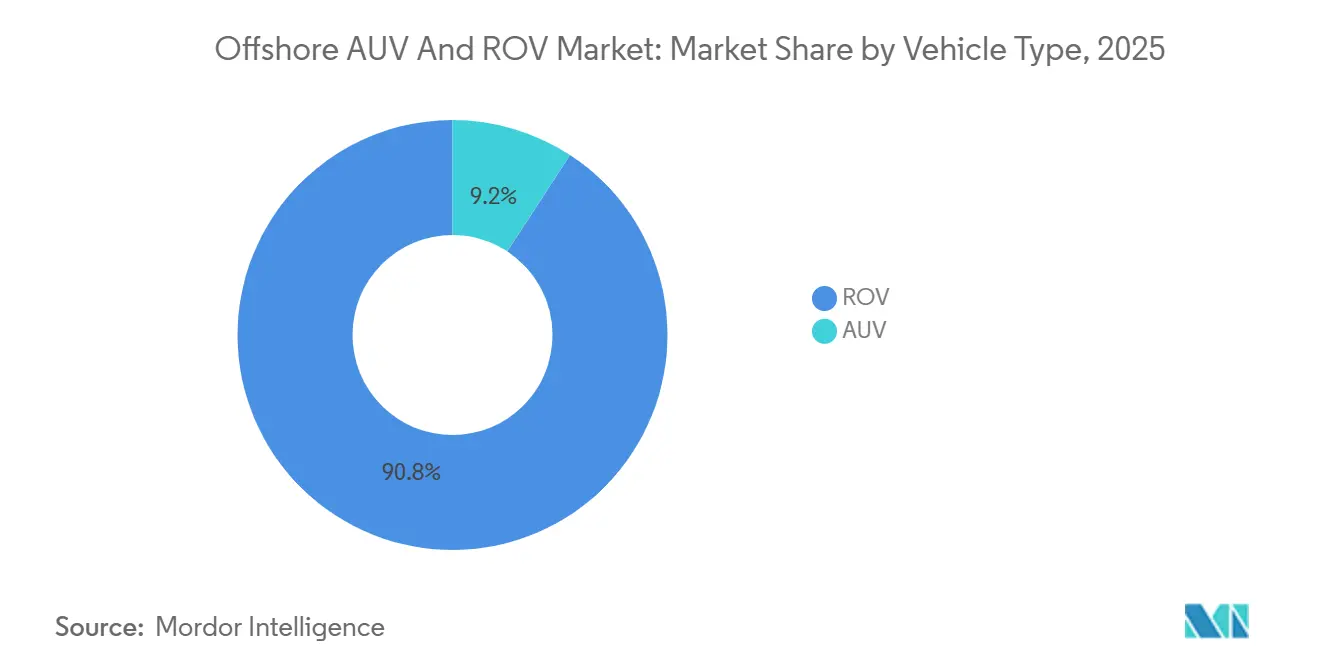
ROVs Maintain Dominance While AUVs AccelerateROVs captured 90.8% of the offshore AUV and ROV market share in 2025, a testament to their indispensability for real-time manipulation tasks such as valve actuation and hot-stab operations. The offshore AUV and ROV market size for autonomous platforms, however, is projected to expand at a 13.5% CAGR as operators deploy AUVs for wide-area pipeline surveys and environmental monitoring. Petrobras deployed 12 AUVs in 2025 to map pre-salt prospects, lowering survey costs by 50% compared to towed arrays. Regulatory clarity is emerging: pending IMO SOLAS amendments would classify autonomous subsea vehicles as unmanned systems, potentially easing insurance hurdles and accelerating uptake.
The offshore AUV and ROV industry is witnessing a bifurcation: tethered work-class ROVs evolve into mobile manipulators with force-feedback control, while autonomous vehicles serve as sensor-fusion hubs integrating synthetic-aperture sonar and magnetometers. Hybrid models like Saab’s Sabertooth can toggle between tethered and untethered modes; the U.S. Navy ordered USD 25 million worth of such units for mine neutralization in 2025. Defense specifications are expected to cascade into commercial standards, reinforcing demand for dual-mode versatility.

By Vehicle Class:
Work-Class Systems Anchor Intervention SpectrumWork-class ROVs held 74.2% of the offshore AUV and ROV market size in 2025 and will retain leadership with a projected 12.1% CAGR to 2031. Light work-class units dominate cable inspections and valve manipulations in shallow-water wind farms, while heavy work-class vehicles manage riser connections at 4,000-meter depths in Brazil and West Africa. Electric work-class variants such as Soil Machine Dynamics’ eWROV reduce deck weight by 40%, enabling deployment from smaller DP-1 vessels and lowering daily charter rates.
Observatory-class vehicles trail as operators favor multi-role work-class platforms that can shift between laser metrology and cutting tasks without re-mobilization. Fugro’s Blue Essence exemplifies modular work-class architecture capable of carrying a grinder or laser scanner interchangeably, trimming campaign costs. Environmental discharge regulations under OSPAR are accelerating the transition to electric actuation, further reinforcing work-class demand.
By Depth Rating:
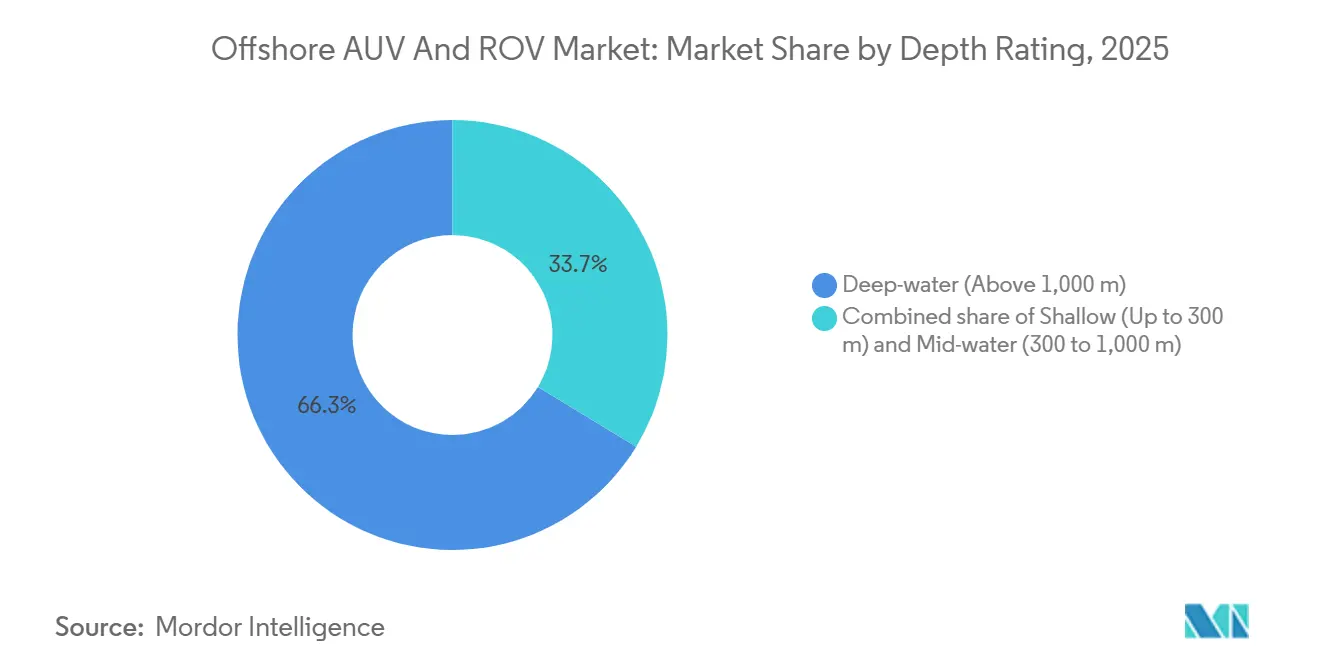
Deep-Water Primacy Meets Shallow-Water SurgeDeep-water missions above 1,000 meters accounted for 66.3% of revenue in 2025, driven by ultra-deep hydrocarbon projects that rely on pressure-compensated electronics and advanced navigation. Shallow-water activity, however, is forecast to grow at a 14.4% CAGR as nearshore wind farms proliferate across the North Sea, Baltic, and East China Sea. Reach Subsea’s containerized Surveyor Interceptor enables rapid mobilization from crew-transfer vessels, aligning with developers’ desire for small-footprint assets.
Mid-water applications address continental shelf wind farms and mid-life oil platforms, requiring vehicles that combine high-definition video with moderate tooling. Deep-water systems are now integrating Sonardyne SPRINT-Nav inertial units delivering sub-meter accuracy without LBL arrays, enhancing efficiency where seafloor morphology obstructs transponders. Maintenance intervals are being depth-standardized under IOGP Guideline 373, requiring tighter service cycles for biofouling-prone shallow-water platforms.
By Propulsion System:
Electric Supremacy, Hybrid MomentumElectric propulsion commanded 80.5% of the offshore AUV and ROV market share in 2025 due to reduced topside weight and elimination of hydraulic fluid discharge. Hybrid propulsion, merging electric thrusters with on-demand hydraulic pumps, is slated for a 15.3% CAGR through 2031. Kongsberg’s Hugin AUV achieved a 72-hour mission in 2025 on pure electric power, underscoring endurance improvements.
TechnipFMC’s Schilling Robotics fleet demonstrates hybrid energy savings of 30%, using electric mode for transit and hydraulic surge only during torque operations. The U.S. Navy’s 2025 Unmanned Undersea Vehicle Master Plan specifies hybrid propulsion to balance stealth and manipulation capability. EU Marine Strategy Framework pressures operators to minimize underwater noise, favoring electric drives within marine-protected zones.
By Activity:
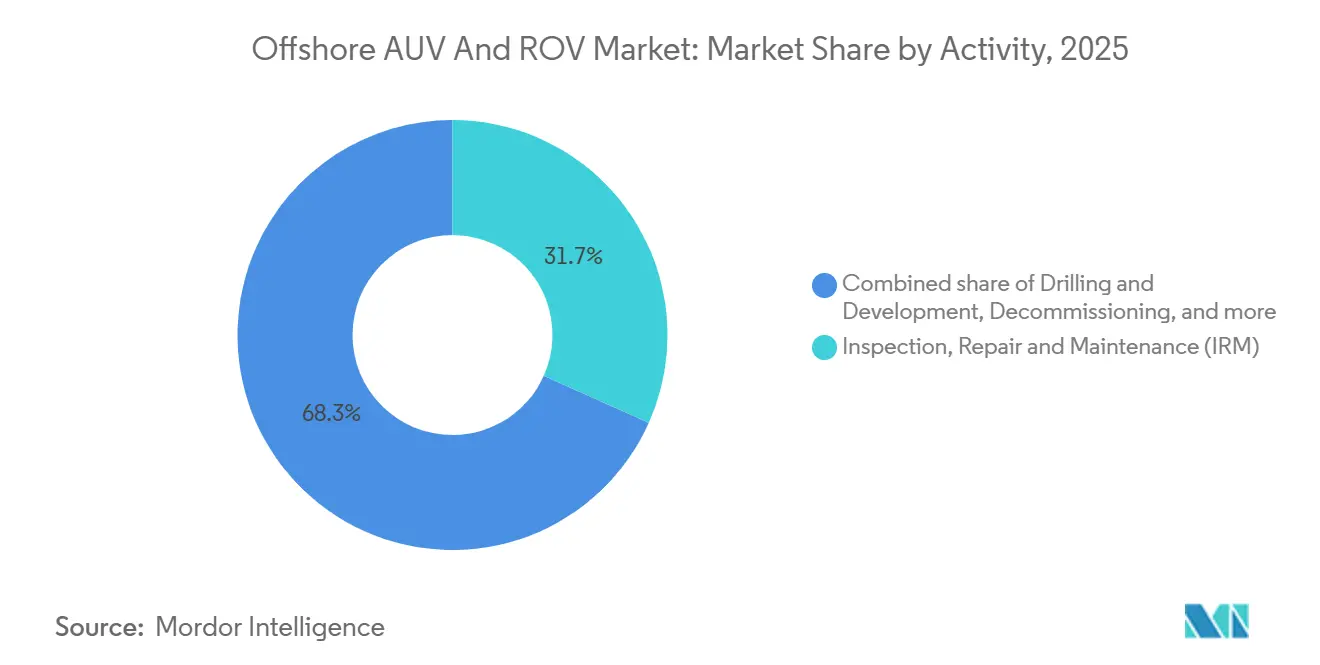
IRM’s Dual Leadership In Share And GrowthInspection, repair, and maintenance generated 31.7% of revenue in 2025 and is expected to continue leading with a 12.0% CAGR as more than 10,000 kilometers of pipelines installed before 2010 require integrity verification. Drilling and development remain strong, backed by FIDs in Brazil, Guyana, and Mozambique. Subsea 7’s USD 2.8 billion SURF backlog illustrates construction demand.
Decommissioning is gathering momentum in the North Sea as 2,000 wells must be plugged and abandoned by 2030 under UK-OGA estimates. Environmental monitoring, though the smallest, is expanding under EU spatial planning directives mandating real-time sediment monitoring during cable burial; ICES issued 2025 guidelines for AUV-based impact surveys. Operators increasingly bundle IRM with environmental monitoring to amortize mobilization costs.
By End-User Application:
Hydrocarbon Anchor, Offshore Wind UpswingOil and gas accounted for 83.6% of revenue in 2025, driven by new production in Suriname, Namibia, and pre-salt Brazil. Offshore wind is poised to grow at a 20.8% CAGR, catalyzed by multi-gigawatt build-outs in Europe, China, and the United States. Defense applications are strengthening as AUKUS nations invest in seabed infrastructure protection and mine countermeasures, employing AI-enabled AUVs to patrol fiber-optic cables and gas pipelines.
Research institutions such as WHOI deploy AUVs for climate studies, while aquaculture operators in Norway leverage ROVs for net-pen inspections to limit fish mortality. Ørsted and Equinor have locked in multiyear ROV capacity via framework agreements, tightening supply and elevating day rates for inspection-class vehicles.
Geography Analysis
MEA Offshore AUV and ROV Market
Middle East and Africa led with 36.1% of revenue in 2025 as Saudi Aramco’s Marjan expansion and Qatar Energy’s North Field East project required more than 80 work-class ROVs for subsea-tree installation and flowline monitoring. ADNOC’s USD 1.65 billion EPC contract awarded to Subsea 7 in 2025 underscores the region’s commitment to resident inspection drones for 200 kilometers of infrastructure. Nigeria’s Bonga Southwest field and South Africa’s Brulpadda prospect add further pull for deep-water ROVs, while Egypt’s Zohr gas continues to generate multiyear IRM demand. Political risk and energy-transition policies temper long-term upside, but near-term hydrocarbon spend remains strong.
Europe Offshore AUV and ROV Market
Europe is forecast to post the fastest CAGR at 18.7% through 2031, driven by offshore wind expansion and North Sea decommissioning mandates. Dogger Bank’s final phase necessitates continuous cable integrity checks via scanning AUVs. Norway’s Hydrone-R resident drone reduces vessel days by 40 per year in harsh conditions. Denmark’s Kriegers Flak and Germany’s 7 GW Baltic auctions intensify demand for shallow-rated vehicles, while France’s floating-wind pilots require AUV-mediated mooring surveillance. OSPAR Commission rules stipulate structure removal within three years of production cessation, pushing rapid ROV mobilization for dismantling.
The Americas and APAC Offshore AUV and ROV Market
Asia-Pacific, South America, and North America share the remainder of the offshore AUV and ROV market. China installed 6.3 GW of offshore wind in 2025, deploying ROVs for dynamic cable burial in high-current zones. Japan’s floating-wind pilots off Goto rely on AUVs for typhoon-resilient mooring inspection. Brazil produced 2.9 million barrels per day from pre-salt assets, necessitating deep-water ROV support at depths beyond 2,000 meters. The U.S. Gulf of Mexico sustains ROV demand for mature assets, and the East Coast wind pipeline is triggering new inspection requirements. Canada initiated exploratory leasing in Atlantic provinces in 2025, laying the groundwork for future ROV deployments.
Regulatory Landscape
The offshore AUV and ROV market operates under a mix of offshore safety, marine environmental, and classification frameworks that increasingly reference unmanned and autonomous operations. In 2025, ABS maintained and updated its Rules for Building and Classing Underwater Vehicles, Systems and Hyperbaric Facilities (including AUV-focused provisions), and ISO 19901-10 formalized guidance relevant to unmanned offshore installations and remote operations workflows used with USVs, AUVs, and resident subsea systems.
Standardization is moving toward tighter requirements on data quality and environmental impact. ISO 25451:2026 (published May 2026) set technical requirements and guidelines for seafloor mapping using uncrewed marine vehicles, supporting broader adoption of AUV-based survey and inspection programs across oil and gas, offshore wind, and seabed infrastructure monitoring. At the same time, the IMO revised guidelines for the reduction of underwater radiated noise (MEPC.1/Circ.906) continue to influence propulsion and mission-planning choices, reinforcing the shift toward electric architectures and quieter operating profiles in sensitive marine areas.
Competitive Landscape
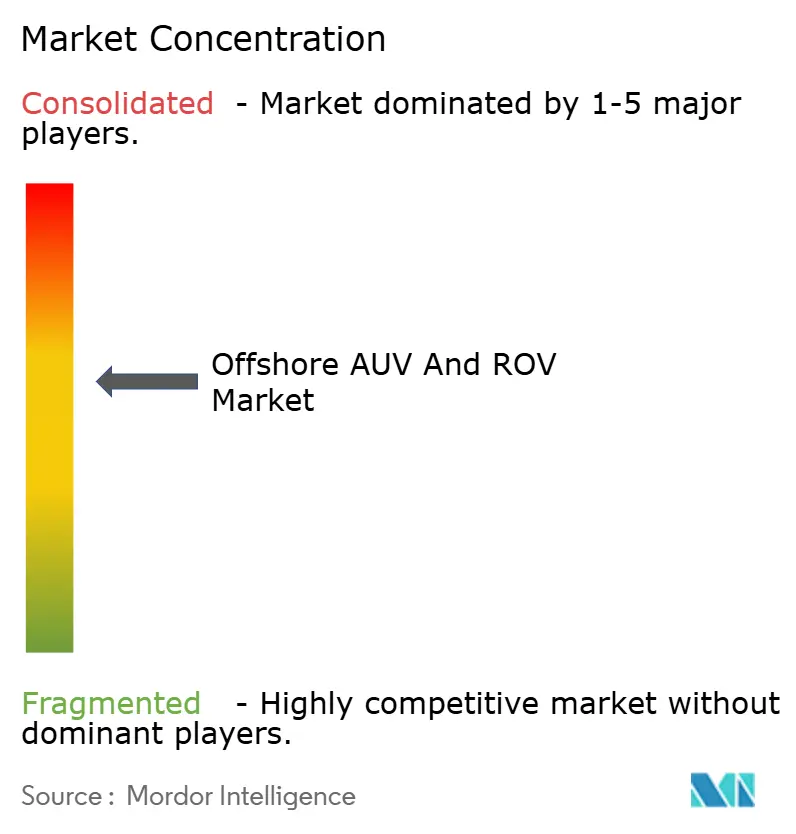
The top five companies, Oceaneering International, TechnipFMC, Fugro, Subsea 7, and Saipem, command 55% of global revenue, reflecting moderate concentration. Integrated service models allow incumbents to bundle subsea construction, inspection, and decommissioning, capturing framework agreements that provide multiyear backlog visibility. TechnipFMC’s outcome-based contracts tie remuneration to uptime, aligning incentives with operators’ production goals.
Nauticus Robotics and Ocean Infinity exemplify disruptive entrants leveraging AI-enabled autonomy to reduce offshore personnel; Ocean Infinity’s USD 150 million Series C in 2024 highlights venture appetite. Strategic partnerships, such as Equinor and Saipem’s Hydrone-R co-development, share technology risk and accelerate commercialization. Kongsberg’s 2025 acquisition of Reach Subsea’s ROV division for USD 85 million consolidates Norway’s supply chain and broadens Kongsberg’s autonomous-system offering.
Regulatory compliance under IMCA R-014 (personnel competence) and R-004 (maintenance) remains a gatekeeper for contract awards, limiting new entrants without certification infrastructure. Technology differentiation centers on electric propulsion, AI-driven anomaly detection, and satellite connectivity for remote operations. Players reliant on hydraulic legacy systems face margin compression as environmental regulations penalize fluid leaks.
Offshore AUV And ROV Industry Leaders
-
Oceaneering International, Inc.
-
Fugro N.V
-
Subsea 7 SA
-
TechnipFMC PLC
-
DOF Subsea
- *Disclaimer: Major Players sorted in no particular order
Offshore AUV And ROV Market Companies Covered in this Report
- Oceaneering International Inc.
- Subsea 7 SA
- Fugro NV
- TechnipFMC plc
- DOF Subsea AS
- DeepOcean AS
- Saipem SpA
- Helix Energy Solutions Group Inc.
- Kongsberg Maritime
- Saab AB (Ocean-eye)
- Teledyne Technologies Inc.
- Forum Energy Technologies
- Soil Machine Dynamics (SMD)
- Nauticus Robotics Inc.
- Ocean Infinity
- Reach Subsea
- IKM Subsea
- Modus Subsea Services
- Bluefin Robotics
- SeaRobotics Corp.
Market Opportunities and Future Outlook
A persistent gap remains in vessel-light subsea inspection, maintenance, and repair, where resident drones, hybrid AUV-ROV concepts, and USV-supported operations reduce exposure to offshore weather windows and vessel availability constraints. In early 2026, Saipem reported milestone progress on resident and autonomous systems, including functional acceptance tests for its FlatFish autonomous drone with Petrobras toward ultra-deepwater implementation, and a subsea residency record for Hydrone-R in the Norwegian Sea. These programs point to a broader procurement shift from campaign-based ROV deployments toward docking-enabled subsea robotics, standardized subsea interfaces, and long-term service models that bundle robotics, analytics, and intervention planning.
Opportunity is also concentrated in deepwater and brownfield life-extension, where multi-year tiebacks and integrity programs reward higher autonomy, improved navigation, and faster defect classification. Offshore wind cable and foundation integrity work is expanding the addressable market for electric AUV survey payloads and compact work-class ROV tooling, particularly in Europe and Asia-Pacific. Productization of combined USV-ROV stacks is moving from concept to deployment, highlighted by OceanAlpha launching the V180 USV-ROV system in March 2026 for unmanned IMR missions down to 3,000 meters, supporting service providers building repeatable, remote-operated workflows across multiple basins.
Recent Industry Developments in Offshore AUV And ROV Market
- July 2026: Oceaneering International secured a four-year contract with Petrobras to deliver ROV services offshore Brazil using two work-class ROVs deployed from the AKOFS Offshore vessel Aker Wayfarer. The award supports longer-duration fleet planning and reflects sustained demand for work-class intervention capability in Brazil deepwater programs, even as operators emphasize efficiency and remote-enabled execution.
- April 2026: Subsea 7, through the Subsea Integration Alliance, signed a strategic collaboration agreement with PETRONAS Suriname E&P to provide subsea production systems and SURF solutions for Suriname resources. Integrated subsea development models typically expand the installed base that later requires inspection and intervention, supporting multi-year utilization for ROV and AUV-capable contractors across field life.
- October 2025: Helsing, a German defense technology firm, moved forward with acquiring Blue Ocean, an Australian company focused on autonomous underwater vehicles. The transaction links defense autonomy investment with subsea robotics know-how and adds momentum to AUV capabilities that also support commercial seabed-infrastructure protection and offshore inspection workflows.
Offshore AUV And ROV Market Report Scope and Research Methodology
Market Definition and Coverage
For this study, the offshore AUV and ROV market is defined as the value of vehicles, systems, and related offshore services used to survey, inspect, and intervene on subsea assets for energy and marine infrastructure in offshore waters.
Scope exclusions: Purely inland or freshwater deployments, and non-operational lab prototypes not used in offshore field activity, are excluded from the market totals.
Segments Covered in This Report
- By Vehicle Type
- ROV
- AUV
- By Vehicle Class
- Work-class
- Light Work-class
- Medium Work-class
- Heavy Work-class
- Observatory-class
- Work-class
- By Depth Rating
- Shallow (Up to 300 m)
- Mid-water (300 to 1,000 m)
- Deep-water (Above 1,000 m)
- By Propulsion System
- Electric
- Hydraulic
- Hybrid
- By Activity
- Drilling and Development
- Construction and Installation
- Inspection, Repair and Maintenance (IRM)
- Decommissioning
- Environmental Monitoring
- By End-user Application
- Oil and Gas
- Offshore Wind
- Defense and Security
- Research and Academia
- Aquaculture and Marine Infrastructure
- By Geography
- North America
- United States
- Canada
- Mexico
- Europe
- United Kingdom
- Norway
- Denmark
- Germany
- France
- Russia
- Rest of Europe
- Asia-Pacific
- China
- India
- Japan
- South Korea
- ASEAN Countries
- Rest of Asia-Pacific
- South America
- Brazil
- Argentina
- Colombia
- Rest of South America
- Middle East and Africa
- Saudi Arabia
- United Arab Emirates
- Qatar
- South Africa
- Egypt
- Nigeria
- Rest of Middle East and Africa
- North America
Data Sources, Market Sizing, and Validation
Desk Research
Desk research was used to set the fact base for offshore activity levels and to anchor the model variables to measurable signals. We referenced public sources such as offshore energy regulator releases, maritime and safety agency publications, and national statistics offices for energy production and investment indicators. For offshore wind and broader marine activity cues, we also reviewed publications from international energy agencies and industry bodies that track installations, vessel activity, and project pipelines.
To translate activity into market value, we also reviewed public company filings, investor presentations, and reputable press coverage for product mix clues, contract timelines, and fleet utilization commentary. In a few places, paid subscriptions already available to us were used only to speed up company financial screening, patent lookups, and tender tracking where public detail was thin. The desk sources named here are illustrative rather than exhaustive, and many additional public documents and datasets were consulted for data collection, validation, and clarification.
Primary Interviews and Surveys
Primary work focused on cross-checking what operators are actually deploying offshore, how utilization is changing across oil and gas and offshore wind, and what pricing and service bundling look like in live contracts. We spoke with a mix of operators, offshore service providers, integrators, and equipment-focused teams, and we kept coverage balanced across major offshore basins so regional intensity and seasonality were not missed.
Distribution of primary research fieldwork respondents
| Company type | Respondent position | Region |
|---|---|---|
| Top tier: 36% | CXOs: 12% | APAC: 43% |
| Mid tier: 47% | Functional/Unit leaders: 31% | EMEA: 31% |
| Smaller Players: 17% | Managers: 57% | Americas: 26% |
Market-Sizing & Forecasting
Market sizing was built using a mix of top-down and bottom-up checks, where offshore activity was first reconstructed from demand drivers and then validated using selective rollups. On the top-down side, we mapped subsea work intensity using indicators tied to offshore development and operations, which were then converted into equipment and service demand using penetration and utilization assumptions.
A few practical inputs that shape the model include offshore project count and timing, subsea field life-cycle activity (inspection, repair, and maintenance versus construction or decommissioning), day-rate and service-rate ranges for ROV spreads, AUV mission frequency for survey scope, and typical depth and water conditions that influence vehicle class choice. Because data is not always reported consistently, gaps were handled by using proxy ratios from similar basins, followed by expert checks on whether those ratios fit local operating constraints.
For forecasting, scenario analysis was used so changes in offshore capex cycles, offshore wind build-out pace, and vessel availability could be reflected without overfitting. Assumptions for utilization and pricing were then refined through primary feedback, and the final outlook was kept consistent with observable project pipelines and near-term contract activity.
Data Validation & Update Cycle
Outputs were validated through triangulation across independent signals, including offshore project pipelines, reported offshore production and development trends, and observed shifts in inspection and intervention demand. When a modeled region or application moved outside expected ranges, the underlying utilization, pricing, or conversion assumptions were reviewed and reworked before sign-off.
A multi-step internal review was followed, and re-contacts were triggered when interview feedback suggested a step-change in rates, fleet availability, or activity mix. The report is refreshed annually, with interim updates when material events occur, and a final pre-delivery check is completed so the published view reflects the latest available market signals.
Mordor Intelligence's Offshore Auv Rov Market Size Compared With Other Published Estimates
Published market numbers for offshore AUV and ROV can vary a lot, even when the topic looks identical on the surface. The spread typically comes from how each study draws the line between equipment sales and offshore service revenue, which years are treated as the base, and how strongly short-cycle offshore activity swings are captured.
Key gap drivers in this market usually show up in how intervention-heavy work is counted versus pure survey work, whether defense and scientific missions are mixed into offshore commercial demand, and how day-rate changes are carried forward when vessel and crew constraints tighten. By tracking ROV spread utilization and offshore service-rate movements across key basins, Mordor Intelligence ties the 2026 value to commercial offshore inspection, survey, and intervention demand rather than including adjacent non-offshore missions.
Benchmark comparison
| Source | Market Size | Gaps in Research Methodology |
|---|---|---|
| Mordor Intelligence | USD 4.11 B (2026) | |
| Global Consultancy A | USD 2.71 B (2024) | Uses an earlier base year and a broader application mix, which can dilute offshore commercial intensity and understate the recent lift from wind and deepwater inspection demand. |
| Industry Publisher B | USD 5.86 B (2025) | Appears to apply a wider revenue capture that can blend offshore services with adjacent underwater robotics demand, and its longer-horizon framing can amplify aggressive rate and volume progression. |
The table shows that timing and scope choices explain most of the difference across estimates. When activity intensity, service-rate logic, and inclusion rules are stated clearly and then checked against offshore project signals, the resulting market size stays easier to reproduce and to update as contracts and utilization shift.
Key Questions Answered in the Report
What is the projected value for the offshore AUV and ROV market in 2031?
The market is expected to reach USD 6.78 billion by 2031.
Which vehicle type is growing fastest?
Autonomous underwater vehicles are forecast to expand at a 13.5% CAGR through 2031.
Why are hybrid propulsion systems gaining traction?
Hybrids blend electric efficiency with hydraulic torque, enabling longer missions while supporting high-power tooling.
Which region will post the highest growth?
Europe is projected to grow at an 18.7% CAGR, led by offshore wind build-outs and decommissioning mandates.
How are resident drones reducing costs?
Stationing ROVs and AUVs subsea eliminates dedicated support vessels, trimming intervention expenses by up to 40%.