Second Hand Furniture Market Size and Share
Market Overview
| Study Period | 2021 - 2031 |
|---|---|
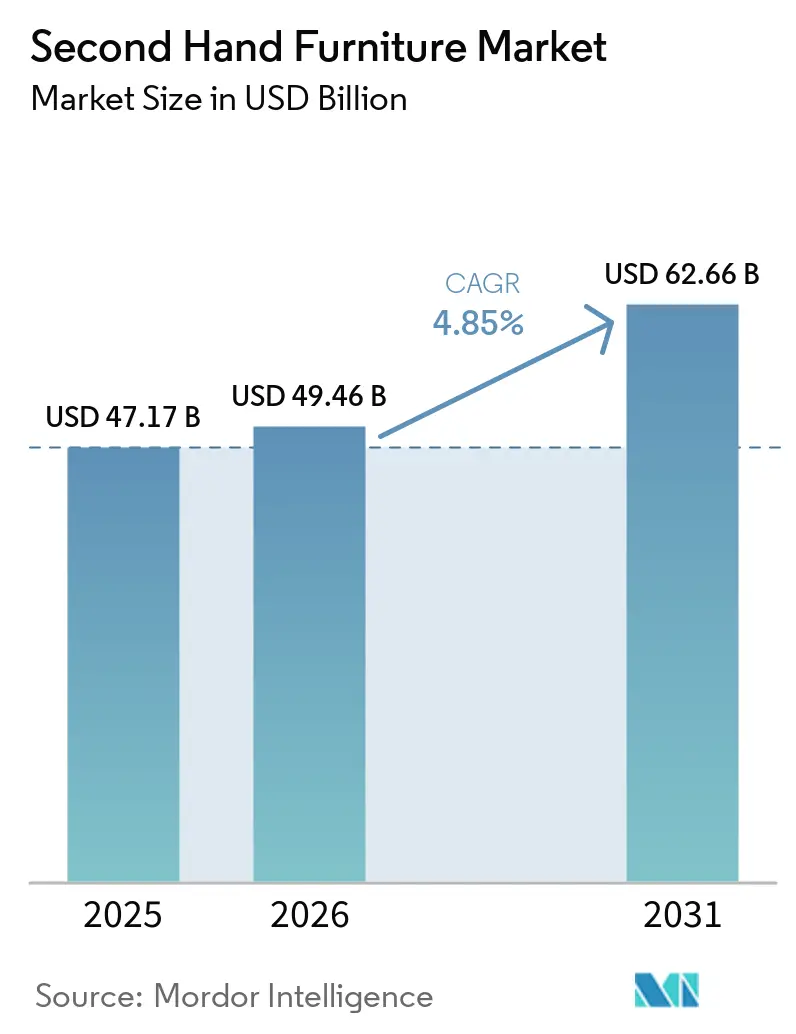
| Market Size (2026) | USD 49.46 Billion |
| Market Size (2031) | USD 62.66 Billion |
| Growth Rate (2026 - 2031) | 4.85% CAGR |
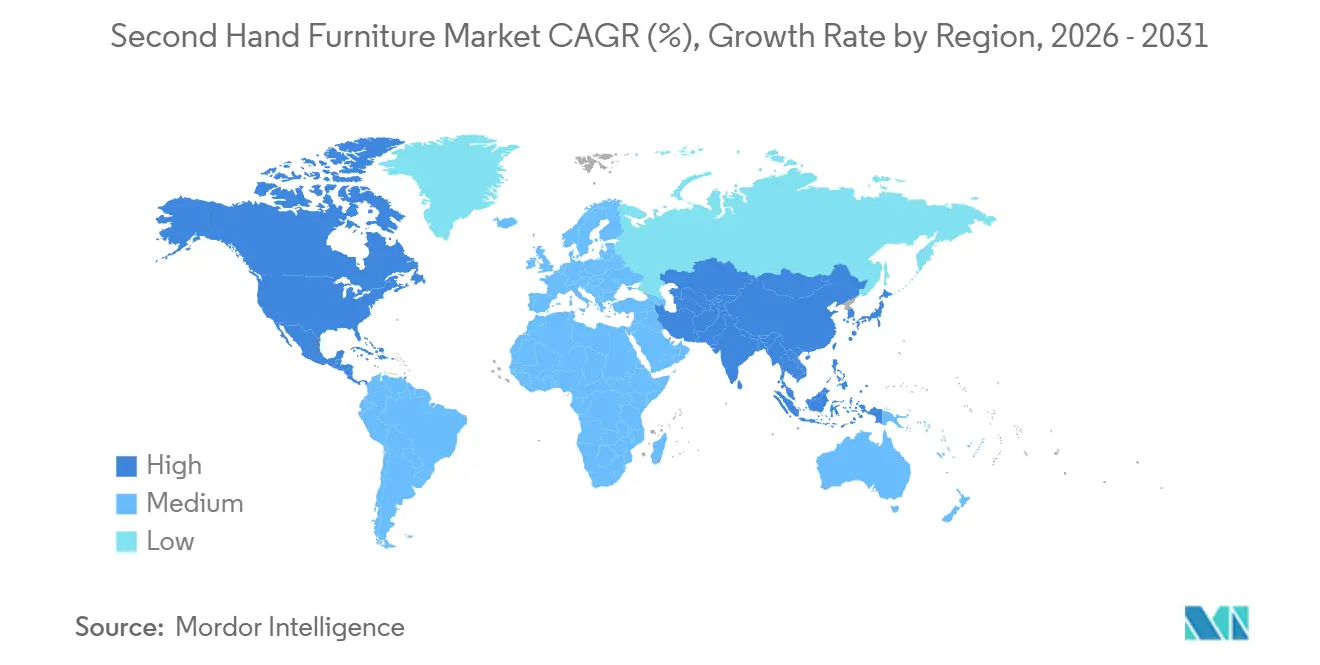
| Fastest Growing Market | Asia-Pacific |
| Largest Market | North America |
| Market Concentration | Low |
Major Players *Disclaimer: Major Players sorted in no particular order Image © Mordor Intelligence. Reuse requires attribution under CC BY 4.0. | |
Second Hand Furniture Market Analysis by Mordor Intelligence
The second hand furniture market size was valued at USD 47.17 billion in 2025 and estimated to grow from USD 49.46 billion in 2026 to reach USD 62.66 billion by 2031, at a CAGR of 4.85% during the forecast period 2026–2031. Growth strengthens as circular policy mandates expand, commercial decommissioning scales, and retailer buyback programs capture post-sale value that previously existed through informal channels. Online marketplaces are emerging as a central node for the discovery of bulky items, stitching together listings, payments, and white-glove delivery to reduce friction compared to peer-to-peer arrangements. Digital product passports, which are being rolled out across the European Union in 2026-2028, enable provenance verification to support price discovery and premium resale for documented items. Asia-Pacific is the fastest-growing region in the second hand furniture market, driven by large classifieds platforms and high-velocity urban relocations. At the same time, North America has a significant base anchored by established marketplace infrastructure and steady surplus from office rightsizing.
Key Report Takeaways
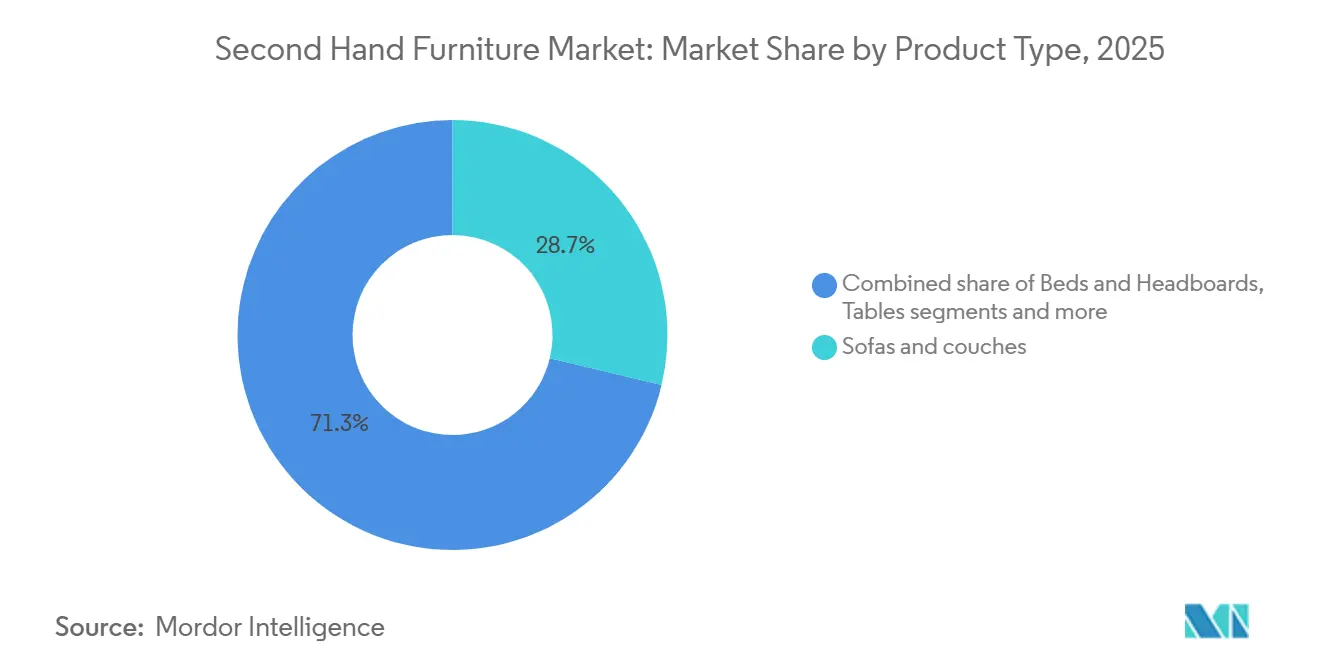
- By product type, sofas and couches led with 28.74% of second hand furniture market revenue share in 2025. Office furniture is projected to expand at a 5.08% CAGR to 2031.
- By material, wood retained the largest share at 44.18% in 2025. Metal is projected to grow at a 5.86% CAGR to 2031.
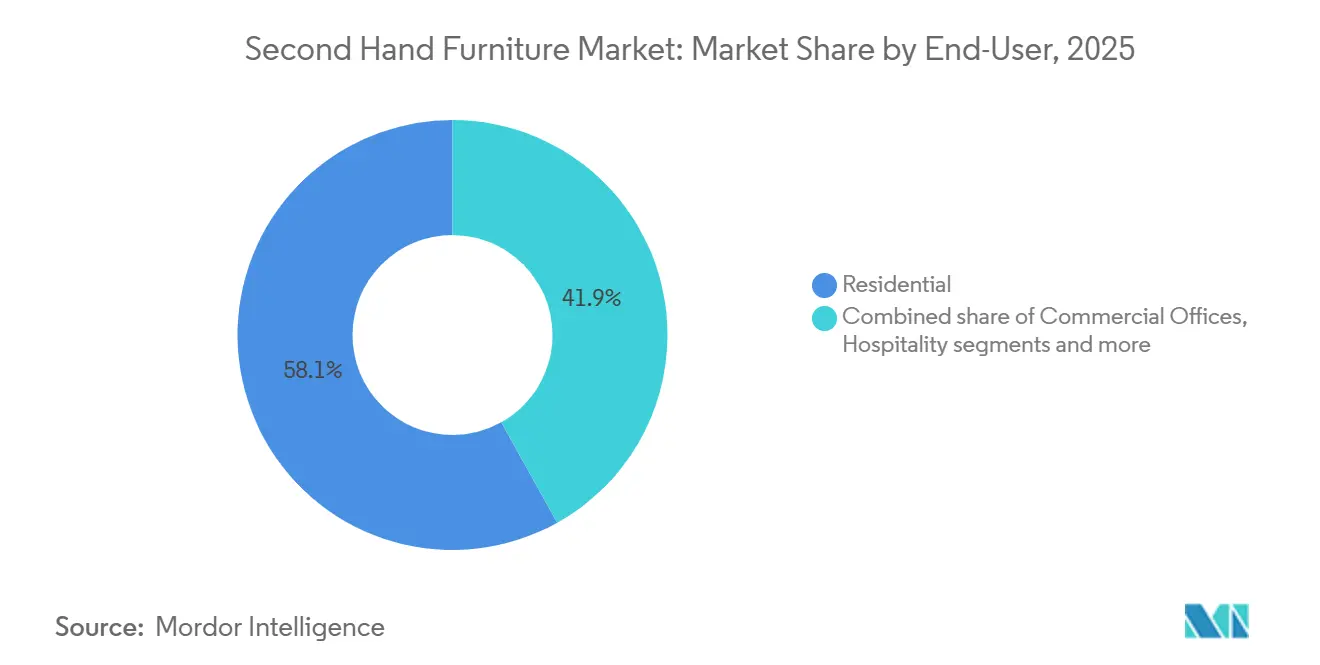
- By end user, residential accounted for 58.15% of revenue share in 2025. Hospitality and leisure are projected to grow at a 5.63% CAGR to 2031.
- By distribution channel, online marketplaces led with 40.92% revenue share in 2025. Online marketplaces are projected to grow at a 6.20% CAGR to 2031.
- By geography, North America accounted for 33.10% of second hand furniture market in 2025. Asia-Pacific is projected to grow at a 6.56% CAGR to 2031, the fastest among regions.
Note: Market size and forecast figures in this report are generated using Mordor Intelligence’s proprietary estimation framework, updated with the latest available data and insights as of January 2026.
Global Second Hand Furniture Market Trends and Insights
Drivers Impact Analysis*
| Driver | (~) % Impact on CAGR Forecast | Geographic Relevance | Impact Timeline |
|---|---|---|---|
| EPR and circular-economy policies are expanding reuse and take-back | +0.9% | European Union core (France, Portugal, Belgium, Netherlands), spillover to the United Kingdom | Medium term (2–4 years) |
| Cost-of-living shift and value-seeking boost to pre-owned purchases | +1.2% | Global, with intensity in North America, the United Kingdom, and Western Europe | Short term (≤ 2 years) |
| Online/local marketplaces are scaling bulky-item discovery and fulfillment | +1.5% | North America, Western Europe, Asia-Pacific emerging (India, China, Southeast Asia) | Short term (≤ 2 years) |
| Corporate office decommissioning driving surplus, quality supply | +1.0% | North America (San Francisco, NYC, Austin), selective EMEA metros (London, Paris) | Short term (≤ 2 years) |
| Retailer buyback and pre-owned programs are creating owned resale channels | +0.8% | European Union, North America, select Asia-Pacific (Japan) | Medium term (2–4 years) |
| Digital product passports and traceability, enabling verified resale | +0.6% | European Union mandatory by 2027–2028, voluntary adoption in the United Kingdom, North America | Long term (≥ 4 years) |
| Source: Mordor Intelligence | |||
EPR and circular-economy policies are expanding reuse and take-back
The European Union’s product and waste framework is broadening responsibility for end-of-life management and prioritizing durability, repairability, and traceability, thereby legitimizing and scaling the second-hand furniture market by aligning incentives for take-back and reuse. The Ecodesign for Sustainable Products Regulation entered into force in 2024, and the 2025-2030 working plan prioritizes furniture and mattresses, laying the path for digital product passport requirements that standardize lifecycle data useful for secondary sales[1]EUR-Lex, “Regulation (EU) 2024/1781,” eur-lex.europa.eu, eur-lex.europa.eu. France’s national scheme Écomaison operationalizes eco-contributions and promotes reuse and refurbishment, while parallel national implementations, such as Portugal’s Decree-Law No. 24/2024, extend EPR to furniture, with quantified collection and recycling targets that feed serviceable goods into resale or donation streams. The European Union’s 2025-2030 working plan under ESPR and the direction of the revised Waste Framework move producers toward modular designs and documented repair paths that reduce reverse-logistics friction and lower risk for resale operators. As labeling and information requirements standardize, platforms and refurbishers can assess and grade items more consistently, narrowing the trust gap that once slowed larger-ticket second-hand transactions. Over 2026-2028, the policy shift reframes compliance as a demand catalyst by making circular claims verifiable and by cutting the perceived risk of buying used goods with unknown provenance.
Cost-of-living shift and value-seeking boost to pre-owned purchases
Persistent household budget pressure keeps value-seeking top of mind and steers consumers toward pre-owned options that deliver large price-to-quality advantages, which sustains the second hand furniture market even when new-product prices stabilize. eBay’s 2025 Recommerce Report showed that saving money is the top stated reason for buying pre-loved goods, and a large share of consumers plan to maintain or increase their second hand spending, with younger cohorts leading the adoption. Interior designers and specifiers are a parallel demand engine, turning to vintage and consignment pieces to differentiate projects and manage budgets, while curated platforms report steady trade growth driven by more professional sellers. Charitable outlets continue to attract budget-conscious home improvers and divert significant volumes from landfill, as evidenced by Twin Cities Habitat for Humanity ReStore’s 2024 activity and 2025 expansion, which anchor local reuse ecosystems. Large retailers reinforce the cycle by operating buyback programs that issue store credit and resell inspected returns, which deepens customer relationships and turns second hand into a mainstream, first-party channel. The value proposition remains durable because verified second hand compresses layers of brand markup and distribution costs that weigh on new furniture, while curated operators and logistics partners remove hidden hassles that otherwise deter higher-value purchases.
Online and local marketplaces are scaling bulky-item discovery and fulfillment
Online marketplaces aggregate local inventory at scale and optimize discovery through search, photos, and standardized listing flows, which is why they hold the largest channel share and are set to grow the fastest among channels in the second hand furniture market through 2031. Cross-platform integrations extend seller reach without additional work, as illustrated by eBay listings gaining visibility on Facebook Marketplace while checkout remains on eBay, thereby capturing latent demand within social feeds. In several Asian markets, classifieds applications such as OLX-backed platforms scaled to very high user bases in 2024 and continue to refine mobile listing tools and in-app messaging, compressing transaction time and improving liquidity. Logistics is the decisive unlock for bulky furniture, and white-glove providers now bundle home delivery, placement, assembly, and debris removal at disclosed price bands that reduce uncertainty for buyers. Express carriers and freight brokers offer heavy-item options with end-to-end visibility, customs brokerage (where relevant), and predictable scheduling, expanding the viable radius for transactions beyond local pickup. As marketplaces absorb more of the logistics workflow, they turn what used to be a multi-party coordination problem into a smoother checkout experience, which supports higher conversion and larger average order values.
Corporate office decommissioning is driving surplus, quality supply
Real estate optimization across major office markets channels large volumes of young, brand-name furniture into resale, which reliably replenishes supply for both consumer and business buyers in the second-hand furniture market. Cresa’s San Francisco evidence of contraction and downsizing among large tenants illustrates the structural shift that fuels liquidations of workstations, task chairs, conference tables, and storage systems that often remain in serviceable condition. Structured circular decommissioning models drive very high diversion rates by combining resale, donation, and certified recycling, and Green Standards’ case work with large technology companies demonstrates 99% diversion for complex, multi-site projects across regions. Case studies document complete landfill diversion across international office exits, with specific splits among employee gifting, community donations, and material recycling, which expand the channel’s social-impact footprint while preserving value from surplus. Platforms are purpose-built for asset exchange within large organizations, and their partner networks exhibit additional diversification with historical weights and categories, such as hospital systems routing tens of thousands of pounds of furniture through managed reuse. Industry associations have underscored that office furniture historically reached landfills despite having usable life remaining, highlighting the arbitrage for refurbishers who clean, repair, and resell at a steep discount to new while meeting functional needs. The continuous nature of lease churn and periodic redesigns in hybrid environments indicates that this supply engine remains active throughout the forecast period, sustaining inventory quality that keeps the channel competitive.
Restraints Impact Analysis*
| Restraint | (~) % Impact on CAGR Forecast | Geographic Relevance | Impact Timeline |
|---|---|---|---|
| Bulky-item last-mile cost and complexity are depressing conversion | -1.3% | Global, acute in rural or low-density markets | Short term (≤ 2 years) |
| Hygiene or infestation concerns are limiting upholstered demand | -0.7% | France, the United Kingdom, North America, and urban areas | Short term (≤ 2 years) |
| Fire-safety labeling and compliance barriers in the United Kingdom resale | -0.4% | The United Kingdom primarily, and the potential European Union variability | Medium term (2–4 years) |
| Limited warranties and quality standardization are dampening buyer trust | -0.9% | Global, acute in peer-to-peer channels | Medium term (2–4 years) |
| Source: Mordor Intelligence | |||
Bulky-item last-mile cost and complexity are depressing conversion
Bulky furniture requires two-person crews, scheduled windows, and sometimes assembly, which raises shipping quotes that many buyers are not prepared to pay at checkout. White-glove providers improve certainty by bundling in-home delivery, placement, and debris removal, and operators publish price bands that help buyers weigh total cost before committing to purchase. Freight and express networks also offer large and heavy services with clear dimensions and weight thresholds and end-to-end tracking, which expands the radius for second hand transactions beyond hyperlocal pickup. Marketplaces are working to embed shipping estimators and pre-negotiated carrier options directly into the listing flow, so buyers see delivery pricing up front, which is now common among curated platforms. Even with these tools, rural and low-density areas face higher surcharges and longer lead times, which suppresses conversion relative to large metros with dense carrier coverage. Until more platforms underwrite or subsidize last-mile or consolidate residential pickups at scale, last-mile cost remains a ceiling on conversion for higher-ticket second hand furniture purchases.
Hygiene or infestation concerns are limiting upholstered demand.
Upholstered items, especially sofas, headboards, and mattresses, carry a perceived hygiene risk that some buyers price in with steep discounts or avoid entirely, which slows resale cycle times versus hard-surface categories like wood and metal. France’s bedbug experience shows how public concern can swell, and national authorities provided practical guidance on mechanical treatments and temperature thresholds that households can apply to mitigate risk[2]ANSES, “Bed Bugs,” anses.fr, anses.fr. Many platforms and retailers exclude second hand mattresses from buyback or resale to reduce liability, and charities enforce strict acceptance policies, which concentrate upholstered resale on lower-price, peer-to-peer channels. The lack of standardized hygiene certification for used upholstery leaves buyers to self-inspect, which can lag weeks behind similar-condition hard-surface pieces. Clear protocols that include vacuuming, heat treatment, freezing, or professional steam cleaning exist, but the added time and cost often tilt shoppers toward verified, non-upholstered alternatives. Until digital product passports or third-party inspections provide credible documentation of hygiene history, the category is likely to underperform.
*Our forecasts treat driver/restraint impacts as directional, not additive. The impact forecasts reflect baseline growth, mix effects, and variable interactions.
Segment Analysis
By Product Type: Office furniture accelerates as supply quality rises
Sofas and couches accounted for 28.74% of the second hand furniture market size in 2025, reflecting high household replacement needs, while office furniture is projected to grow at a 5.08% CAGR through 2031 as corporate rightsizing injects branded, lightly used inventory into circulation. High-grade task chairs, workstations, and conference pieces often arrive from enterprises within five years of purchase, which aligns with buyer preferences for durability and recognizability. Circular decommissioning practices expand the usable pool and keep value in circulation, with documented projects achieving near-complete diversion by balancing resale, donation, and certified recycling. This discipline pairs well with platforms that route B2B furniture to budget-conscious startups and coworking operators that need flexible furnishings at steep discounts to new customers. Residential categories continue to move in step with urban relocation patterns and first-apartment formation, which lifts demand for beds, tables, and chairs that fit into compact spaces and can be shipped with predictable services.
Shorter office space commitments and hybrid layouts keep churn elevated, which creates a structural surplus of refurbishable pieces that enter resale channels consistently over the forecast window. Refurbishers and specialized outlets speed up turnaround by offering cleaned, warranty task chairs and certified workstations with documented parts replacements, which widens appeal to small businesses and remote workers. Donation and nonprofit distribution extend the lifecycle of items that do not meet resale standards while keeping them out of landfills, which deepens community impact[3]Twin Cities Habitat for Humanity ReStore, “Impact and Store Updates,” reuse.habitat.org, restore.tchabitat.org. In parallel, curated marketplaces support premium residential categories for sofas, case goods, and artisan tables, diversifying inventory beyond corporate surplus and sustaining designer-led aesthetics at accessible prices. The interplay between steady B2B surplus and resilient residential demand establishes a balanced growth base for product types that span both visible statement items and work essentials in the second-hand furniture market.


By Material: Wood retains the lead while metal accelerates
Wood retained the largest share at 44.18% of the second-hand furniture market in 2025, while metal is projected to grow fastest at 5.86% as buyers prize lightweight, modular, and easy-to-clean surfaces for flexible spaces. Wood’s repair-friendly nature and timeless aesthetics keep it in demand across resale venues, and it remains central to vintage and artisan trends favored by design professionals. Retailer buyback programs also skew toward wood case goods and tables, which are easier to inspect, refurbish, and resell with confidence than soft goods. Community reuse outlets report strong diversion of wood sets and desks that meet households' daily needs, balancing function and price. Upholstered pieces lag in resale because of hygiene concerns and labeling requirements, which redirects buyers toward wood and metal as safer bets when provenance is uncertain.
Metal’s growth benefits from modern and industrial aesthetics, as well as practical attributes such as durability and weight, which simplify handling and delivery. Office surplus delivers a steady stream of metal frames, storage, and bases that refurbish easily and meet the needs of startups and flexible workspaces. Plastics and composites serve outdoor and budget niches but face headwinds from hygiene perceptions and environmental concerns, which limit premiums in curated channels. As digital product passports document materials, finishes, and repair histories, buyers gain more confidence when choosing between wood and metal options, with full information on durability and substances of concern. The mix across materials reflects a practical tilt in the second-hand furniture market toward pieces that are easy to verify, refresh, and transport at a predictable cost.
By End-User: Hospitality accelerates while residential dominates
The residential segment led with 58.15% of second hand furniture market share in 2025, powered by household formation, relocations, and value-seeking, while hospitality and leisure are projected to grow at 5.63% CAGR through 2031, as hotels, restaurants, and short-stay operators deploy second-hand sourcing to optimize fit-out budgets. Residential demand aligns with marketplace strengths such as local pickup, manageable delivery distances, and fast turnover for compact pieces that fit urban dwellings. Large retailers’ buyback programs normalize second-hand for mainstream shoppers by offering store credit and standard return policies, making pre-owned a routine option during life events such as moves and renovations[4]IKEA, “Buy Back & Resell,” ikea.com, ikea.com. Commercial offices continue to procure pre-owned task chairs and desks as hybrid work solidifies, which pairs capex control with sustainability targets and shortens lead times compared with new production. Education, healthcare, and public facilities participate selectively, as permitted by policy and hygiene rules, and often source standard case goods and storage units through trusted refurbishers.
Hospitality and leisure leverages vintage and reclaimed aesthetics to differentiate guest experiences, and curated marketplaces report strong designer interest in artisan and vintage categories that feed this look. Operators value fast availability, and the ability to mix unique pieces with durable basics, and second-hand channels supply both through steady office surplus and curated residential consignments. Residential buyers continue to anchor the second-hand furniture market because of the broad selection and clear savings relative to new, which match a wide range of budgets and styles. As provenance verification scales through digital product passports, institutional buyers gain greater confidence in selecting categories, which could widen participation among end users who face stricter compliance requirements. The combined effect is a stable base in residential, with faster growth in commercial niches that prioritize agility, differentiation, and verified sustainability outcomes in the second-hand furniture market.
By Distribution Channel: Online marketplaces consolidate via logistics integration
Online marketplaces accounted for 40.92% of the second-hand furniture market share in 2025 and are projected to grow at a 6.20% CAGR, outpacing specialty resale stores and thrift chains as platform logistics and payments streamline the bulky-item experience. Integrated partnerships extend seller reach by syndicating listings across platforms while keeping checkout on the original marketplace, boosting discovery without extra work for sellers. Apps that compress listing flow with AI-assisted pricing and built-in messaging shorten the time to transact and open more local inventory for buyers who would otherwise defer purchase. On the delivery side, embedded shipping estimators and pre-negotiated options replace ad hoc arrangements, boosting buyer confidence and reducing abandoned carts due to shipping uncertainty. Charity and community channels remain strong where free pickup and low prices meet household needs, ensuring that value-focused shoppers continue to support local reuse ecosystems alongside national platforms.
Specialty resale stores, designer-led marketplaces, and auction formats fill distinctive roles by offering curation, provenance documentation, and higher service levels, which earn premiums relative to unmanaged classifieds. Peer-to-peer classifieds stay relevant for budget items and very local moves, but the absence of standardized grading or embedded warranties caps average transaction values in those channels. Over 2026–2031, marketplaces that can integrate verified provenance data from digital product passports are positioned to differentiate further on trust, which matters more as item values rise. Platforms that combine logistics orchestration, quality controls, and seller vetting will expand their share of the second-hand furniture market, as these features reduce friction for high-intent buyers. The net effect is a gradual migration of higher-value transactions toward managed marketplaces as the channel continues to professionalize.
Geography Analysis
North America held a 33.10% of second hand furniture market share in 2025, with growth underpinned by mature marketplace infrastructure, steady office decommissioning flows, and retailer-run buyback programs that increase verified supply for resale. Large charity networks and nonprofit reuse programs capture significant diversion to serve local communities, complementing commercial resale and strengthening the region’s circular footprint. Integrated last-mile and white-glove delivery services are more widely available in large United States and Canadian metros, which improves buyer conversion for heavier or higher-value items. Ongoing office downsizing in key urban markets continues to drive demand for brand-name task chairs and systems furniture that appeal to remote workers and startups. Retailer buyback activity in the United States also channels refurbished wood case goods and small tables into branded resale sections that normalize pre-owned choices.
Asia-Pacific is the fastest-growing region in the second hand furniture market, with a 6.56% projected CAGR through 2031, as classifieds platforms in India, China, and Southeast Asia scale user bases and optimize mobile-first listing and messaging to accelerate matching. Platforms operated by or affiliated with large online groups report strong user metrics and invest in experience improvements that compress time-to-transaction and expand categories. Dense urban clusters create a natural fit for local pickup models and short-haul delivery, which favor bulky categories like furniture when integrated logistics are present. Variation in logistics coverage and regulatory frameworks across markets creates uneven access outside major metros, but the momentum in high-density corridors sustains strong regional growth. As traceability expectations spread from the European Union through global value chains over 2026-2028, leading Asia-Pacific platforms can differentiate by offering verification features for mid-to-high-value second-hand furniture, which supports higher realized prices.
In the second hand furniture market, Europe benefits from the most developed circular policy environment, including EPR expansion and ESPR-driven ecodesign and digital product passport requirements that elevate transparency and reuse. National schemes such as France’s Écomaison and evolving United Kingdom fire-safety labeling rules have direct implications for second-hand channels, both by enabling reuse and by setting compliance hurdles for certain categories. Charity and community retail play a large role in the region’s reuse ecosystem, while curated marketplaces support designer and artisan segments with provenance documentation. The second-hand furniture market is poised to benefit from European Union-level digital infrastructure for product passports, expected to launch by 2026 and become mandatory for furniture categories later in the forecast, which will ease cross-border resale and verification. Overall, Europe’s growth remains solid as policy and retail models reinforce reuse at scale.

Competitive Landscape
The second hand furniture market remains fragmented because it spans charity shops, local auctions, specialty resale stores, retailer-owned buyback outlets, and large online marketplaces, with no player approaching dominance. Curated platforms focus on designer, vintage, and artisan pieces and differentiate through authentication, provenance documentation, and embedded white-glove services that command premiums. Community reuse networks deliver scale through free collection and local distribution that serve households and nonprofits, which sustains broad-based access to low-cost furnishings. Large discovery platforms aggregate substantial buyer traffic and convert better as they integrate payments and logistics, while cross-listing partnerships increase inventory visibility. Retailers’ owned resale programs create controlled environments with known brands, store credit incentives, and standardized returns, which bring new cohorts into pre-owned without the uncertainties of peer-to-peer.
Strategic moves concentrate around four themes. First, provenance and verification, where digital product passports and platform-level certification services position sellers to justify higher prices for documented goods. Second, logistics and delivery, where marketplaces build price estimators and carrier integrations that reduce abandonment of bulky items. Third, buyback and refurbishment, where retailers reclaim products, grade conditions transparently, and return items to the floor with consistent policies. Fourth, B2B circular decommissioning, where specialists handle multi-location projects and maximize diversion through resale, donation, and material recovery, then document impact for corporate sustainability reporting. Together, these playbooks reinforce trust, reliability, and convenience, which are the levers that shift demand from new to pre-owned in higher-value categories.
Chairish sustained profitability while growing designer transactions, helped by shipping tools and a professional seller base that reduces fraud and variability. eBay and Facebook’s partnership amplifies listing reach while protecting checkout integrity on the origin platform, which helps sellers move bulky inventory without duplicating effort. IKEA’s buyback program demonstrates that circular revenue can be material to overall turnover and that standardized grading and returns can draw mainstream shoppers into pre-owned. Asset-exchange platforms and decommissioning specialists continue to document large-scale landfill diversion for enterprise clients, which broadens the inflow of high-quality, branded office furniture into the second hand furniture market. These combined moves support a competitive environment in which no single channel wins outright and where differentiation in verification, logistics, and service defines leadership.
Second Hand Furniture Industry Leaders
eBay Inc.
Facebook Marketplace
OLX Group
Xianyu (Alibaba’s Idle Fish)
Adevinta
- *Disclaimer: Major Players sorted in no particular order

Recent Industry Developments
- April 2025: The United Kingdom’s Furniture and Furnishings (Fire Safety Amendment) Regulations 2025 took effect, removing display labels for new products while retaining permanent labels for second hand upholstered items and extending the window for legal proceedings.
- October 2025: eBay acquired Nordic social Marketplace Tise (a consumer-to-consumer (C2C) social marketplace). This acquisition strengthened eBay’s global consumer-to-consumer (C2C) proposition, building on the significant momentum it has achieved in enhancing the customer experience.


Global Second Hand Furniture Market Report Scope
A complete background analysis of the second-hand furniture market, which includes an assessment of the parental market, emerging trends by segments and regional markets, Significant changes in market dynamics, and a market overview, is covered in the report.
The Second Hand Furniture Market is Segmented By Type (Kitchen Furniture, Dining Furniture, Living Room Furniture, Bathroom Furniture, Indoor Furniture, and Outdoor Furniture), By Application (Residential, and Commercial), By Distribution Channel (Online, and Offline), by Geography (North America, Europe, Asia-Pacific, South America, and the Middle East and Africa). The report offers market size and forecast values for the Second Hand Furniture Market in (USD) for the above segments.
| Sofas & Couches |
| Beds & Headboards |
| Tables (Dining, Coffee, Side) |
| Chairs & Stools |
| Storage Furniture (Wardrobes, Cabinets) |
| Office Furniture |
| Outdoor Furniture |
| Wood |
| Metal |
| Plastic & Composite |
| Upholstered |
| Others (Glass, Rattan) |
| Residential |
| Commercial Offices |
| Hospitality & Leisure |
| Educational Institutions |
| Others (Healthcare, Public) |
| Online Marketplaces |
| Specialty Re-sale Stores |
| Thrift & Charity Shops |
| Auction Houses |
| Peer-to-Peer / Classifieds |
| North America | Canada |
| United States | |
| Mexico | |
| South America | Brazil |
| Peru | |
| Chile | |
| Argentina | |
| Rest of South America | |
| Europe | United Kingdom |
| Germany | |
| France | |
| Spain | |
| Italy | |
| BENELUX (Belgium, Netherlands, Luxembourg) | |
| NORDICS (Denmark, Finland, Iceland, Norway, Sweden) | |
| Rest of Europe | |
| Asia-Pacific | India |
| China | |
| Japan | |
| Australia | |
| South Korea | |
| South-East Asia | |
| Rest of Asia-Pacific | |
| Middle East & Africa | United Arab Emirates |
| Saudi Arabia | |
| South Africa | |
| Nigeria | |
| Rest of Middle East & Africa |
| By Product Type | Sofas & Couches | |
| Beds & Headboards | ||
| Tables (Dining, Coffee, Side) | ||
| Chairs & Stools | ||
| Storage Furniture (Wardrobes, Cabinets) | ||
| Office Furniture | ||
| Outdoor Furniture | ||
| By Material | Wood | |
| Metal | ||
| Plastic & Composite | ||
| Upholstered | ||
| Others (Glass, Rattan) | ||
| By End User | Residential | |
| Commercial Offices | ||
| Hospitality & Leisure | ||
| Educational Institutions | ||
| Others (Healthcare, Public) | ||
| By Distribution Channel | Online Marketplaces | |
| Specialty Re-sale Stores | ||
| Thrift & Charity Shops | ||
| Auction Houses | ||
| Peer-to-Peer / Classifieds | ||
| By Region | North America | Canada |
| United States | ||
| Mexico | ||
| South America | Brazil | |
| Peru | ||
| Chile | ||
| Argentina | ||
| Rest of South America | ||
| Europe | United Kingdom | |
| Germany | ||
| France | ||
| Spain | ||
| Italy | ||
| BENELUX (Belgium, Netherlands, Luxembourg) | ||
| NORDICS (Denmark, Finland, Iceland, Norway, Sweden) | ||
| Rest of Europe | ||
| Asia-Pacific | India | |
| China | ||
| Japan | ||
| Australia | ||
| South Korea | ||
| South-East Asia | ||
| Rest of Asia-Pacific | ||
| Middle East & Africa | United Arab Emirates | |
| Saudi Arabia | ||
| South Africa | ||
| Nigeria | ||
| Rest of Middle East & Africa | ||


Key Questions Answered in the Report
What is the current size and growth outlook for the secondhand furniture market?
The secondhand furniture market size is estimated to be valued USD 49.46 billion in 2026 and is projected to reach USD 62.66 billion by 2031 at a 4.85% CAGR.
Which product categories are leading, and which are growing the fastest?
Sofas and couches led with 28.74% share in 2025, while office furniture is expected to post the fastest growth at a 5.08% CAGR through 2031.
Which channels are outperforming in secondhand furniture?
Online marketplaces held a 40.92% share in 2025 and are projected to grow at a 6.20% CAGR as logistics integration and payment protections lift conversion.
Which region will contribute the most incremental growth to 2031?
Asia-Pacific is the fastest-growing region with a 6.56% projected CAGR, supported by scaled classifieds platforms and dense urban markets.
What are the main barriers to conversion for bulky secondhand items?
Last-mile delivery cost and complexity, hygiene concerns for upholstery, and lack of standardized warranties are the primary hurdles, though integrated logistics and retailer buybacks are mitigating these issues.
Page last updated on:


