
Off-Road Vehicle Market Size and Share
Market Overview
| Study Period | 2019 - 2031 |
|---|---|
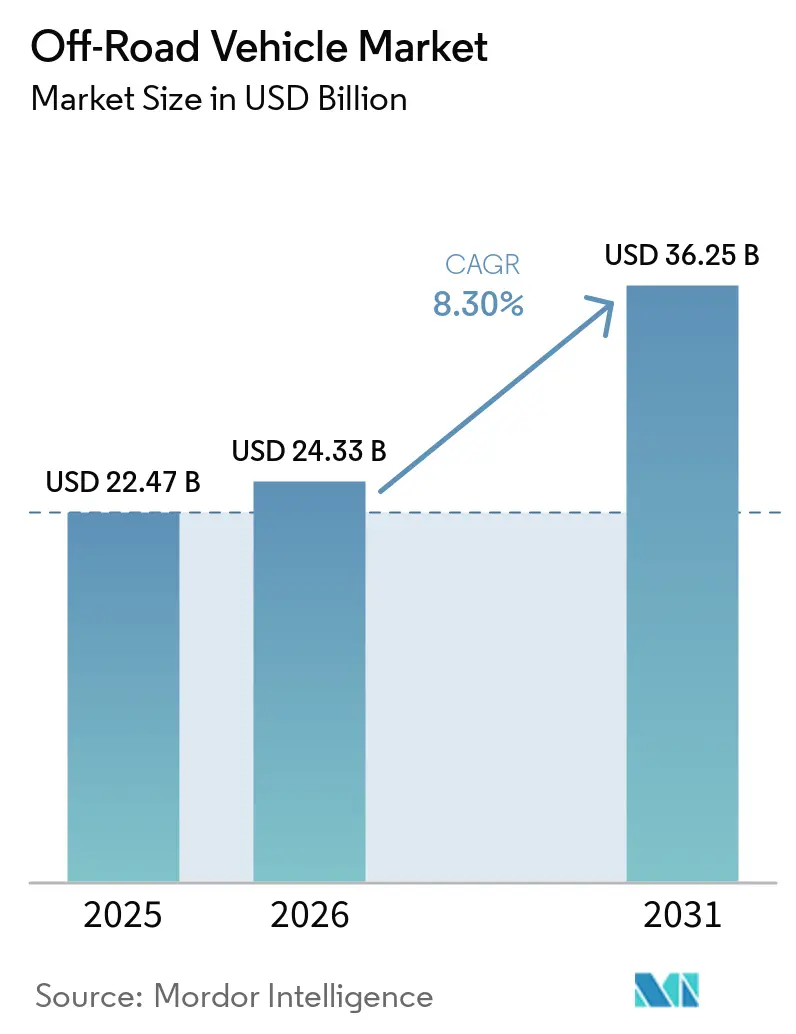
| Market Size (2026) | USD 24.33 Billion |
| Market Size (2031) | USD 36.25 Billion |
| Growth Rate (2026 - 2031) | 8.30 % |
| Fastest Growing Market | Asia-Pacific |
| Largest Market | North America |
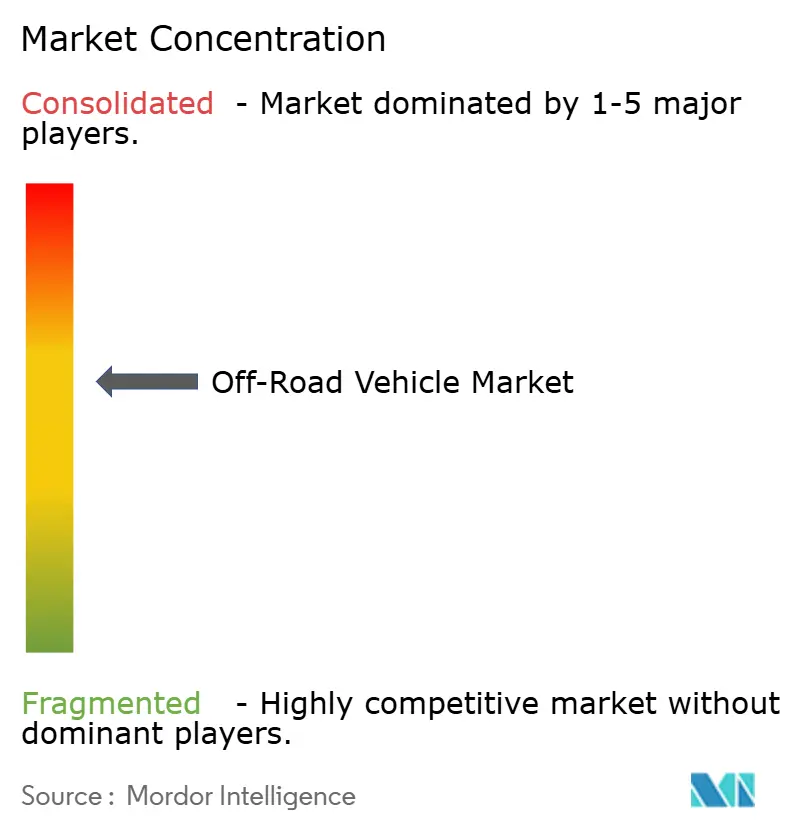
| Market Concentration | Medium |
Major Players *Disclaimer: Major Players sorted in no particular order Image © Mordor Intelligence. Reuse requires attribution under CC BY 4.0. | |
Off-Road Vehicle Market Analysis by Mordor Intelligence
The off-road vehicle market size is projected to expand from USD 22.47 billion in 2025 and USD 24.33 billion in 2026 to USD 36.25 billion by 2031, registering a CAGR of 8.30% between 2026 and 2031. Demand rests on recreation, defense procurement, and agricultural utility use rather than a single buyer group. Outdoor recreation contributed USD 696.7 billion in value added during 2024, equal to 2.4% of U.S. GDP, while gross output exceeded USD 1.3 trillion [1]“Outdoor Recreation Economic Statistics, U.S. and States, 2024,” U.S. Bureau of Economic Analysis, BEA News Release, bea.gov. . That scale supports vehicle purchases, accessories, servicing, and replacement demand across the off-road vehicle market. Defense contracts create a separate source of demand, while farm use broadens the customer base beyond recreational riders. Manufacturers are also balancing established combustion platforms with electric models, connected functions, and more capable multi-passenger vehicles. The resulting product strategy is not limited to a single customer profile. It must address riders who want access to trails, operators who need dependable work equipment, and public-sector buyers that use specialized tactical vehicles. That breadth gives the category several routes to growth, but it also raises the importance of distribution, service, and reliable supply chains.
Key Report Takeaways
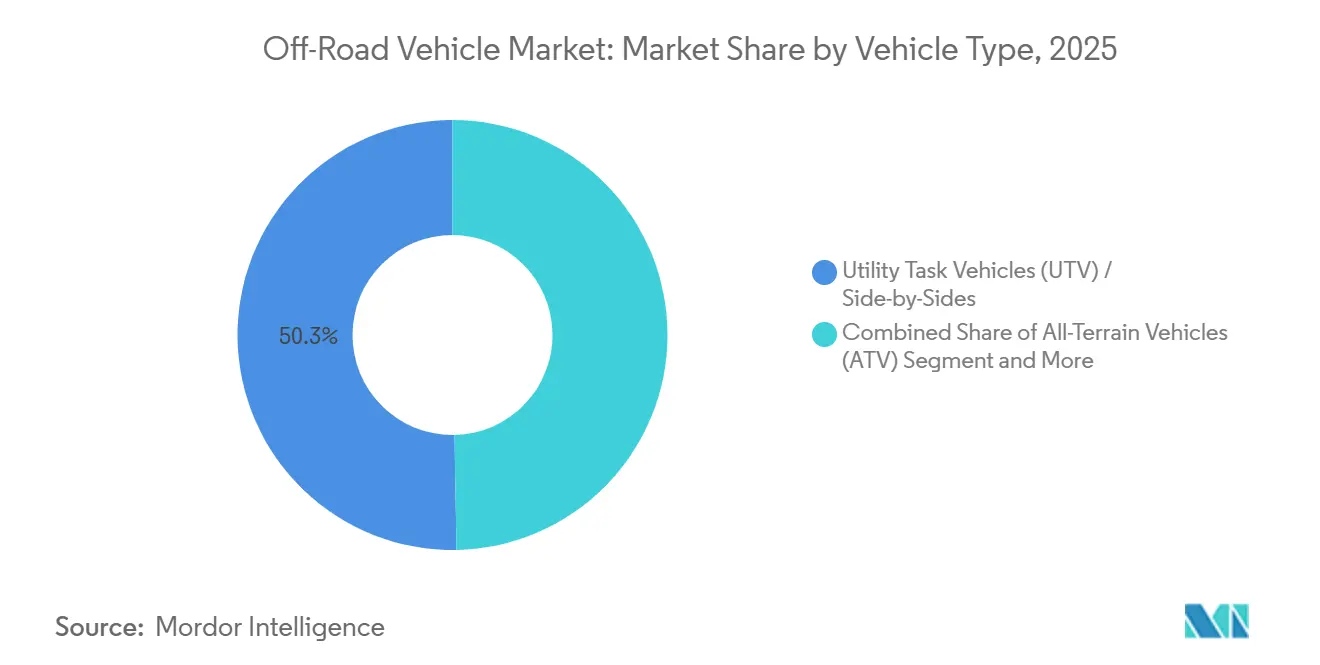
- By vehicle type, Utility Task Vehicles/Side-by-Sides led with a 50.33% revenue share in 2025, and the same segment is set to grow with the fastest CAGR of 8.45%.
- By application, sports and recreation held 42.14% of 2025 revenue, while military and law enforcement will record the highest projected CAGR at 8.93% through 2031.
- By propulsion type, internal combustion engines led with 84.12% of 2025 revenue, while battery-electric models are set to record the highest projected CAGR at 9.41% through 2031.
- By engine displacement, the 400–800 cc category held 45.03% of 2025 revenue, while the more-than-800 cc category is set to grow at the highest projected CAGR of 9.12% through 2031.
- By power output, the 50–100 kW category held 40.24% of 2025 revenue, while units above 100 kW will record the highest projected CAGR at 8.75% through 2031.
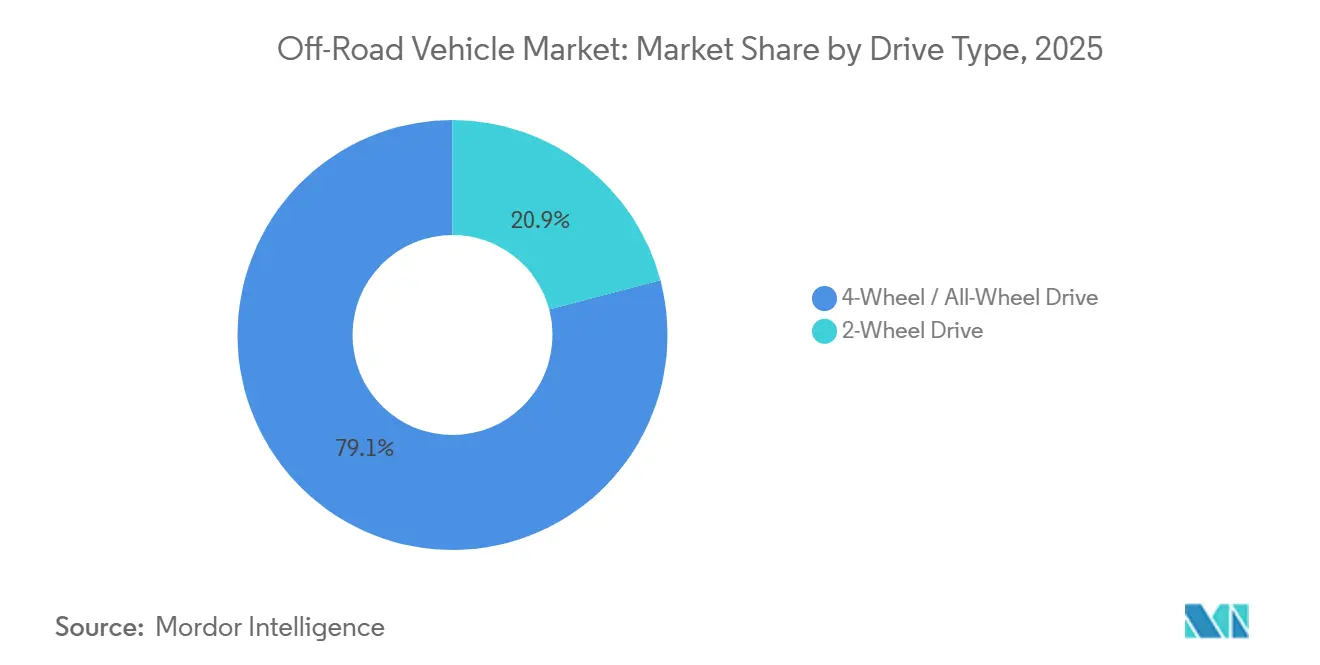
- By drive type, 4-Wheel/All-Wheel Drive held 79.11% of 2025 revenue and is set to expand with the highest projected CAGR at 9.46% through 2031.
- By seating capacity, 2-rider vehicles held 52.33% of 2025 revenue, while more-than-3-passenger vehicles will record the highest projected CAGR at 9.65% through 2031.
- By geography, North America held a 39.17% share in 2025, while Asia-Pacific is projected to grow at a 9.22% CAGR.
Note: Market size and forecast figures in this report are generated using Mordor Intelligence’s proprietary estimation framework, updated with the latest available data and insights as of 2026.
Market Trends and Insights
Drivers Impact Analysis of Off-Road Vehicle Market*
| Driver | (~) % Impact on CAGR Forecast | Geographic Relevance | Impact Timeline |
|---|---|---|---|
| Outdoor Recreational Tourism | +2.0% | Global, with emphasis on North America, Western Europe, and Asia-Pacific leisure destinations | Medium term (2-4 years) |
| Defense Tactical Vehicle Procurement | +1.5% | Global, with emphasis on North America, NATO Europe, and the Indo-Pacific | Long term (≥ 4 years) |
| Midsize Farm Mechanization | +1.5% | Asia-Pacific, South America, and Middle East and Africa agricultural areas | Long term (≥ 4 years) |
| Advanced EPS and Telematics | +1.2% | North America, Europe, and selected Asia-Pacific markets | Medium term (2-4 years) |
| Low-Noise E-ATV Demand | +0.4% | North America, Western Europe (United Kingdom, Germany, France) | Short term (≤ 2 years) |
| Nordic Trail-Maintenance Subsidies | +0.3% | Canada, Scandinavia, select northern United States | Short term (≤ 2 years) |
| Source: Mordor Intelligence | |||


Surge in Outdoor Recreational Tourism
Outdoor recreation remains a broad demand base for the off-road vehicle market because it supports repeated trail use rather than isolated vehicle purchases. The U.S. Bureau of Economic Analysis reported USD 1.3 trillion in outdoor recreation gross output during 2024. Canada supported access through a CAD 1.7 million (~USD 1.19 million) commitment for Northern Ontario outdoor tourism and trail activity in February 2025 [2]“FedNor Investing Over $1.7 Million in Support of Northern Ontario’s Outdoor Tourism Industry,” FedNor, canada.ca. . British Columbia directed CAD 500,000 (~USD 356,888) to 24 off-road vehicle trail projects in 2026. These investments improve access, which can support vehicle retention, accessory purchases, servicing, and later replacement. The off-road vehicle market therefore benefits when public trail networks make riding more practical for households and organized user groups.
Tactical ATV/UTV Procurement by Defense Forces
Defense procurement gives the off-road vehicle market demand that is less dependent on household recreation budgets. The U.S. Marine Corps awarded Polaris Government and Defense a sole-source contract of up to USD 98 million in May 2026 for MRZR Alpha ultra-light tactical vehicles [3]“U.S. Marine Corps Issues New, Sole-Source Contract to Polaris Government and Defense for MRZR Alpha Ultra-Light Tactical Vehicles,” Polaris Inc., polaris.com. . The contract included a 5 kW exportable-power variant and covers production for up to 5 years. Belgium then placed a USD 10.6 million MRZR D4 order through the NATO Support and Procurement Agency framework in July 2026. The framework reduces duplicative national trials and can shorten procurement processes for allied buyers. Its requirements for portable power, payload management, and air transport can also influence future civilian utility platforms.
Rapid Mechanization of Midsize Farms
Farm use changes the role of the off-road vehicle market from recreation-led spending toward work-focused equipment demand. Utility vehicles can carry tools, supplies, and personnel across irregular land where larger machinery is not always suitable. Kubota introduced the RTV-X Long Bed in October 2025 with a 6-foot steel cargo bed rated for 1,212 pounds. The product positioning linked the vehicle to commercial farming and landscape contracting. Older farm operators can favor lower-fatigue vehicles that simplify movement between fields and work sites. This use case gives the off-road vehicle market a more durable base in agricultural regions of Asia-Pacific, South America, and North America.
Adoption of Advanced EPS & Telematics
Electric power steering and connected functions can expand the off-road vehicle market by improving usability and fleet support. KYB began mass production in 2024 of a column electric power steering system for Yamaha Wolverine RMAX 1000 and Grizzly 700 vehicles. The system used an in-house brushless motor power pack and brought a more refined steering response to utility-class vehicles. Connected systems can provide maintenance alerts, location data, and fleet oversight for commercial users. Those functions can support dealer service relationships after the original sale. They also make utility vehicles more suitable for operators that measure uptime, maintenance scheduling, and equipment use across larger fleets.
Restraints Impact Analysis of Off-Road Vehicle Market*
| Restraint | (~) % Impact on CAGR Forecast | Geographic Relevance | Impact Timeline |
|---|---|---|---|
| Upfront and Lifecycle Costs | -1.5% | Global, with greater effect in emerging markets that have limited financing | Long term (≥ 4 years) |
| Lithium Supply-Chain Pressure | -0.9% | Global, with greater exposure among manufacturers without diversified sourcing | Medium term (2-4 years) |
| Rising Injury-Related Regulations | -0.8% | North America (California AB-1613), EU Natura 2000 zones, select Asia-Pacific markets | Short term (≤ 2 years) |
| Conservation-Area Usage Bans | -0.5% | North America public lands, EU protected habitats, select Asia-Pacific national parks | Medium term (2-4 years) |
| Source: Mordor Intelligence | |||
High Upfront & Lifecycle Costs
High vehicle prices can limit the off-road vehicle market, where financing and dealer coverage remain limited. Entry-level utility vehicles can require a substantial upfront purchase, while performance models carry higher prices before accessories and servicing. Segway listed the Super Villain SX20T at USD 33,999 for United States retail availability in May 2026. Scheduled servicing, replacement parts, insurance, and transport add to ownership costs over time. These expenses weigh more heavily on small-acreage operators and first-time buyers. Manufacturers can respond through durable designs, field-serviceable components, rental fleets, and dealer finance options that lower the practical barrier to use.
Lithium Supply-Chain Crunch for E-Powertrains
Lithium supply conditions limit the pace of electric adoption in the off-road vehicle market, even as electric models gain attention. The International Energy Agency stated that China accounted for more than 80% of global lithium-ion battery manufacturing nameplate capacity in 2026. It also reported that lithium prices at the start of 2026 were significantly higher than as of early-2025 levels. China introduced export controls in October 2025 on several battery-material categories, although the measures were paused for one year. Battery production costs in Europe and North America remained significantly higher than Chinese equivalents. Manufacturers that retain combustion options and diversify battery sourcing can reduce exposure while electric demand develops.
*Our forecasts treat driver/restraint impacts as directional, not additive. The impact forecasts reflect baseline growth, mix effects, and variable interactions.
Off-Road Vehicle Market Segment Analysis
By Vehicle Type:
UTVs Support Work and RecreationUtility Task Vehicles (UTVs) and Side-by-Sides accounted for 50.33% of off-road vehicle market revenue in 2025, making them the leading segment. Their passenger and cargo capacities support farming, defense transport, tourism, and family recreation. This versatility differentiates them from single-rider All-Terrain Vehicles (ATVs) and supports their 8.45% CAGR. In August 2025, BRP introduced the 2026 Can-Am Defender HD11 and Outlander Electric ATV, expanding work-oriented and electric options [4]“BRP Expands its Global Electric Powersports Offering with Launch of All-New 2026 Can-Am Outlander Electric,” BRP Inc., ir.brp.com. . ATVs serve recreational, agricultural, and youth-riding applications, while off-road motorcycles support motocross and enduro use.
UTVs and Side-by-Sides reflect broad utility demand beyond enthusiast applications. They transport passengers, equipment, and supplies across trails, fields, and work sites, supporting accessory demand for cabs, winches, storage, and towing equipment. Manufacturers prioritize durability, passenger comfort, cargo capacity, and traction. Enclosed cabs protect occupants and equipment during farm work, while the same layout allows recreational users to carry passengers.


By Application:
Defense Demand Adds Greater Revenue VisibilitySports and recreation accounted for 42.14% of application revenue in 2025, while military and law enforcement are projected to register the highest CAGR, 8.93%, through 2031. Recreation remains the largest application, covering trail riding, touring, sport use, and seasonal activities. Defense procurement follows formal specifications and contract schedules; Belgium’s July 2026 MRZR D4 order used a NATO procurement framework.
Agriculture, forestry, construction, tourism, and search-and-rescue users prioritize mobility, cargo, towing, passenger capacity, or access beyond vehicles. Buyers assess productivity, reliability, and maintenance support. Distinct replacement cycles diversify demand and support vehicle, accessory, parts, and services sales. Manufacturers can offer trims on platforms. Suppliers with fleet support can secure uptime-focused contracts, making work cycles and maintenance requirements central to product planning.
By Propulsion Type:
Combustion Retains the Largest Installed BaseInternal combustion engines accounted for 84.12% of off-road vehicle market propulsion revenue in 2025, supported by established refueling access, familiar servicing, and range in remote areas. Battery-electric vehicles are projected to register the fastest CAGR, at 9.41%, through 2031. BRP launched the 2026 Can-Am Outlander Electric, offering 47 hp, 53 lb-ft of torque, a 50-mile range, and 20% to 80% charging in 50 minutes.
BRP's modular electric system spans ATVs, motorcycles, and snowmobiles. The market will support both systems: electric models suit noise-sensitive, planned routes, while combustion vehicles remain preferable for extended work without charging. Hybrid and hydrogen remain early-stage options for remote work and rescue. Adoption depends on battery costs, charging, model availability, and dealer support; dual-powertrain portfolios broaden coverage.
By Engine Displacement:
Mid-Range Models Provide the Broadest BaseThe 400–800 cc category accounted for 45.03% of off-road vehicle market revenue in 2025, combining widely available models with practical power for trail riding and light agricultural work. The above-800 cc category is projected to record the highest CAGR, at 9.12%, through 2031, driven by demand for greater towing, payload, and performance capability. Tactical applications also require higher output for equipment and transport. Sub-400 cc models remain relevant for youth riders, entry-level buyers, and price-sensitive export markets.
Polaris expanded its 2026 family in July 2025, adding the RANGER 500 as an entry-level option alongside updated models. Such portfolios support trade-up activity, dealer relationships, shared components, parts availability, sales volume, and revenue as buyers' requirements evolve.
By Power Output:
Higher-Power Vehicles Gain BuyersThe 50–100 kW category accounted for 40.24% of 2025 off-road vehicle market revenue, balancing utility output and performance riding. Vehicles above 100 kW are projected to register the highest CAGR of 8.75% through 2031 for sport, towing, and load applications. The sub-50 kW category supports entry recreation, light agriculture, and cost-sensitive markets. Suitability depends on weight, drivetrain, seating, cargo capacity, and terrain.
Power bands match vehicles to operating conditions without placing buyers in premium categories. Mid-range models support farms, trails, and commercial sites; higher-output vehicles provide faster response, acceleration, and loaded capability. Manufacturers balance performance, safety, durability, and maintenance. Excessive power raises costs for light-duty users, while insufficient output limits towing, climbing, and payload performance. Clear positioning distinguishes utility from performance models.
By Drive Type:
AWD Becomes the Standard Utility ChoiceFour-wheel/all-wheel drive held 79.11% of off-road vehicle market revenue in 2025 and is projected to record the highest CAGR, 9.46%, through 2031. It leads drive types because all-wheel traction supports technical trails, muddy fields, soft ground, and tactical movement. Agricultural and defense customers often consider it essential, while recreational owners value confidence on uneven routes and in changing weather. Two-wheel-drive models remain relevant for sport ATVs and lighter vehicles, offering lower weight, simpler configurations, handling, and competitive pricing.
Broader adoption supports movement across terrain that changes with seasons and work tasks, while improving towing and cargo capacity. Scale reduces cost differences, allowing manufacturers to focus utility lines on traction, durability, and task capability. This versatility supports UTV and side-by-side demand.
By Seating Capacity:
Larger Cabins Expand ParticipationTwo-rider configurations accounted for 52.33% of off-road vehicle market revenue in 2025. Vehicles with more than three passenger seats are projected to register the highest CAGR of 9.65% through 2031. Larger cabins support families, commercial tour operators, and field teams traveling together. BRP offers standard three-seat and MAX six-seat variants across its 2026 Can-Am Defender lineup. Single-rider vehicles remain relevant for sport ATV riding and competitive dirt racing, where lighter vehicles and direct control matter.
The expansion of larger formats reflects demand for shared travel and group work. Tour operators, farms, and teams can move more people and equipment together; families can ride together. Manufacturers must preserve payload, handling, comfort, storage, safety, and service access as cabin size increases.
Geography Analysis
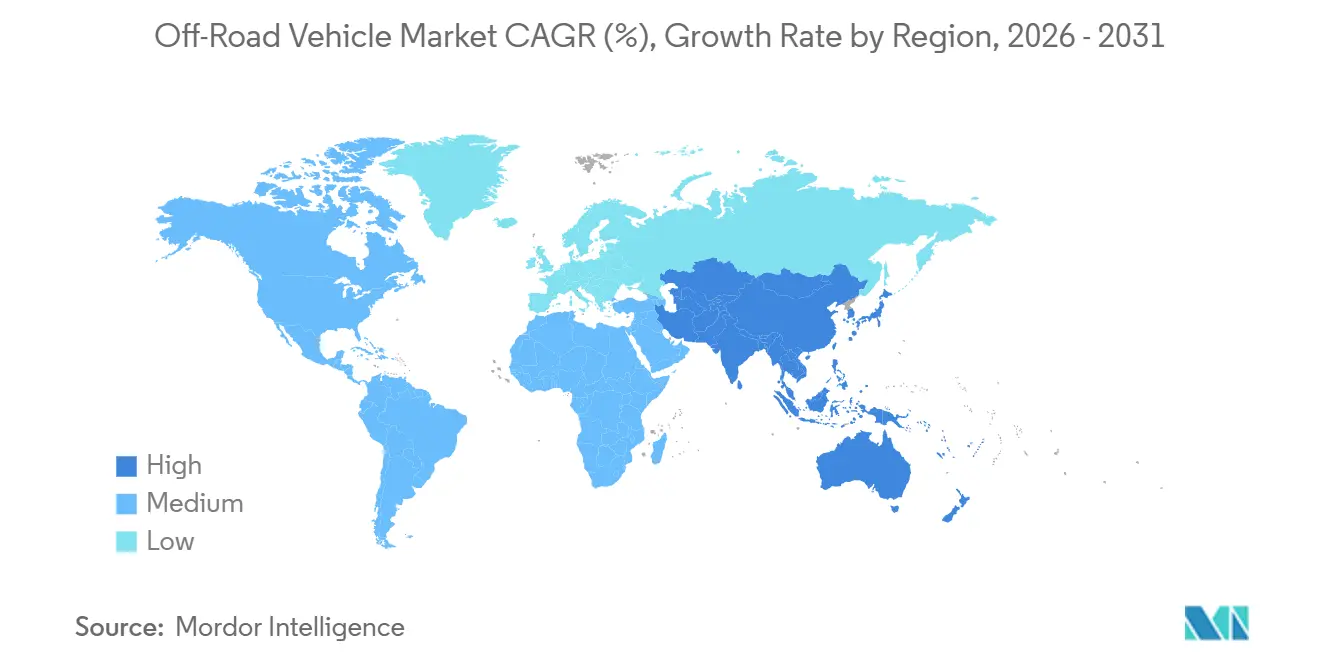
North America accounted for 39.17% of off-road vehicle market revenue in 2025, making it the largest regional market. Mature trail culture, defense procurement, agriculture, and dealer networks support demand. Canada strengthened trail support through Northern Ontario funding in February 2025, while British Columbia committed funding for multiple trail projects in 2026. Dealer support for servicing, accessories, financing, maintenance, and used vehicles creates entry barriers for newer international brands and reinforces the region's role in volume sales and product development.
Asia-Pacific is projected to record the highest regional CAGR of 9.22% through 2031. Agriculture, recreation, and powersports drive demand. China, India, and Southeast Asia offer first-time buyer and utility opportunities, while Japan's agricultural terrain and aging rural workforce support lower-fatigue mobility equipment. Australia contributes recreational riding and commercial fleet demand. However, distribution quality, regulations, financing access, and country-specific preferences require locally tailored vehicle specifications and distribution strategies.
Europe, South America, and the Middle East and Africa have distinct drivers. Europe's approval requirements favor compliant portfolios. South American demand centers on agriculture in Brazil, while Argentina combines adventure tourism and farm mobility. Desert tourism, defense, mining, remote transport, and land-use rules shape Middle Eastern and African demand. Specialized configurations, local dealers, parts availability, and simple remote servicing remain critical.

Competitive Landscape
The off-road vehicle market is moderately concentrated, led by established North American brands, including Polaris, BRP, Yamaha, Honda, and Textron. These companies benefit from extensive dealer networks, established product portfolios, and service capabilities. Polaris secured the U.S. Marine Corps MRZR Alpha contract in May 2026, strengthening its tactical vehicle position. BRP launched the 2026 Can-Am Defender HD11 and Outlander Electric in August 2025, advancing utility vehicle renewal and electric product development. Technology, parts availability, and dealer quality remain critical competitive factors.
Electric vehicles offer opportunities in noise-restricted settings, including filming and managed-site applications. Polaris has described a RANGER EV deployment supporting professional camera work. Multi-seat models can serve tourism operators and families seeking shared trail access, while agriculture-ready platforms can incorporate cargo systems, guidance compatibility, and connected maintenance support. These opportunities complement, rather than replace, combustion-powered platforms by enabling suppliers to adapt common vehicle architectures to specific operating needs. Success depends on aligning product features with credible dealer and service support.
Established manufacturers compete through product breadth, dealer expansion, and technology. Price alone does not determine competitive standing; service, compliance, reliability, and application coverage also matter. New entrants require trained dealers, clear warranties, timely parts, and local service to secure repeat sales from commercial, public-sector, and agricultural users.
Off-Road Vehicle Industry Leaders
Textron Inc. (Arctic Cat)
Bombardier Recreational Products Inc. (Can-Am)
Honda Motor Co. Ltd.
Polaris Inc.
Yamaha Motor Co., Ltd.
- *Disclaimer: Major Players sorted in no particular order
Off-Road Vehicle Market Companies Covered in this Report
- Polaris Inc.
- Bombardier Recreational Products Inc. (Can-Am)
- Yamaha Motor Co., Ltd.
- Textron Inc. (Arctic Cat)
- Kawasaki Heavy Industries Ltd.
- Suzuki Motor Corp.
- Honda Motor Co. Ltd.
- CFMOTO Powersports Inc.
- Kwang Yang Motor Co. Ltd. (Kymco)
- American LandMaster
- Tracker Off-Road (Bass Pro Shops)
- Kubota Corp. (RTV)
- John Deere (Gator)
- Mahindra & Mahindra Ltd.
- Segway Powersports
- Hisun Motors Corp.
- Linhai Group
- TGB (Taiwan Golden Bee)
- DRR USA

Recent Industry Developments in Off-Road Vehicle Market
- July 2026: Polaris Government and Defense secured a USD 10.6 million order from Belgium's Ministry of Defence for MRZR D4 tactical vehicles through the NATO NSPA framework contract — the first call order under a framework first awarded in September 2025 — enabling streamlined allied procurement without duplicative national trials.
- June 2026: CFMOTO unveiled its fourth-generation CFORCE ATV lineup, including the C4, C5, and C6 Pro, at a global event in Nice, France. The launch marked a ground-up redesign of its core 400–700 cc platforms and signaled the company’s accelerated expansion across Europe and international markets.
- May 2026: The U.S. Marine Corps awarded Polaris a sole-source IDIQ contract valued at up to USD 98 million for up to five years for MRZR Alpha production, including a new 5 kW exportable-power variant supporting tactical edge computing and counter-drone applications.
- April 2026: CFMOTO USA launched the 2026 ZFORCE Z10 and Z10-4 sport side-by-sides, priced at USD 19,999 and USD 22,999, respectively. The launch marked the company’s entry into the performance SxS segment through its network of more than 700 U.S. dealers, with initial shipments targeted for late spring to summer 2026.


Off-Road Vehicle Market Report Scope and Research Methodology
Market Definition and Coverage
For this methodology, the off-road vehicle market includes purpose-built motorized vehicles designed to operate away from paved roads, and it is sized as the value of new vehicle sales across key global regions.
Scope exclusions: It excludes regular on-road passenger vehicles, farm tractors, and heavy construction or mining machines that are not sold as off-road recreational or utility vehicles.
Segments Covered in This Report
- By Vehicle Type
- All-Terrain Vehicles (ATV)
- Utility Task Vehicles (UTV) / Side-by-Sides
- Dirt / Off-road Motorcycles
- Snowmobiles
- Amphibious and Specialty ORVs
- By Application
- Sports and Recreation
- Agriculture and Forestry
- Industrial and Construction
- Military and Law-Enforcement
- Other Commercial (tourism, search-and-rescue)
- By Propulsion Type
- Internal-Combustion (Gasoline / Diesel)
- Hybrid
- Battery-Electric
- Hydrogen Fuel-Cell
- By Engine Displacement
- Less than 400 cc
- 400-800 cc
- More than 800 cc
- By Power Output
- Less than 50 kW
- 50-100 kW
- More than 100 kW
- By Drive Type
- 2-Wheel Drive
- 4-Wheel / All-Wheel Drive
- By Seating Capacity
- 1 Rider
- 2 Riders
- More than or equal to 3 Passengers
- By Geography
- North America
- United States
- Canada
- Rest of North America
- South America
- Brazil
- Argentina
- Rest of South America
- Europe
- Germany
- France
- United Kingdom
- Italy
- Spain
- Russia
- Rest of Europe
- Asia-Pacific
- China
- Japan
- India
- South Korea
- Australia
- Rest of Asia-Pacific
- Middle East and Africa
- United Arab Emirates
- Saudi Arabia
- Turkey
- Egypt
- South Africa
- Rest of Middle East and Africa
- North America
Data Sources, Market Sizing, and Validation
Desk Research
Desk research is used to build the initial structure of the model and set realistic demand and supply signals that can be checked later. We review public statistics and technical references such as US Census Bureau manufacturing and trade data, UN Comtrade import and export series, US Bureau of Labor Statistics inflation indices, and International Energy Agency updates on alternative powertrains.
Along with these, sources such as company annual reports, investor presentations, regulator and safety agency publications, and powersports association releases help us understand product mix and pricing direction. When needed, paid subscriptions for company financials and intelligence, shipment-level import and export records, and patent databases are used to cross-check product activity and where production is shifting. These sources are not exhaustive, and additional public documents were used for data collection, validation, and clarification.
Primary Interviews and Surveys
Primary work is used to confirm what is actually being purchased and at what price points, particularly when the market includes ATVs, UTVs (side-by-sides), off-road motorcycles, snowmobiles, and specialty formats. We speak with a mix of manufacturers, distributors, dealers, fleet buyers, and service ecosystem participants across APAC, EMEA, and the Americas. The respondent input is used to validate penetration assumptions, track product mix shifts, and check near-term demand changes.
Distribution of primary research fieldwork respondents
| Company type | Respondent position | Region |
|---|---|---|
| Top tier: 35% | CXOs: 14% | APAC: 41% |
| Mid tier: 43% | Functional/Unit leaders: 31% | EMEA: 36% |
| Smaller Players: 22% | Managers: 55% | Americas: 23% |
Market-Sizing & Forecasting
Sizing starts with a top-down reconstruction that links vehicle demand to powersports participation and replacement cycles, supported by production and trade flows where those signals are visible in public series. The totals are then checked using selective bottom-up approximations, such as sampled model-level pricing multiplied by estimated unit volumes from channel checks, plus dealer feedback on mix shifts.
The model is guided by practical inputs like ATV versus UTV mix, average selling price movement by engine size bands, and the share of 4-wheel or all-wheel drive in working use cases. We also track seating configuration trends for side-by-sides and the adoption pace for electric and hybrid variants across recreation and utility settings. For forecasting, scenario analysis is used so demand can be tested under different assumptions on discretionary spending, interest rate sensitivity for financed purchases, and policy support for low-emission powertrains. When some countries lack consistent unit or trade indicators, we handle gaps through proxy markets with similar income levels and usage patterns, and then re-check results during interviews before finalizing.
Data Validation & Update Cycle
Validation is done through repeated cross-checks between the model output and independent market signals, including trade direction, inflation-adjusted pricing, and changes in product launches that can shift mix. If a region shows an unusual jump, we review currency effects, one-time stocking behavior, and potential assumption errors, then correct after a second analyst review.
We refresh the study annually. Interim updates are triggered when a material event changes the demand or supply outlook (for example, a policy change affecting powertrains or a sudden pricing swing). Before delivery, the latest public releases are re-checked and a final pass is completed so clients receive a current view aligned with the stated scope and assumptions.
Mordor Intelligence's Off Road Vehicle Market Size Measured Against Other Published Estimates
Published market sizes for off-road vehicles do not always line up because the scope and the year being used as the base can change from one source to the next. Differences also come from how pricing is treated, how vehicle types are grouped together, and how frequently assumptions are refreshed when demand signals shift.
Some estimates focus only on ATV and side-by-side units, or they emphasize a narrower use case like recreation and leave out several specialty formats. The spread also widens when an aggressive price progression is assumed across the forecast, or when currency conversion uses a single-year rate without checking inflation and mix changes.
Benchmark comparison
| Source | Market Size | Gaps in Research Methodology |
|---|---|---|
| Mordor Intelligence | USD 24.33 B (2026) | |
| Industry Publisher A | USD 23.60 B (2025) | Uses a different base year and a product set that is commonly summarized around ATV, UTV, snowmobile, and off-road motorcycle categories, which can shift totals when specialty ORVs and configuration splits are not carried through the sizing. |
| Industry Publisher B | USD 12.10 B (2025) | Limits coverage to ATV and side-by-side formats, which leaves out other off-road vehicle classes that add meaningful value in regions with strong motorcycle and snowmobile usage. |
The table shows that year selection and category coverage are the biggest drivers of the gap, and pricing and mix assumptions usually explain most of what remains. Some published totals stop at ATVs and side-by-sides, and Mordor Intelligence counts off-road motorcycles, snowmobiles, and specialty ORVs only when they meet the same off-road use intent and new-vehicle sales definition used across regions.


Key Questions Answered in the Report
What is the 2026 value of the off-road vehicle sector?
The sector was valued at USD 24.33 billion in 2026 and is forecast to reach USD 36.25 billion by 2031 at an 8.30% CAGR. The forecast reflects demand from recreation, utility work, agriculture, and defense procurement.
Which vehicle category led revenue in 2025?
Utility Task Vehicles and Side-by-Sides led with 50.33% of 2025 revenue because they serve work, defense, and recreation needs. Their multi-passenger and cargo capabilities make the format useful across several buyer groups.
Which propulsion system is growing most quickly?
Battery-electric vehicles had the highest projected CAGR at 9.41% through 2031, while combustion engines still held 84.12% of 2025 revenue. Electric models can serve quieter, shorter-route uses, while combustion remains important where refueling access is limited.
Which region is growing fastest through 2031?
Asia-Pacific recorded the highest projected regional CAGR at 9.22%, supported by agriculture, recreation, and first-time adoption. Demand differs across national markets because farm use, consumer spending, regulation, and dealer coverage vary widely.
Page last updated on:


 Your data is secure and never sold or shared.


