
Occupant Classification Systems Market Size and Share
Market Overview
| Study Period | 2020 - 2031 |
|---|---|
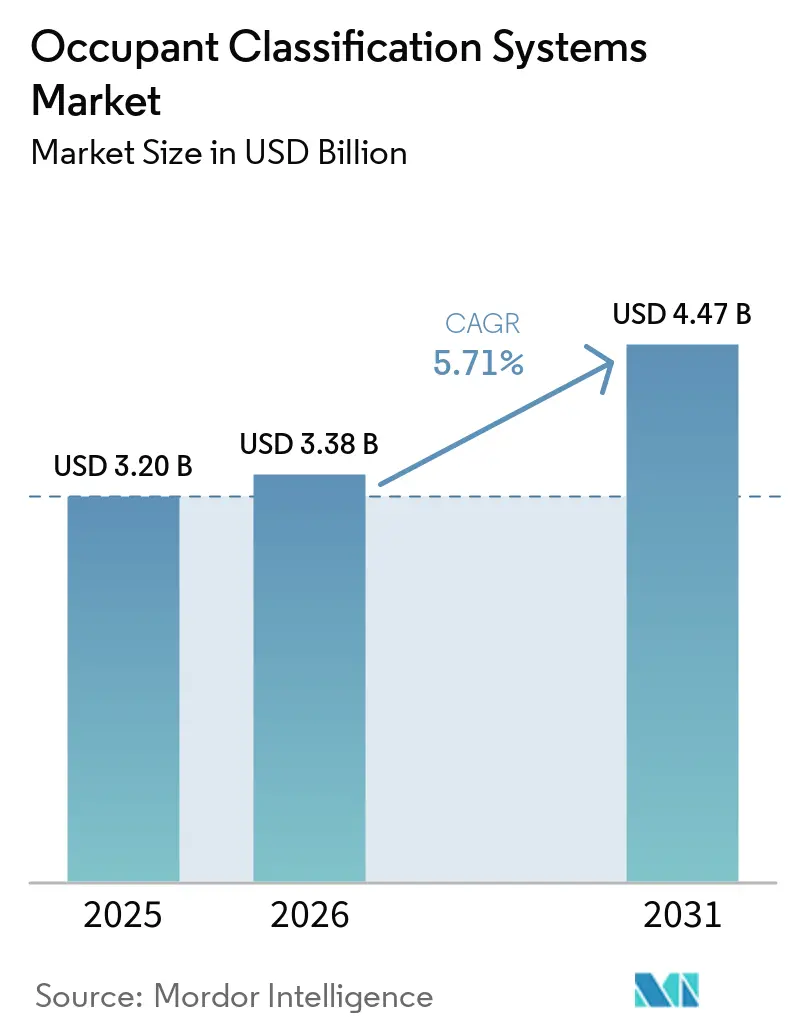
| Market Size (2026) | USD 3.38 Billion |
| Market Size (2031) | USD 4.47 Billion |
| Growth Rate (2026 - 2031) | 5.71 % |
| Fastest Growing Market | South America |
| Largest Market | Asia Pacific |
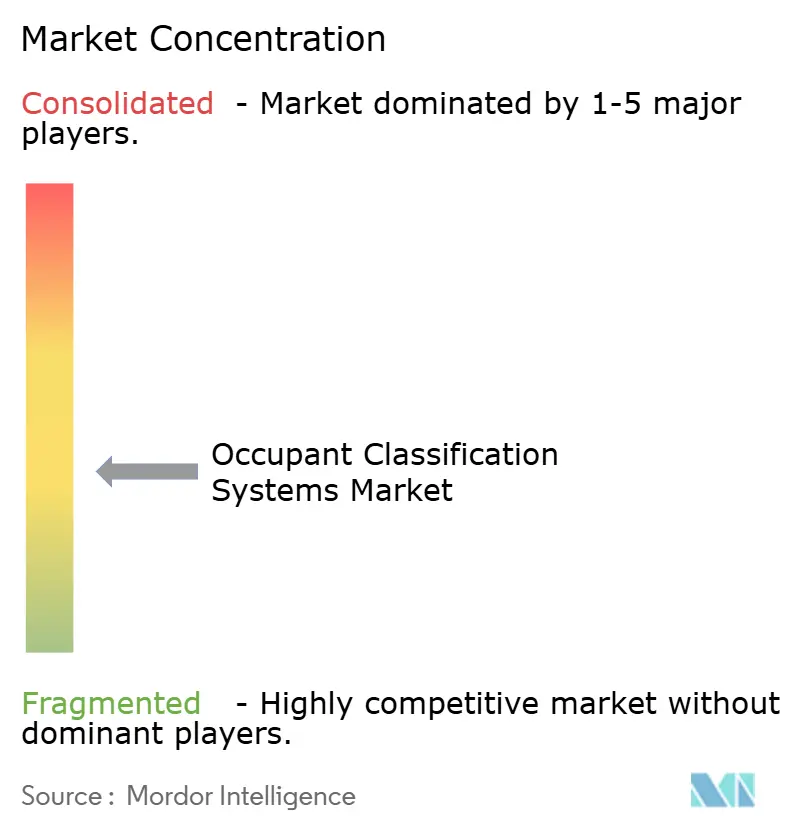
| Market Concentration | Medium |
Major Players *Disclaimer: Major Players sorted in no particular order Image © Mordor Intelligence. Reuse requires attribution under CC BY 4.0. | |
Occupant Classification Systems Market Analysis by Mordor Intelligence
The occupant classification systems market size was valued at USD 3.2 billion in 2025 and estimated to grow from USD 3.38 billion in 2026 to reach USD 4.47 billion by 2031, at a CAGR of 5.71% during the forecast period (2026-2031). Demand is accelerating as Euro NCAP’s 2026 protocol and China’s GB 15083-2024 rule tighten requirements for real-time occupant detection, prompting automakers to embed more sophisticated sensing arrays. Suppliers are also benefiting from the migration to software-defined vehicles that support over-the-air safety updates, reducing recall costs while extending system life cycles. Asia-Pacific holds a clear lead because its radar module supply chain enables low-cost integration, while South America records the fastest growth as regional regulators mirror global safety norms. Competitive intensity is rising as Tier 1 suppliers add mmWave radar and AI-enabled domain controllers to established air-bag expertise, aiming to secure long-term platform awards with global OEMs.
Key Report Takeaways
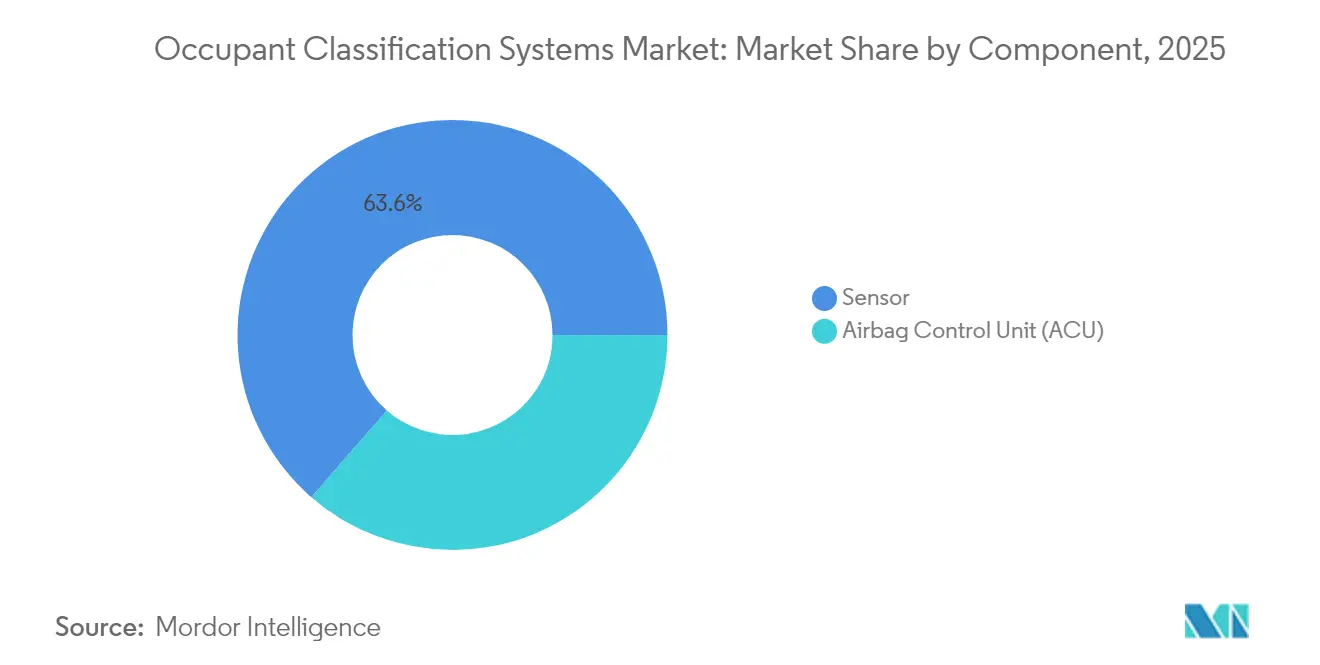
- By component, sensors led with 63.60% revenue share in 2025; airbag control units are expanding at an 8.18% CAGR through 2031.
- By sensor type, pressure sensors held 47.30% of the occupant classification systems market share in 2025, while radar sensors are projected to post a 12.21% CAGR to 2031.
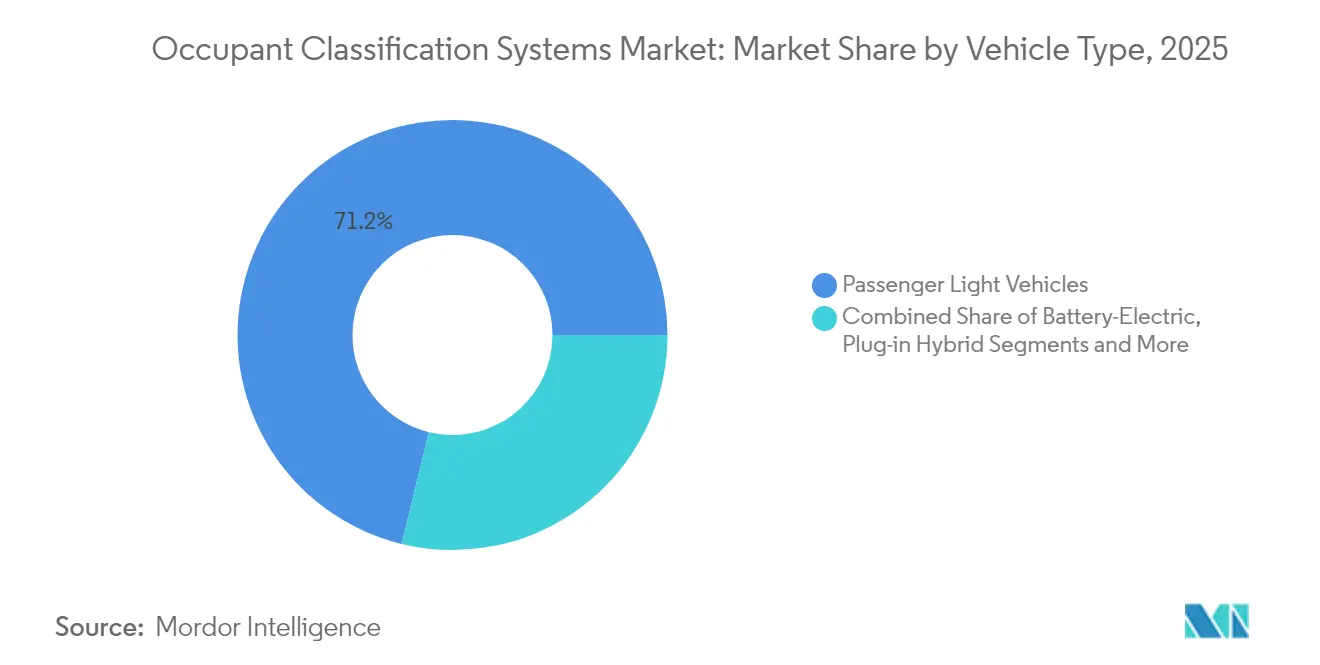
- By vehicle type, passenger light vehicles commanded 71.20% share of the occupant classification systems market size in 2025; battery-electric vehicles are progressing at a 9.94% CAGR to 2031.
- By sales channel, OEM-fitted solutions accounted for 57.30% of the occupant classification systems market in 2025, whereas aftermarket kits exhibit the fastest CAGR at 9.76% through 2031.
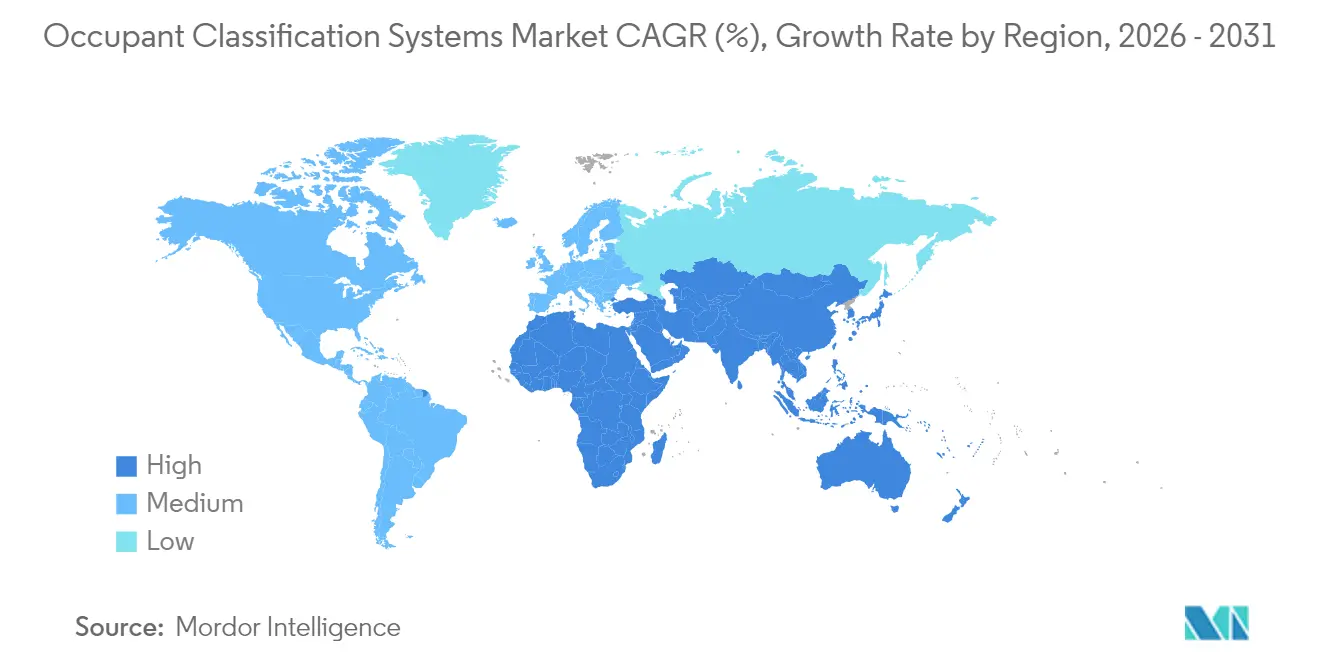
- By geography, Asia-Pacific dominated with a 30.60% share in 2025; South America is poised for an 8.48% CAGR by 2031.
Note: Market size and forecast figures in this report are generated using Mordor Intelligence’s proprietary estimation framework, updated with the latest available data and insights as of 2026.
Market Trends and Insights
Drivers Impact Analysis of Occupant Classification Systems Market*
| DRIVER | (~) % IMPACT ON CAGR FORECAST | GEOGRAPHIC RELEVANCE | IMPACT TIMELINE |
|---|---|---|---|
| Emergence of Low-cost mmWave Radar Modules for In-Cabin Sensing (Asia) | +1.2% | Asia-Pacific, with spillover to North America | Medium term (2-4 years) |
| NCAP 2026 Mandate on Rear-Seat Belt Reminders (US & EU) | +0.9% | North America & EU, with adoption in emerging markets | Short term (≤ 2 years) |
| Rapid Uptake of Smart Curtain-Airbag Architectures in SUVs | +0.7% | Global, with concentration in premium SUV segments | Medium term (2-4 years) |
| Battery-Electric Vehicle (BEV) Skateboard Floors Freeing Space for Embedded OCS | +0.8% | Global, led by China and Europe | Long term (≥ 4 years) |
| China's GB 15083-2024 Crash-Safety Rule Adding Dynamic Weight-Sensing | +0.6% | China, with regulatory spillover to ASEAN | Short term (≤ 2 years) |
| Automaker Shift to Software-Defined Vehicles Enabling Over-the-Air OCS Updates | +0.5% | Global, concentrated in premium segments initially | Long term (≥ 4 years) |
| Source: Mordor Intelligence | |||
Emergence of low-cost mmWave radar modules
Sixty-gigahertz and 77 GHz chips such as Infineon’s BGT60ATR24C now ship at consumer-grade price points, allowing radar to replace weight mats even in sub-USD 25,000 vehicles. These solid-state devices classify adults, children and empty seats under all lighting and temperature conditions, reducing warranty claims linked to foam hysteresis. Asian OEMs rapidly embed the technology to meet China’s new dynamic weight-sensing rule and to standardize platforms for export markets.[1]Infineon Technologies, “BGT60ATR24C XENSIV Radar MMIC Detects In-Vehicle Occupancy,” infineon.com
NCAP 2026 mandate on rear-seat belt reminders
Euro NCAP and NHTSA now require detection of occupied rear seats combined with audiovisual warnings if belts stay unfastened, compelling automakers to deploy multi-sensor arrays that distinguish toddlers, child seats and luggage. Volume deployment boosts economies of scale for radar and capacitive solutions, lowering per-vehicle system cost by up to 18% based on supplier quotations.
BEV skateboard floors freeing sensor space
Flat battery packs open cabin volume that engineers use for distributed sensor placement, enabling floor-integrated pressure cells and seat-frame radar without comfort trade-offs. Zonal 48 V wiring trims harness weight by 85%, creating headroom for additional occupant-monitoring endpoints.
Shift to software-defined vehicles enabling OTA updates
Central domain controllers now push certified algorithm updates over secure channels, eliminating dealer-based ECU reflashes and enabling quick calibration for demographic diversity. The model aligns with OEM efforts to monetize post-sale features, turning occupant classification performance into an upgradable asset rather than a fixed-point specification.
Restraints Impact Analysis of Occupant Classification Systems Market*
| RESTRAINTS | (~) % IMPACT ON CAGR FORECAST | GEOGRAPHIC RELEVANCE | IMPACT TIMELINE |
|---|---|---|---|
| Seat-Foam Hysteresis Causing Calibration Drift in Weight Sensors | -0.8% | Global, particularly affecting cost-sensitive segments | Medium term (2-4 years) |
| High-GHz Radar Interference with 5G Modules inside EV Cabins | -0.6% | Global, concentrated in premium EV segments | Short term (≤ 2 years) |
| Tariff-Driven Cost Inflation on MEMS Pressure Cells (US-China) | -0.4% | North America, with spillover to global supply chains | Short term (≤ 2 years) |
| Consumer Privacy Concerns over Camera-based Occupancy Analytics | -0.3% | North America & EU, with emerging concerns in Asia | Long term (≥ 4 years) |
| Source: Mordor Intelligence | |||
Seat-foam hysteresis causing calibration drift
Hyper-elastic foams deform over time and temperature, shifting baseline weight-sensor output and prompting costly recalibration. A 2022 MDPI study confirmed drift can exceed 6 kg within two years, enough to misclassify small adults as children, forcing migration to radar or advanced packaging structures.
High-GHz radar interference with 5G modules
When multiple 76-77 GHz sensors operate inside quiet EV cabins, overlap with 71-76 GHz telecom bands can raise packet-error rates and corrupt occupancy data streams, particularly in multi-row SUVs. Mitigation requires adaptive waveform management and EMC shielding, adding between USD 4 and USD 7 in bill-of-material cost per vehicle according to Tier 1 quotations.[2]IOPscience, “Compatibility Studies of IMT System and Automotive Radar,” iop.org
*Our forecasts treat driver/restraint impacts as directional, not additive. The impact forecasts reflect baseline growth, mix effects, and variable interactions.
Occupant Classification Systems Market Segment Analysis
By Component:
Sensors anchor system valueSensors captured 63.60% of 2025 revenue as OEMs relied on multi-modal arrays to fulfill global safety norms. Pressure, capacitive and radar elements together generate the real-time data that air-bag logics demand. Most value accrues to suppliers that can combine hardware stacks with embedded diagnostics to meet ASIL D targets. The airbag control-unit segment is rising at 8.18% CAGR because domain controllers now fuse occupant data with crash algorithms in a single box, trimming harness length and assembly time.
Continental’s ACU Premium platform consolidates restraint logic, enabling OTA calibrations that cut warranty costs by 22% over the vehicle life cycle. Veoneer’s SC3 controller ships in one-fourth of new cars worldwide, reflecting OEM confidence in integrated safety silicon. These examples illustrate how software capability is capturing margin once held solely by discrete sensors within the occupant classification systems market.


By Sensor Type:
Radar outpaces legacy matsPressure mats retained a 47.30% share in 2025 thanks to low unit cost; yet mmWave radar now posts a 12.21% CAGR as OEMs seek calibration-free accuracy. Capacitive grids address premium interiors where touch surfaces double as HMI, and ultrasonic devices serve compact cabins but face acoustic interference. Dual-mode pressure-plus-radar kits are emerging as a mid-cost vehicle occupancy detection system solution that leverages existing seat architecture while adding child-presence detection for NCAP scoring.
When comparing lifetime cost, suppliers estimate radar modules lower warranty provisioning by 30% through immunity to foam drift. This risk-reduction advantage underpins radar’s swift share gains within the occupant classification systems market size for new platforms entering production from 2027 onward.
By Vehicle Type:
Electrification sets the pacePassenger light vehicles represented 71.20% of shipments in 2025; still, battery-electric vehicles grow the fastest at 9.94% CAGR through 2031. Skateboard chassis enable flush-mounted floor sensors, and low-noise cabins highlight the comfort benefits of silent solid-state radar. Plug-in hybrids adopt similar architectures but remain transitional. Commercial vans and light trucks increasingly retrofit occupancy kits to satisfy fleet insurance mandates, opening incremental revenue for sensor suppliers.
Tesla’s 2024 decision to add cabin radar demonstrates how BEVs can leapfrog weight mats and set new baselines for global homologation. As electrification spreads, these design freedoms will extend across mainstream segments, reinforcing radar’s trajectory inside the occupant classification systems market.
By Sales Channel:
Retrofit demand acceleratesOEM installations dominated with 57.30% share in 2025; nonetheless, aftermarket kits expand at 9.76% CAGR. Fleet operators retrofit older buses and vans to reduce liability, while consumer demand rises where new-car prices outpace income. Standardized CAN and LIN gateways simplify installation, and printed flexible pressure sensors let installers slide mats beneath existing upholstery without seat teardown, a factor that broadens reach in emerging economies.
IDTechEx projects printed-sensor revenue to approach USD 1 billion within the decade on strong retrofit take-up. As feature-on-demand models gain traction, retrofit channels will serve as test beds for software-enabled safety services across the occupant classification systems industry.
Geography Analysis
APAC Occupant Classification Systems Market
Asia-Pacific commanded 30.60% of 2025 revenue, driven by China’s dynamic weight-sensing regulation and a deep radar supply chain that compresses component costs. Domestic OEMs already represent 40% of Autoliv’s Chinese sales, evidencing local appetite for advanced restraint technologies. Japan pushes driver-condition monitoring for Level-3 autonomy, and South Korea’s EV incentives stimulate radar adoption, creating a robust regional ecosystem around the occupant classification systems market.
North America and Europe Occupant Classification Systems Market
North America and Europe set the regulatory tone. Euro NCAP 2026 and NHTSA’s FMVSS 208 revisions harmonize rear-seat alerts and thus standardize sensor specifications. The EU General Safety Regulation II, live since July 2024, bundles occupant detection with drowsiness alarms, driving multi-sensor rollouts. Privacy-minded consumers in both regions prefer radar over camera analytics, shaping supplier roadmaps and reinforcing demand for non-visual sensing within the occupant classification systems market size.
South America and MEA Occupant Classification Systems Market
South America marks the fastest trajectory at 8.48% CAGR, as Brazil and Argentina upgrade safety standards and court OEM investment. Argentina’s 2025 traffic law now references autonomous functions, indirectly encouraging occupant-monitoring integration. While price sensitivity limits camera use, flexible pressure sensors and simplified radar bring compliant packages into mid-range models, widening addressable volume. Middle East and Africa remain nascent, but fleet retrofits in the Gulf leverage aftermarket kits to satisfy insurance discounts, indicating gradual diffusion across the global occupant classification systems market.

Regulatory Landscape
Occupant classification systems (OCS) remain closely tied to mandated occupant crash-protection requirements and the associated airbag suppression and enablement logic. In the United States, NHTSA-administered FMVSS 208 (49 CFR 571.208) specifies advanced airbag and occupant protection performance, and relies on occupant detection and classification outcomes to manage front passenger airbag deployment. An August 2024 final rule updated the child restraint systems list used for compliance testing.
Across Europe and for global homologation alignment, UNECE Regulation No. 145 sets requirements around ISOFIX anchorage systems and related seating positions, which affects child-seat detection and the seating-position assumptions used in OCS validation. On the consumer-safety assessment side, Euro NCAP guidance such as SD 103 (Occupant Stature Classification Dossier Guidance) formalizes documentation and test expectations for occupant stature classification performance, reinforcing the need for robust multi-sensor occupant detection approaches as protocols tighten into 2026.
Value Chain Analysis
The OCS value chain runs from semiconductor and materials inputs (MEMS pressure cells, radar MMICs, and camera and compute components) to sensor and sub-assembly manufacturing (pressure, capacitive, strain or weight, ultrasonic, radar, and camera modules). Tier 1 integration then connects these sensing elements into seat systems and restraint electronics, where suppliers typically provide the sensor-and-software bundle that feeds the airbag control unit (ACU) or centralized vehicle compute. OEMs validate the integrated system against regulatory and consumer-test requirements, including FMVSS 208 compliance and Euro NCAP dossier expectations.
Value capture is shifting toward software, sensor fusion, and ECU or domain-controller integration as architectures move from discrete weight-mat logic to software-defined implementations that share cabin sensing assets. Standards and compliance artifacts, including ISO/TS 22239-1:2018 for child seat presence and orientation detection and Euro NCAP SD 103 dossiers, shape supplier selection, test tooling, and validation workloads. At the same time, foundry capacity and single-sourcing risks around MEMS and automotive-grade silicon can affect lead times and cost stability for high-volume programs.
Competitive Landscape
Tier 1 suppliers such as Autoliv, Continental, and ZF claim scale advantages from decades of air-bag engineering yet now pivot toward radar and AI software. Continental’s April 2025 launch of the Aumovio brand ahead of its automotive IPO packages sensor fusion, domain control and cybersecurity in a single stack, targeting the occupant classification systems market’s new software value pools. ZF is carving out its LIFETEC passive-safety arm to sharpen focus on high-growth radar occupant detection, acknowledging investor demand for pure-play safety assets.
Automakers also file patents to own core algorithms: a January 2024 U.S. application from Tesla combines weight sensors with radar presence checks to refine air-bag logic. Start-ups pitch data-centric tools; Anyverse trains occupant models on synthetic datasets to sidestep privacy hurdles, courting OEMs that fear regulatory fines. Component consolidation is visible as chip vendors bundle radar front-ends with on-chip AI accelerators, shortening development cycles for Tier 1 integrators.
Strategic moves underscore convergence. Volvo and ZF jointly unveiled adaptive belts that tighten based on real-time occupant mass, blending restraint hardware with sensor feedback. Autoliv partnered with Formula E to showcase electric-vehicle safety tech, elevating brand equity while harvesting track telemetry for algorithm refinement. These initiatives reveal how product leadership now hinges on software extensibility as much as mechanical reliability inside the occupant classification systems market.
Occupant Classification Systems Industry Leaders
ZF Group
Continental AG
Robert Bosch GmbH
Autoliv Inc.
Denso Corporation
- *Disclaimer: Major Players sorted in no particular order
Occupant Classification Systems Market Companies Covered in this Report
- ZF Group
- Continental AG
- Robert Bosch GmbH
- Autoliv Inc.
- Denso Corporation
- Aptiv PLC
- Aisin Seiki Co. Ltd
- IEE Sensing
- TE Connectivity Ltd
- ON Semiconductor Corp.
- Joyson Safety Systems
- Infineon Technologies AG
- Veoneer AB
- Murata Manufacturing Co., Ltd
- Lear Corporation
- Hyundai Mobis
- NXP Semiconductors N.V.
- STMicroelectronics N.V.
- Visteon Corporation
- Flexpoint Sensor Systems Inc.

Market Opportunities and Future Outlook
A key whitespace is functional consolidation, using the same in-cabin sensing stack to cover occupant classification, seatbelt-related features, and broader occupant monitoring without adding seat-integrated hardware. Aptiv's June 2026 launch of Advanced Occupancy Classification (AOC) supports this direction, positioning it as a camera-only occupant detection system that uses AI and computer vision to classify occupants by height, weight, and position, and shifting OCS value toward software-centric perception running on existing cockpit camera infrastructure.
Regulatory and test updates are also creating opportunities for upgradable, validation-friendly sensing approaches. In the United States, the August 2024 amendment to FMVSS 208 updated the child restraint systems list used for compliance testing of advanced airbag suppression systems, increasing the need for classification robustness across varied CRS configurations. Euro NCAP SD 103 dossier guidance formalizes how occupant stature classification performance is evidenced, supporting demand for suppliers that can provide traceable algorithms, repeatable test results, and integrated documentation alongside the sensing hardware.
Recent Industry Developments in Occupant Classification Systems Market
- June 2026: Aptiv introduced Advanced Occupancy Classification (AOC), positioned as a camera-only occupant detection system that uses AI and computer vision to classify occupants. The approach targets consolidation of occupant classification into the digital cockpit camera stack, reducing reliance on seat-integrated sensing hardware and shifting differentiation toward software and perception performance.
- October 2025: Adient and Autoliv announced a partnership to commercialize Z-Guard safety solutions for reclined seating positions, integrating Adient seat concepts with Autoliv restraint technologies. The collaboration addresses occupant classification and protection challenges created by more flexible seating postures and supports platform-level development work with OEM seat and safety decision makers.
- December 2024: Continental announced a biometric in-cabin monitoring solution with trinamiX to capture vital signals for in-cabin applications. Bringing biometric signals into the cabin sensing stack expands the data available for occupant-related safety decisions and reinforces integrated, software-defined occupant monitoring architectures.


Occupant Classification Systems Market Report Scope and Research Methodology
Market Definition and Coverage
For this methodology, the market includes occupant classification systems used in vehicles to detect occupant presence, position, and characteristics, so restraint and safety functions can be triggered correctly at the seat level.
Scope exclusions: This sizing excludes building occupancy sensors and people-counting solutions that are not designed for in-vehicle safety and restraint decisions.
Segments Covered in This Report
- By Component
- Airbag Control Unit (ACU)
- Sensors
- By Sensor Type
- Pressure Sensors
- Seat-belt Tension Sensors
- Strain-Gauge Mat Sensors
- Capacitive Sensors
- Ultrasonic Sensors
- 60 GHz and 77 GHz Radar Sensors
- By Vehicle Type
- Passenger Light Vehicles
- Battery-Electric Vehicles
- Plug-in Hybrid Vehicles
- Commercial Light Trucks and Vans
- By Sales Channel
- OEM-Fitted Systems
- Aftermarket and Retrofit Kits
- By Geography
- North America
- United States
- Canada
- Mexico
- Europe
- United Kingdom
- Germany
- France
- Italy
- Rest of Europe
- Asia-Pacific
- China
- Japan
- India
- South Korea
- Rest of Asia-Pacific
- Middle East
- Israel
- Saudi Arabia
- United Arab Emirates
- Turkey
- Rest of Middle East
- Africa
- South Africa
- Egypt
- Rest of Africa
- South America
- Brazil
- Argentina
- Rest of South America
- North America
Data Sources, Market Sizing, and Validation
Desk Research
Desk work starts with public automotive production and parc context, since occupant classification systems demand is tied to vehicle builds and safety feature fitment. We reference sources such as OICA vehicle production statistics, U.S. DOT and NHTSA rulemaking and recall databases, UNECE vehicle safety regulation texts, and Euro NCAP protocol publications to understand what gets required and when.
Next, the model inputs are tightened using public disclosures and technical evidence. Items like OEM and supplier annual reports, investor presentations, association updates such as from SAE International, peer reviewed papers indexed in sources such as NCBI, and reputable automotive press are reviewed to map adoption trends, sensor preferences, and pricing direction. Where needed, paid subscriptions for company financials and intelligence, news and financials, patent databases, and select automotive sales and vehicle parc datasets are used to fill gaps in coverage and cross-check timelines. The sources listed here are illustrative only, and many other public documents and data points were also used for collection, validation, and clarification.
Primary Interviews and Surveys
Primary work focuses on confirming what is actually being shipped, how systems are packaged in new platforms, and how pricing shifts with sensor count and software content. We speak with a mix of vehicle safety stakeholders, component suppliers, integration partners, and downstream users, and we keep coverage spread across APAC, EMEA, and the Americas so regional rule timelines and build mixes inform the assumptions.
Distribution of primary research fieldwork respondents
| Company type | Respondent position | Region |
|---|---|---|
| Top tier: 35% | CXOs: 15% | APAC: 52% |
| Mid tier: 44% | Functional/Unit leaders: 29% | EMEA: 30% |
| Smaller Players: 21% | Managers: 56% | Americas: 18% |
Market-Sizing & Forecasting
Sizing is built using a top-down and bottom-up blend, where vehicle production by region and vehicle type is established first, then translated into occupant classification systems demand using fitment assumptions tied to restraint and airbag content. To keep the totals realistic, we corroborate the output using selective bottom-up checks, such as sampled ASP times estimated unit volumes for key sensor families, plus channel and integration feedback shared in interviews.
A few practical inputs drive the model and are updated each refresh. These include passenger vehicle build share, airbag and restraint fitment trends, regional safety protocol timing, typical sensor content per seat, and expected ASP movement as electronics content changes. Because adoption can shift quickly when protocols change, the forecast leans on scenario analysis, then the base case is selected after experts confirm which timing and penetration path looks most likely. Where bottom-up coverage is incomplete for smaller geographies, gaps are handled through analog adoption curves tied back to production and regulation timing, and then the totals are normalized to avoid overcounting.
Data Validation & Update Cycle
Validation is handled through multiple checkpoints, since a single dataset rarely explains occupant classification systems demand end to end. We compare outputs with independent signals such as vehicle production totals, reported safety feature adoption, and observed pricing direction, then review outliers before sign-off.
If a region or vehicle type shows a sudden step change, the assumptions are re-checked and follow-up calls are triggered to confirm what changed in programs or regulations. Reports are refreshed annually, with interim updates when material events occur, and a final pass is completed close to delivery so the numbers reflect the latest market conditions.
Mordor Intelligence's Occupant Classification Systems Market Size Versus Other Published Estimates
Published market sizes for occupant classification systems often do not match, mainly because the scope and counting unit are set differently across studies, and then the pricing logic is applied in different ways. Differences also come from how each model treats safety protocol timing, regional production mix, and how frequently assumptions are revisited.
Some sources group occupant detection, interior sensing, and broader cabin monitoring together, which can lift totals through adjacent hardware and software revenue. Those adjacent cabin monitoring items sit outside scope, and Mordor Intelligence counts only systems tied to seat level occupant classification that informs airbag and restraint decisions, with ASPs refreshed using recent platform launch mix and interview checks.
Benchmark comparison
| Source | Market Size | Gaps in Research Methodology |
|---|---|---|
| Mordor Intelligence | USD 3.38 B (2026) | |
| Global Consultancy A | USD 4.10 B (2026) | Uses a wider basket that blends occupant classification with broader in-cabin sensing and occupant monitoring revenue, and it applies a higher average content per vehicle assumption across regions. |
| Trade Journal B | USD 2.90 B (2026) | Uses a narrower installation view that emphasizes pressure-mat based sensing and select passenger car programs, and it keeps ASPs relatively flat, which reduces the modeled value. |
The spread in the table is mainly explained by what gets counted as part of the system and how content per vehicle and pricing are updated through the forecast years. Our model stays traceable to vehicle builds, fitment, and a small set of checkable inputs, which helps teams compare scenarios without mixing adjacent categories.


Key Questions Answered in the Report
What is driving the occupant classification systems market between 2026 and 2031?
The 5.71% CAGR is fueled by stricter safety mandates such as Euro NCAP 2026, China’s GB 15083-2024, and the shift to software-defined vehicles that allow continuous algorithm upgrades.
Which component contributes the most revenue today?
Sensors contribute 63.60% of 2025 revenue because pressure, capacitive and radar devices provide the raw data that restraint controllers require.
Why are radar sensors gaining share over pressure mats?
Radar avoids calibration drift caused by seat-foam hysteresis and meets new child-presence detection requirements, supporting a 12.21% CAGR through 2031.
Which region will grow the fastest?
South America shows the highest regional CAGR at 8.48% as Brazil and Argentina update safety regulations and attract new vehicle assembly investments.
How are suppliers differentiating in a crowded field?
Tier 1s integrate sensor fusion and OTA-ready domain controllers; for example, Continental’s Aumovio and ZF’s LIFETEC carve-out focus on AI software and vertical integration.
Can existing fleets upgrade to advanced occupant detection?
Yes. Aftermarket kits—expanding at 9.76% CAGR—use printed flexible pressure sensors and standard CAN gateways to retrofit older vehicles with compliant occupant monitoring.
Page last updated on:


 Your data is secure and never sold or shared.


