
Nylon Monofilament Market Size and Share
Market Overview
| Study Period | 2020 - 2031 |
|---|---|
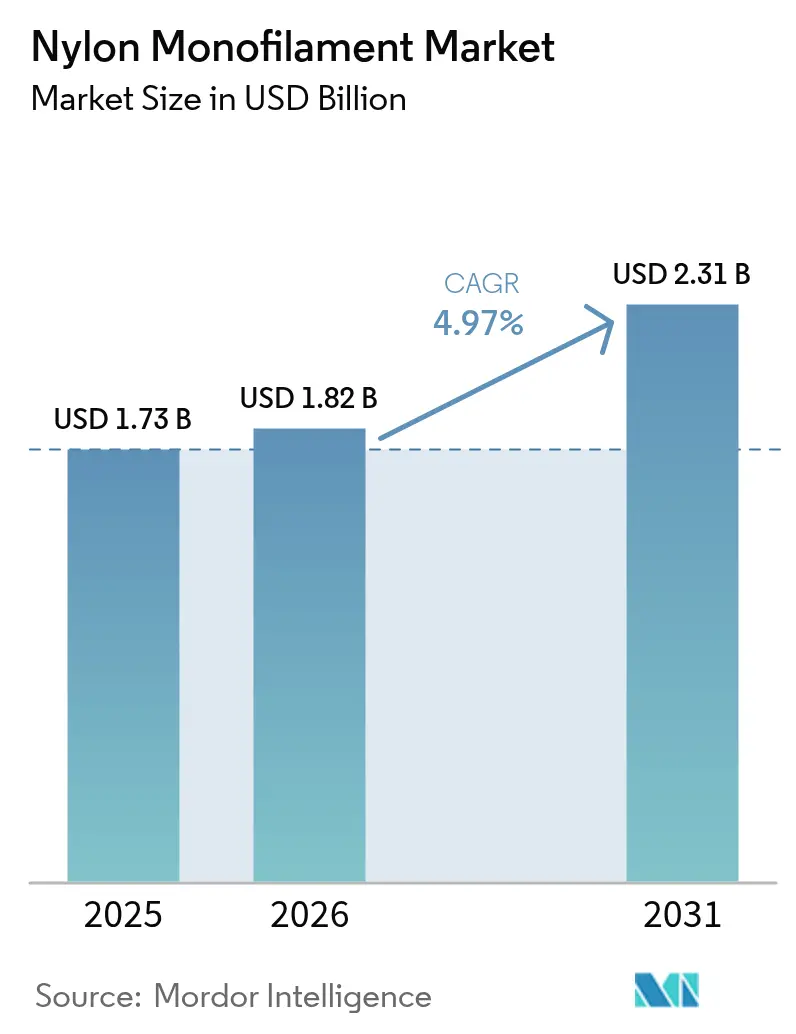
| Market Size (2026) | USD 1.82 Billion |
| Market Size (2031) | USD 2.31 Billion |
| Growth Rate (2026 - 2031) | 4.97 % |
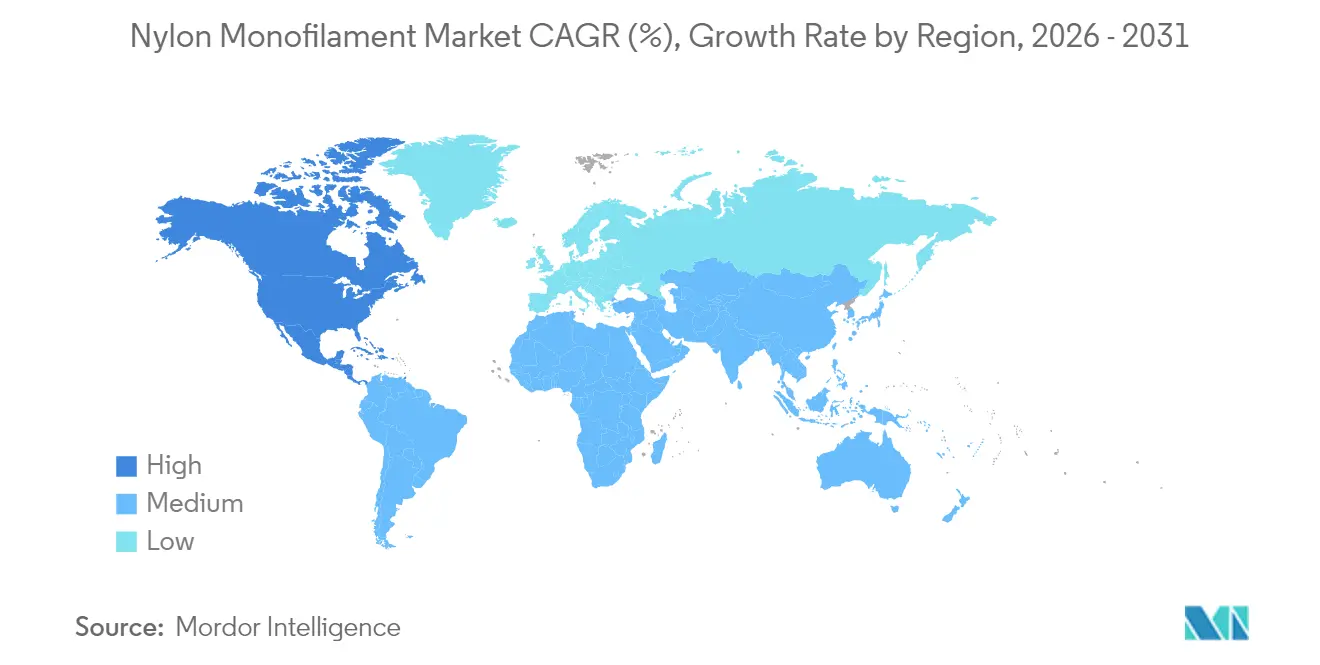
| Fastest Growing Market | North America |
| Largest Market | Asia-Pacific |
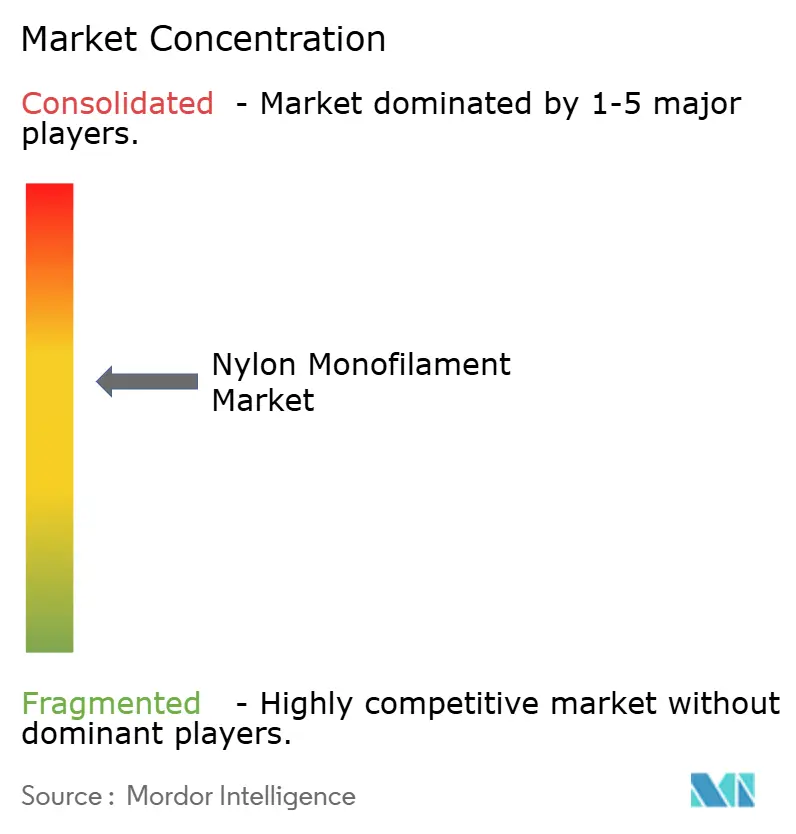
| Market Concentration | Medium |
Major Players *Disclaimer: Major Players sorted in no particular order Image © Mordor Intelligence. Reuse requires attribution under CC BY 4.0. | |
Nylon Monofilament Market Analysis by Mordor Intelligence
The Nylon Monofilament Market size was valued at USD 1.73 billion in 2025 and estimated to grow from USD 1.82 billion in 2026 to reach USD 2.31 billion by 2031, at a CAGR of 4.97% during the forecast period (2026-2031). Demand resilience is anchored in the material’s high tensile strength, chemical resistance, and processability, qualities that give the nylon monofilament market an entrenched role across fishing, medical, automotive, and consumer applications. Continuous investments in vertically integrated supply chains cushion the sector against raw-material volatility, while regulatory scrutiny over microplastics redirects innovation toward bio-based and recycled grades rather than displacing volume outright. Competitive dynamics remain moderately fragmented; however, recent consolidation signals a trend toward scale efficiencies in feedstock sourcing and specialty product development. Growth pockets are most visible in North America, where electric-vehicle (EV) lightweighting and advanced medical devices draw on FDA-approved nylon grades, and in Asia-Pacific, where large-scale fishing and textile operations keep baseline consumption high.
Key Report Takeaways
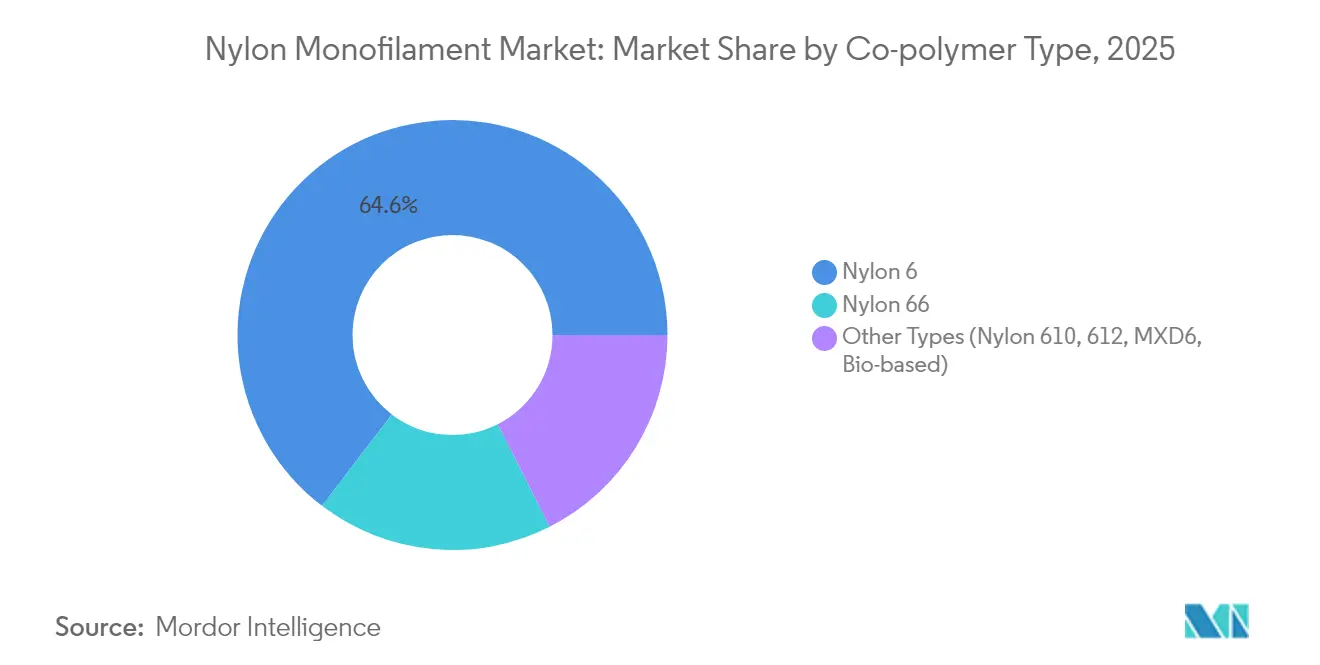
- By co-polymer type, Nylon 6 captured 64.62% of nylon monofilament market share in 2025, whereas Nylon 66 is expanding at a 5.28% CAGR through 2031.
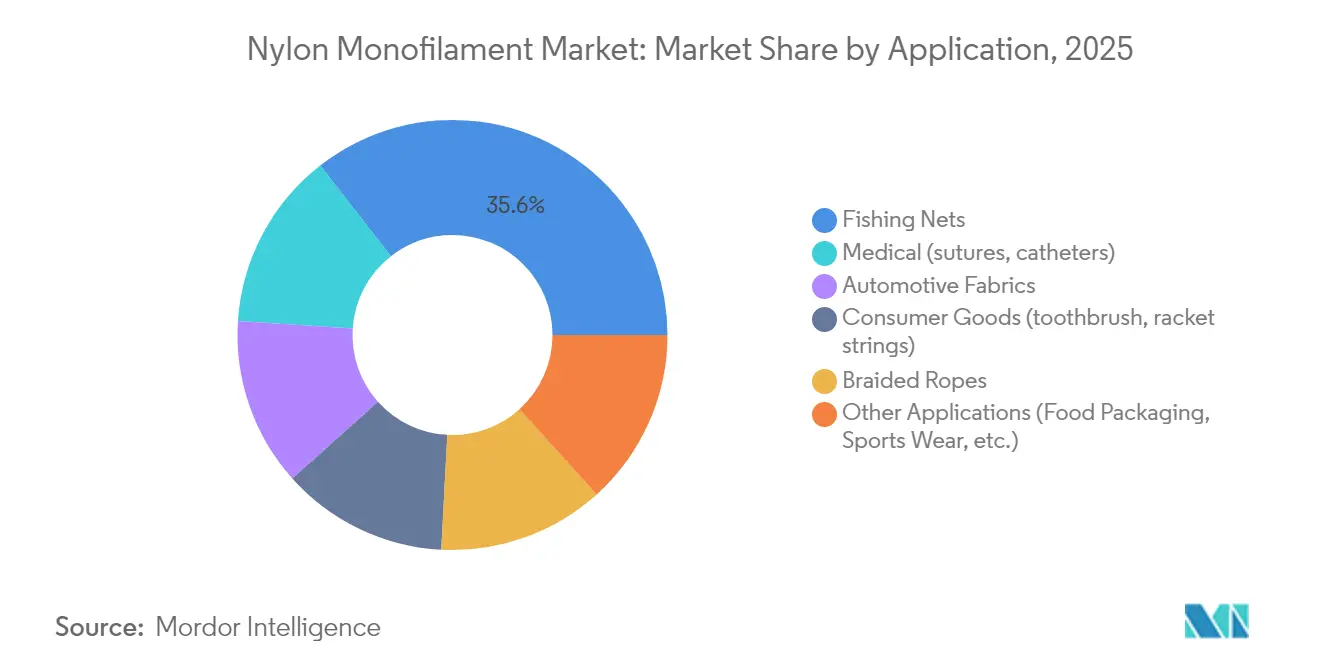
- By application, fishing nets accounted for 35.55% of the nylon monofilament market size in 2025, while medical uses are projected to grow at 6.42% CAGR between 2026 and 2031.
- By geography, Asia-Pacific held 32.88% revenue share in 2025, yet North America is set to record a 5.55% CAGR over the same forecast period.
Note: Market size and forecast figures in this report are generated using Mordor Intelligence’s proprietary estimation framework, updated with the latest available data and insights as of 2026.
Market Trends and Insights
Drivers Impact Analysis of Nylon Monofilament Market*
| Driver | (~) % Impact on CAGR Forecast | Geographic Relevance | Impact Timeline |
|---|---|---|---|
| Growing demand in fishing nets & aquaculture | +1.8% | Global, with APAC core concentration | Long term (≥ 4 years) |
| Surge in automotive lightweight components | +1.2% | North America & Europe primary, APAC manufacturing | Medium term (2-4 years) |
| Expansion in healthcare & surgical sutures | +1.0% | Global, with North America & Europe leading adoption | Medium term (2-4 years) |
| Growth in consumer goods (toothbrush bristles) | +0.4% | Global, with developed markets leading premium adoption | Short term (≤ 2 years) |
| 3-D printing & additive manufacturing adoption | +0.3% | North America & Europe innovation centers, global spillover | Short term (≤ 2 years) |
| Source: Mordor Intelligence | |||
Growing Demand in Fishing Nets & Aquaculture
Expansion of global aquaculture continues to underpin nylon monofilament market growth as operators prioritize gear durability and catch efficiency. Nylon constitutes 76% of fishing-equipment polymers, and monofilament nets outperform multifilament alternatives by maintaining tensile strength under prolonged saltwater exposure. Although Norway is trialing biodegradable gillnets, field data show a 40% drop in catch efficiency and elevated costs, limiting near-term displacement. Field studies further reveal only 3-6% strength loss when nets are immersed in 10% peracetic-acid baths used in fish-farm disinfection, reinforcing nylon’s durability advantage. Regulatory latency in Southeast Asian markets and the immediate economic gains from longer-lasting gear sustain volume growth even as Europe tightens environmental standards. Emerging biodegradable grades that achieve 92% marine degradation within a year remain commercially niche due to inferior mechanical properties.
Surge in Automotive Lightweight Components
Vehicle electrification accelerates the substitution of metal with engineering plastics, and nylon monofilament products such as bearing cages, cable ties, and functional trim contribute measurable weight savings. TECHNYL 4EARTH, manufactured by Domo, delivers up to 80% CO₂ reduction during production without sacrificing modulus or heat resistance. Celanese has introduced glass-fiber reinforced PA66 resins that enable direct metal replacement, offering the fatigue performance EV platforms require[1]Celanese Corporation, “Glass-Fiber Reinforced PA66 for EV Components,” celanese.com. Global OEMs favor nylon because its supply chain is entrenched and pricing mechanisms are well understood, reducing the switching risk relative to newer bio-based options. High qualification costs, tight dimensional tolerances, and regulatory certification needs keep entry barriers high and underpin a stable 1.2-point contribution to the nylon monofilament market CAGR.
Expansion in Healthcare & Surgical Sutures
Nylon monofilament’s biocompatibility, low tissue reactivity, and predictably slow hydrolytic strength decay (15-20% per annum) make it indispensable for microsurgical sutures and catheter components. FDA clearances across multiple nylon grades simplify supplier audits and expedite device approvals[2]European Commission, “Proposal on Microplastic Pellet Emissions,” europa.eu. The move toward single-use medical devices after the COVID-19 pandemic sustains demand, as hospitals emphasize infection control. Ethylene-oxide and e-beam sterilization cycles leave tensile properties intact, supporting broader adoption in minimally invasive and robotic surgery kits. While polyglycolic-acid and polydioxanone threads are biodegradable, surgeons still specify nylon where non-absorbable retention strength is clinically necessary.
Growth in Consumer Goods & 3D Printing Adoption
Personal-care brands specify premium nylon bristles for toothbrushes and cosmetic brushes, emphasizing both aesthetics and longevity. Celanese’s Tynex RS line incorporates bio-based feedstocks to answer sustainability preferences without compromising stiffness. In additive manufacturing, demand for specialty nylon filaments rises alongside a 2030 3D-printing revenue forecast of USD 78 billion, and Braskem’s takeover of taulman3D strengthens North American material supply . Sports-equipment makers continue to use nylon strings for mid-range tennis rackets thanks to the material’s elasticity and abrasion resistance. Consumer scrutiny of microplastic shedding encourages brands like UNIFI to commercialize recycled or degradable nylon variants while maintaining requisite flex-fatigue performance.
Restraints Impact Analysis of Nylon Monofilament Market*
| Restraint | (~) % Impact on CAGR Forecast | Geographic Relevance | Impact Timeline |
|---|---|---|---|
| Government restrictions on nylon fishing lines | -0.6% | Europe & North America leading, global spillover | Medium term (2-4 years) |
| Micro-plastic shedding regulations | -0.5% | Europe primary, North America & APAC following | Medium term (2-4 years) |
| Volatility in raw-material (caprolactam) prices | -0.8% | Global, with Asia-Pacific manufacturing concentration | Short term (≤ 2 years) |
| Source: Mordor Intelligence | |||
Government Restrictions & Microplastic Regulations
The EU aims to cut plastic-pellet emissions by 74%, obliging processors handling over 5 tonnes annually to certify loss-prevention protocols—measures that could add compliance costs to every EU-bound kilogram of nylon monofilament. Senegal’s 1998 ban on nylon monofilament gillnets, although weakly enforced, illustrates how legal uncertainty can disrupt investment plans for fish-gear suppliers. In the United States, the General Services Administration now mandates single-use-plastic-free packaging on federal contracts, signaling future procurement barriers. Laboratory assessments of edible seafood detected nylon fibers, strengthening the scientific case for tighter controls across consumer goods. Industry responses include accelerated R&D in compostable or enzyme-cleavable polyamides, yet cost and performance gaps hinder immediate large-scale substitution, resulting in a net 1.1-point drag on the nylon monofilament market CAGR.
Volatility in Raw-Material (Caprolactam) Prices
Spot caprolactam climbed to USD 1,850 per tonne in 2024 as benzene feedstock tightened, widening the caprolactam–benzene differential to USD 950 per tonne and compressing monofilament margins. PA66 is doubly exposed because adiponitrile disruptions lifted spot offers to USD 5.00 per kg. China’s Q4 2024 PA66 average price slipped to USD 2,587 per tonne on automotive softening, yet North American tags held firm as inventory discipline limited downside. For integrated players such as BASF, feedstock swings can be partly offset via upstream benzene positions; mid-sized converters reliant on spot purchases face margin squeeze and may pass costs downstream, raising price elasticity risk. A 0.8-point reduction in the nylon monofilament market CAGR is therefore attributed to feedstock volatility.
*Our forecasts treat driver/restraint impacts as directional, not additive. The impact forecasts reflect baseline growth, mix effects, and variable interactions.
Nylon Monofilament Market Segment Analysis
By Co-polymer Type:
Nylon 6 Dominance Faces Specialty ChallengeNylon 6 retained 64.62% nylon monofilament market share in 2025 thanks to a mature global caprolactam production base that keeps conversion costs low. Plants such as GSFC’s 70,000-80,000 tonne facility in India illustrate economies of scale, and roughly 17,000 tonnes feed captive monofilament operations. The nylon monofilament market size for Nylon 6 is projected to reach USD 1.39 billion by 2031 as mainstream applications from fishing nets to consumer bristles uphold baseline demand. In contrast, Nylon 66 is on a steeper 5.28% CAGR trajectory, driven by superior heat-aging and dimensional stability required for EV components and industrial belts. INVISTA’s USD 1.75 billion expansion in Shanghai, doubling PA66 output to 400,000 tonnes, signals confidence in high-temperature markets.
Longer-chain and specialty grades—Nylon 610, 612, MXD6—command premium prices where water absorption, fuel-barrier, or optical-clarity performance matters. Nylon-MXD6 retains 60% of initial strength after saturated-steam exposure, making it attractive for chemical-resistant monofilaments. Bio-based output is scaling quickly: LG Chem and CJ CheilJedang target 1.4 million tonnes of renewable nylon by 2028, a 29% annual addition to global capacity. DSM’s fully bio-based Stanyl® B-MB delivers a 50% smaller carbon footprint, satisfying OEM climate targets without mechanical compromise. Specialty momentum therefore erodes Nylon 6’s share at the margin but expands overall premium value pools in the nylon monofilament market.


By Application:
Medical Growth Outpaces Traditional Fishing DominanceFishing nets still represented 35.55% of the nylon monofilament market size in 2025, reflecting enduring reliance on durable, salt-resistant gear in commercial capture and aquaculture. Field tests show negligible tensile loss after repeated alkaline cleaning cycles, validating cost-of-ownership advantages. Yet medical demand is rising faster; a 6.42% CAGR through 2031 translates into a USD 330.28 million medical-grade nylon monofilament market by forecast end. Sutures stand out: microsurgical threads rely on nylon’s non-wicking surface and predictable knot security, while ethylene-oxide sterilization leaves tensile degradation below 2%.
Automotive fabrics and seat-belt webbings capture spillover growth from vehicle lightweighting, with reinforced PA66 monofilaments cutting component weight by up to 30%. Consumer goods, especially toothbrush bristles and sporting-goods strings, sustain moderate single-digit gains because nylon’s modulus and flex-fatigue life underpin tangible performance benefits. Braided ropes maintain steady uptake in marine and industrial hoisting, where UV-stability and impact resistance trump costlier aramid solutions. Emerging avenues—food-contact films, 3D-printing filaments, smart-textile actuators—are niche but high-margin, supported by FDA-approved grades and the proliferation of desktop fused-filament printers.
Geography Analysis
APAC Nylon Monofilament Market
Asia-Pacific accounted for 32.88% of nylon monofilament market share in 2025, leveraging integrated petrochemical complexes and cost-effective labor. Chinese producers export industrial yarn to Thailand, Indonesia, and India under a well-established intra-Asian network. India’s roadmap targeting USD 350 billion in domestic man-made fiber consumption and USD 300 billion in exports by 2025 provides a growing outlet for monofilament in technical textiles. Japan’s early overseas investment—Toray built facilities in Thailand and Indonesia in the 1960s—continues to yield technological spillovers. Regional challenges include microplastic regulations and benzene-linked feedstock spikes, yet entrenched scale advantages preserve Asia-Pacific leadership in base-grade volumes.
North America Nylon Monofilament Market
North America is projected to post the fastest 5.55% CAGR over 2026-2031, propelled by EV manufacturing mandates and an advanced medical-device supply chain. INVISTA is recommissioning hexamethylene-diamine assets in Ontario and planning a new adiponitrile unit to secure PA66 precursors. BASF lifted North-American PA66 compound prices by USD 0.15 per lb in mid-2024, indicating healthy demand elasticity. Braskem’s U.S. filament acquisition supports 3D-printing uptake, adding localized nylon capacity for aerospace, dental, and consumer prototypes. FDA pathways for bio-based polyamides further entice OEMs to specify sustainable grades, reinforcing premium-segment pull.
EMEA and South America Nylon Monofilament Market
Europe is navigating tighter regulation and energy-cost headwinds yet leads in circular-economy initiatives. The EU microplastic accord forces pellet-handling certification, raising compliance costs but providing a moat for early adopters. BASF’s acquisition of DOMO’s Alsachimie stake and the startup of a world-scale hexamethylene-diamine plant in France affirm long-term commitment to European nylon chemistry. South America and the Middle East & Africa trail in absolute volume yet present green-field opportunities in aquaculture and infrastructure; however, currency risk, import dependency, and limited polymerization assets temper near-term growth.

Regulatory Landscape
Regulation affecting nylon monofilament is increasingly shaped by chemical safety and circularity requirements for textiles, with the EU setting standards that flow into global supply chains. The EU Ecodesign for Sustainable Products Regulation (ESPR) has been in force since 18 July 2024, and the Commission is developing product-specific textile requirements. That work links nylon monofilament converters and downstream textile users to forthcoming obligations around design, information, and circularity.
On chemicals, EU REACH Annex XVII includes textile-related restrictions that can affect monofilament used in technical textiles and consumer goods. These include a formaldehyde emission limit (0.080 mg/m3) applicable from 6 August 2026 and a PFHxA and related substances restriction applying to textiles and related accessories from 10 October 2026. For waste and claims, the revised EU Waste Framework Directive entered into force on 16 October 2025, with national transposition required by 17 June 2027 and operational textile EPR schemes by 16 April 2028. The Empowering Consumers for the Green Transition Directive applies from 27 September 2026, tightening substantiation of environmental claims and limiting vague sustainability marketing across nylon-based products.
Value Chain Analysis
The nylon monofilament value chain begins with upstream petrochemical and intermediate inputs, primarily caprolactam for Nylon 6 and adipic acid plus hexamethylenediamine for Nylon 66. These are polymerized into nylon chips/resins, then converted through extrusion and drawing into monofilaments with targeted diameters and performance characteristics such as tensile strength, abrasion resistance, and chemical resistance. Secondary operations including texturing, coloring, coating, or compounding follow to meet application-specific needs.
Midstream activity is split between integrated resin producers and specialized monofilament converters, while downstream demand is concentrated in technical textiles and engineered applications such as fishing and aquaculture nets, filtration media, paper machine clothing, conveyor and industrial fabrics, brush/bristle products, and medical components for qualified grades. Distribution typically reaches high-spec end users through direct OEM supply (medical, automotive, and industrial) and through regional distributors and converters for commodity grades. Key bottlenecks include feedstock price volatility, qualification lead times, and logistics constraints. Industry bodies such as CIRFS monitor EU policy and trade issues affecting man-made fibers, reinforcing the value of compliance documentation and traceability from resin through finished monofilament and into regulated downstream products.
Competitive Landscape
The nylon monofilament market features moderate consolidation. BASF, Toray Industries, and Celanese capitalize on vertical integration from benzene and adiponitrile through compounded monofilament grades, muting feedstock-price shocks and enabling differentiated service packages. INVISTA concentrates on high-temperature PA66 for automotive under-the-hood and EV battery components. Recent consolidation—BASF’s purchase of DOMO’s Alsachimie stake—rationalizes European capacity and enhances feedstock synergies. Ascend Performance Materials’ bankruptcy underscores exposure for non-integrated firms during feedstock upswings.
Strategic thrusts center on sustainability: Celanese markets partially bio-based Tynex RS, BASF scales textile-waste loopamid, and LG Chem pursues renewable monomers. Enzyme-based recyclers such as Protein Evolution and Basecamp Research position Biopure technology for fully circular polyamide loops, challenging virgin-resin economics. Patent filings in bio-nylon and depolymerization climbed 18% year-on-year, indicating an innovation race that could re-segment the nylon monofilament industry around environmental credentials.
Barrier to entry remains high: polymerization requires USD 100-150 million capital outlay per 100 ktpa, and global automotive or medical OEM qualification cycles span up to 24 months. New entrants therefore focus on niche additive manufacturing filaments or localized medical-suture lines, often partnering with incumbents for polymer supply. Regional regulation increasingly shapes competitive moats; firms able to certify pellet-loss prevention and low-carbon production gain preferential access to EU and North American procurement channels.
Nylon Monofilament Industry Leaders
Superfil
Shakespeare Company, LLC
Perlon GmbH
Ruichang Monofilament
Toray Industries Inc.
- *Disclaimer: Major Players sorted in no particular order
Nylon Monofilament Market Companies Covered in this Report
- ABC Polymer Industries, LLC
- AstenJohnson
- Atkins & Pearce
- BASF SE
- Celanese Corporation
- ICF Mercantile LLC
- INVISTA
- Nanjing Forever Textile Co.,LTD
- Perlon GmbH
- Radici Partecipazioni SpA
- Ruichang Monofilament
- Shakespeare Company LLC
- Shinkey Monofilament Enterprise Co., LTD
- Superfil
- The Filament Company
- Toray Industries Inc.

Market Opportunities and Future Outlook
Sustainability-linked compliance is creating differentiation opportunities for nylon monofilament that can support verified recycled content, controlled-chemistry formulations, and stronger documentation. The EU Waste Framework Directive revision, in force from 16 October 2025, and the path toward operational textile EPR schemes by 16 April 2028 increase the commercial relevance of takeback-ready product designs and recycled-feedstock sourcing. In parallel, the EU Empowering Consumers for the Green Transition Directive applying from 27 September 2026 raises the bar for substantiated environmental claims across consumer-facing monofilament applications, such as brush/bristle products, and for technical textile supply chains selling into the EU.
Where nylon monofilament competes on durability and qualification barriers rather than commodity pricing, performance-led opportunities are more visible, including medical device components and high-temperature automotive and EV uses that favor PA66 and specialty grades. There is also room for optimization in precision extrusion and finer-denier monofilaments that reduce material usage per unit while maintaining mechanical strength, aligning cost and sustainability objectives. On the supply side, corporate actions that improve production control and continuity, including capacity additions in monofilament conversion and ownership changes that stabilize specialist filament producers, support an environment where buyers can qualify higher-spec and traceable nylon monofilament grades alongside standard fishing and industrial demand.
Recent Industry Developments in Nylon Monofilament Market
- June 2026: Perlon Group was transferred to Wuxi Yinda Nylon Co. Ltd. effective June 3, 2026, following a court-supervised restructuring and investor process. The ownership change supports continuity for Perlon's specialty filament operations and can alter sourcing options for customers that rely on consistent quality and long-term supply agreements.
- June 2025: Nova Capital Management completed the acquisition of Shakespeare Company LLC from Jadex Inc. on June 12, 2025. The transaction repositioned Shakespeare under new ownership, enabling sharper focus on its engineered materials portfolio and the operational decisions that influence monofilament supply to fishing and related end uses.
- February 2024: The Filament Company opened a new plant in Goa, India, after acquiring Shaun Filaments, expanding local nylon monofilament production capability. The added footprint strengthens regional supply availability for Indian technical textile and fishing-gear converters and shortens lead times versus imported filament.


Nylon Monofilament Market Report Scope and Research Methodology
Market Definition and Coverage
For this study, the market includes revenue generated from nylon monofilament sold as a single, extruded nylon fiber that is used in end uses like fishing gear, ropes, industrial and automotive fabrics, and select consumer and medical uses.
Scope exclusions: Excluded items include multi-filament yarns and woven fabric sales that are not sold as nylon monofilament.
Segments Covered in This Report
- By Co-polymer Type
- Nylon 6
- Nylon 66
- Other Types (Nylon 610, 612, MXD6, Bio-based)
- By Application
- Fishing Nets
- Medical (sutures, catheters)
- Automotive Fabrics
- Consumer Goods (toothbrush, racket strings)
- Braided Ropes
- Other Applications (Food Packaging, Sports Wear, etc.)
- Geography
- Asia-Pacific
- China
- India
- Japan
- South Korea
- Rest of Asia-Pacific
- North America
- United States
- Canada
- Mexico
- Europe
- Germany
- United Kingdom
- France
- Italy
- Rest of Europe
- South America
- Brazil
- Argentina
- Rest of South America
- Middle East and Africa
- Saudi Arabia
- South Africa
- Rest of Middle East and Africa
- Asia-Pacific
Data Sources, Market Sizing, and Validation
Desk Research
Desk work started with mapping where nylon monofilament is made, traded, and consumed, and then aligning that map with the main end-use demand pools. We relied on public statistical and technical references such as UN Comtrade trade data, US International Trade Commission tariff and import summaries, Eurostat industrial and trade tables, and FAO fisheries and aquaculture indicators that signal netting and line demand.
On the supply and product side, we also used sources such as USGS materials context notes, USPTO and other patent libraries for application and resin direction, and peer-reviewed polymer and textile journals to understand typical grades, performance requirements, and substitution patterns. Company annual reports, investor presentations, and reputable industry press were used to sanity-check capacity additions, plant utilization commentary, and regional demand narratives. We also used paid subscriptions for company financials and intelligence and for shipment-level import and export checks where it helped resolve gaps. The sources listed here are illustrative, and we used other public and paid references during data collection and validation.
Primary Interviews and Surveys
Primary work focused on validating what gets counted as nylon monofilament in real transactions, and then confirming how volumes and pricing move by grade and application. We spoke with a mix of resin and filament producers, converters, distributors, and large end users across major consuming regions, so missing variables from desk research could be filled and then cross-checked. When inputs disagreed, we followed up to reconcile differences in units (denier, diameter, and spool formats), contract timing, and regional pricing conventions.
Distribution of primary research fieldwork respondents
| Company type | Respondent position | Region |
|---|---|---|
| Top tier: 28% | CXOs: 16% | APAC: 42% |
| Mid tier: 56% | Functional/Unit leaders: 27% | EMEA: 33% |
| Smaller Players: 16% | Managers: 57% | Americas: 25% |
Market-Sizing & Forecasting
Sizing was built using a top-down and bottom-up combination, where the top-down view reconstructs demand using end-use activity signals and trade and production context, and then the totals are tested using selective supplier roll-ups and price times volume checks. In practice, we first anchored demand using indicators such as fisheries and aquaculture activity (netting and line usage), industrial textile output trends, automotive production and fabric use intensity, and observed trade flows for nylon filament-related categories, which are then converted into a value view using typical application-level pricing.
To keep the model grounded, a few key inputs were treated as adjustable levers, including regional consumption mix by end use, average selling price progression by grade (nylon 6 versus nylon 66 and other copolymers), diameter and denier ranges tied to applications, and the share of demand served through imports versus local production. Forecasts were derived using scenario analysis supported by short time-series smoothing, where macro drivers (industrial output, vehicle builds, and fisheries activity) were stress-tested against interview guidance on capacity utilization and pricing cycles. Where company-level revenue visibility was limited, gaps were handled through regional benchmarks and converter-level checks, followed by an adjustment step so totals stayed consistent with the demand pool logic.
Data Validation & Update Cycle
Outputs were validated through multiple passes that compare the modeled totals against independent signals such as trade direction, resin and filament pricing trends, and capacity change timelines reported in public disclosures. Outliers were reviewed at the region and application level, and when variances could not be explained by unit conversions or timing, we re-contacted experts to confirm assumptions and correct misclassification.
Before sign-off, the model and narrative go through an analyst review sequence that checks arithmetic integrity, assumption consistency, and whether the final ranges align with observed market behavior. Reports are refreshed annually, and interim updates are triggered when major events occur, such as plant starts and shutdowns, sharp raw material price movements, or regulatory changes impacting synthetic fibers. Right before delivery, a final update pass is completed so clients receive the latest view available at that time.
Mordor Intelligence's Nylon Monofilament Market Size Measured Against Other Published Estimates
Published market sizes for nylon monofilament can look different even when the topic label sounds identical, because the counted product form, end-use mapping, and price conversion steps are not always aligned. The biggest swings tend to show up when adjacent categories are included, or when a single global price curve is used without checking regional contract timing.
Woven technical fabrics and finished nets sit outside Mordor Intelligence's scope for this market, which is one reason some published totals come out higher when they count downstream fabric value rather than monofilament revenue at the filament stage.
Benchmark comparison
| Source | Market Size | Gaps in Research Methodology |
|---|---|---|
| Mordor Intelligence | USD 1.82 B (2026) | |
| Global Consultancy A | USD 1.50 B (2024) | Uses an earlier base year and a broader definition that appears to mix monofilament with some finished fishing and industrial textile goods, and the value conversion is not clearly tied to regional contract pricing. |
| Industry Portal B | USD 1.80 B (2025) | Leans heavily on a single global average price and does not spell out how nylon 6 versus nylon 66 and other copolymer grades are weighted, which can shift totals when grade mix differs by region. |
The spread in the table mostly comes from what is counted as upstream filament revenue versus downstream product value, followed by how pricing is converted across regions and grades. By keeping the model traceable to end-use demand signals, realistic price progression, and repeatable unit conversions, we can explain the number step by step and adjust it cleanly when new capacity or trade shifts show up.


Key Questions Answered in the Report
What is the current Nylon Monofilament Market size?
It reached USD 1.82 billion in 2026 and is forecast to hit USD 2.31 billion by 2031 under a 4.97% CAGR.
Which geography is growing fastest in nylon monofilament demand?
North America is projected to expand at 5.55% CAGR over 2026-2031 as EV lightweighting and medical devices scale.
Why does Nylon 6 hold the largest share among co-polymer types?
Established caprolactam infrastructure and cost-efficient production give Nylon 6 a 64.62% share across high-volume uses such as fishing nets.
Which application segment is set to outpace the rest?
Medical uses, particularly surgical sutures, are advancing at 6.42% CAGR thanks to nylon’s biocompatibility and sterilization tolerance.
Page last updated on:


 Your data is secure and never sold or shared.


