
Nucleotides Market Size and Share
Market Overview
| Study Period | 2021 - 2031 |
|---|---|
| Market Size (2026) | USD 0.92 Billion |
| Market Size (2031) | USD 1.32 Billion |
| Growth Rate (2026 - 2031) | 7.49 % |
| Fastest Growing Market | Asia Pacific |
| Largest Market | Asia Pacific |
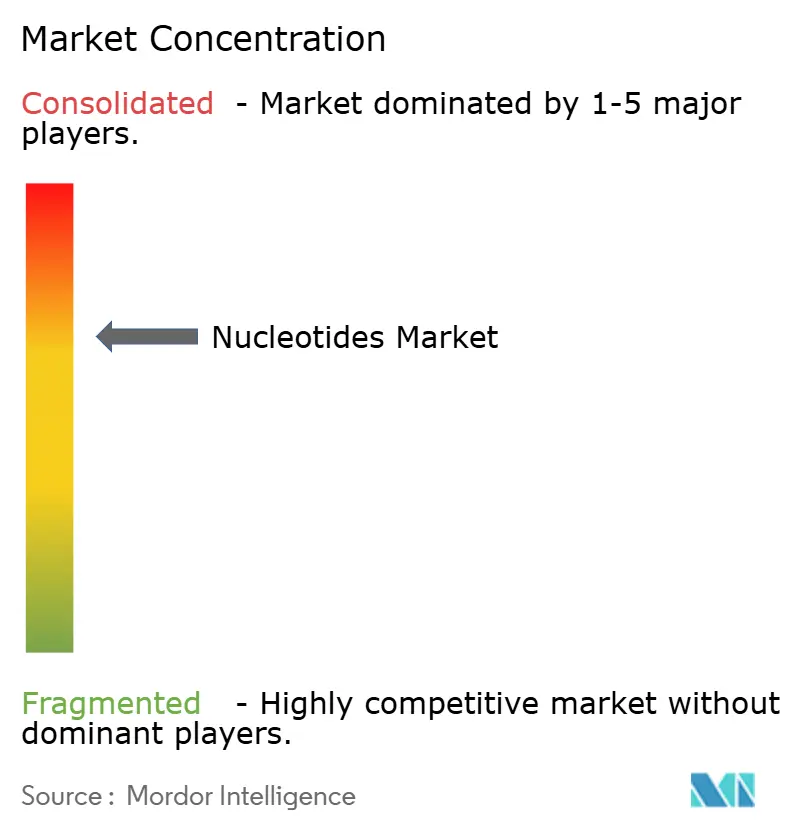
| Market Concentration | Medium |
Major Players *Disclaimer: Major Players sorted in no particular order Image © Mordor Intelligence. Reuse requires attribution under CC BY 4.0. | |
Nucleotides Market Analysis by Mordor Intelligence
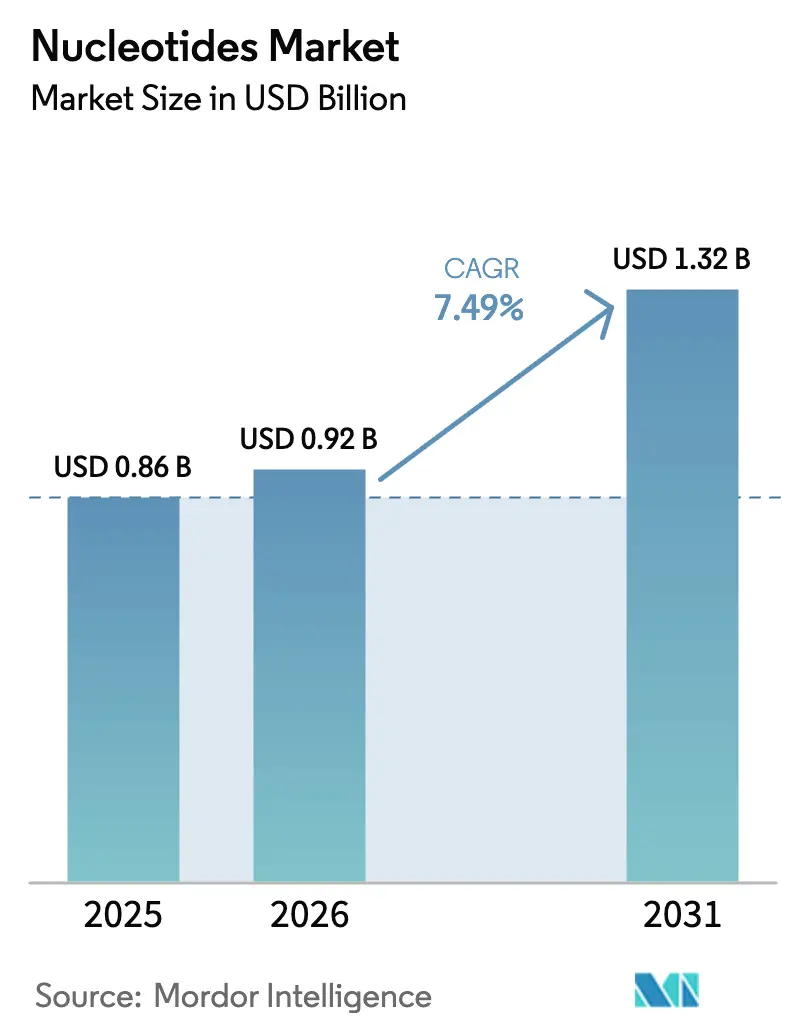
The Nucleotides Market size is expected to grow from USD 0.86 billion in 2025 to USD 0.92 billion in 2026 and is forecast to reach USD 1.32 billion by 2031 at 7.49% CAGR over 2026-2031. This sustained trajectory mirrors strong pull from gene- and cell-therapy pipelines that consume large volumes of GMP-grade building blocks, steady infant-formula fortification mandates in Asia and Europe, and rapid adoption of nucleotide-based feed additives following restrictions on prophylactic antibiotics. Pyrimidine derivatives continue to dominate supply chains because cytidine and uridine support mRNA vaccine production, while precision-fermentation upgrades tighten cost curves for both food- and pharma-grade lines. Consolidation is moderate: the top five producers control about half of installed capacity, yet dozens of specialist CDMOs compete in high-margin oligonucleotides. Commodity corn and sugar price swings, however, inject earnings volatility, and capital-intensive GMP plants constrain new entrants.
Key Report Takeaways
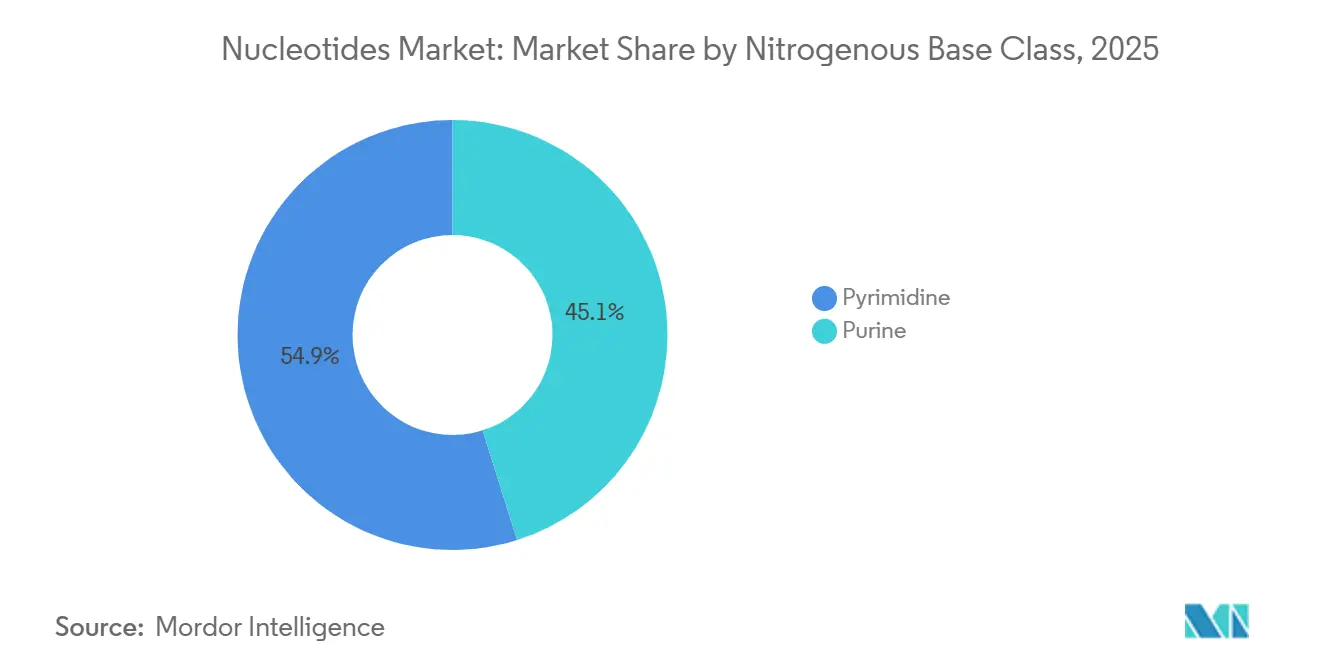
- By nitrogenous base class, pyrimidines captured 54.87% of the nucleotides market share in 2025 and are advancing at 7.96% CAGR through 2031.
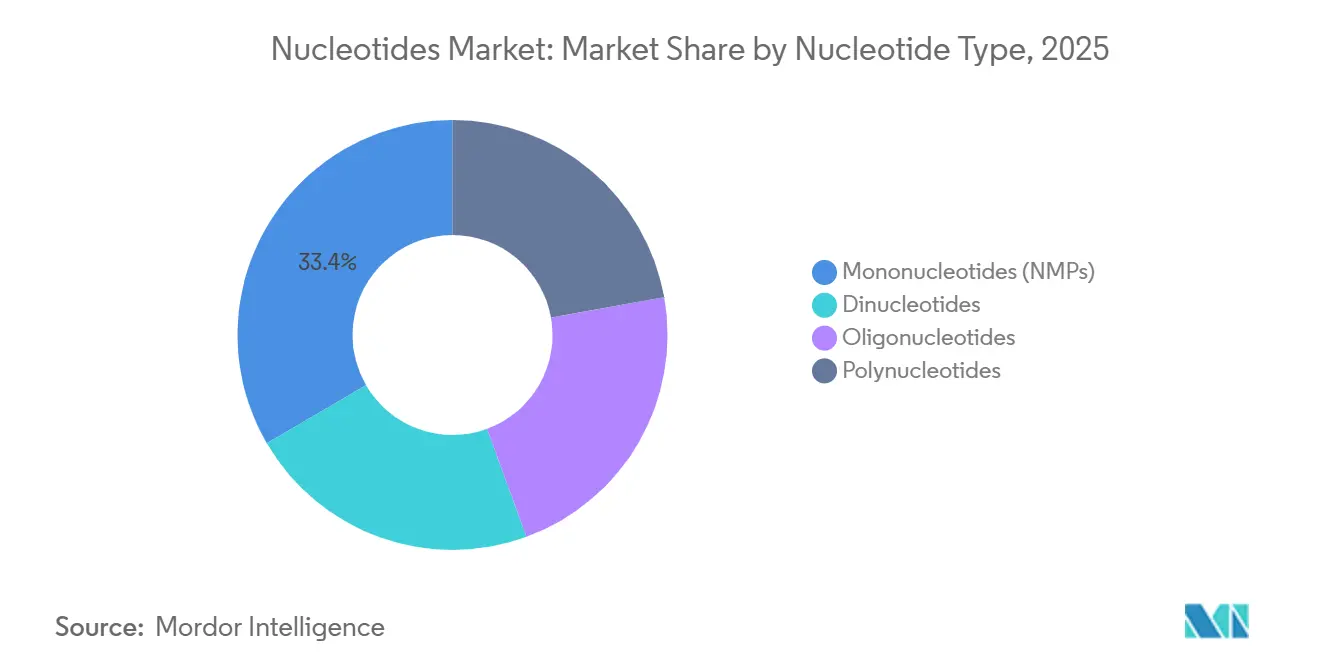
- By nucleotide type, mononucleotides retained 33.40% of the nucleotides market size in 2025, while oligonucleotides are recording an 8.22% CAGR to 2031.
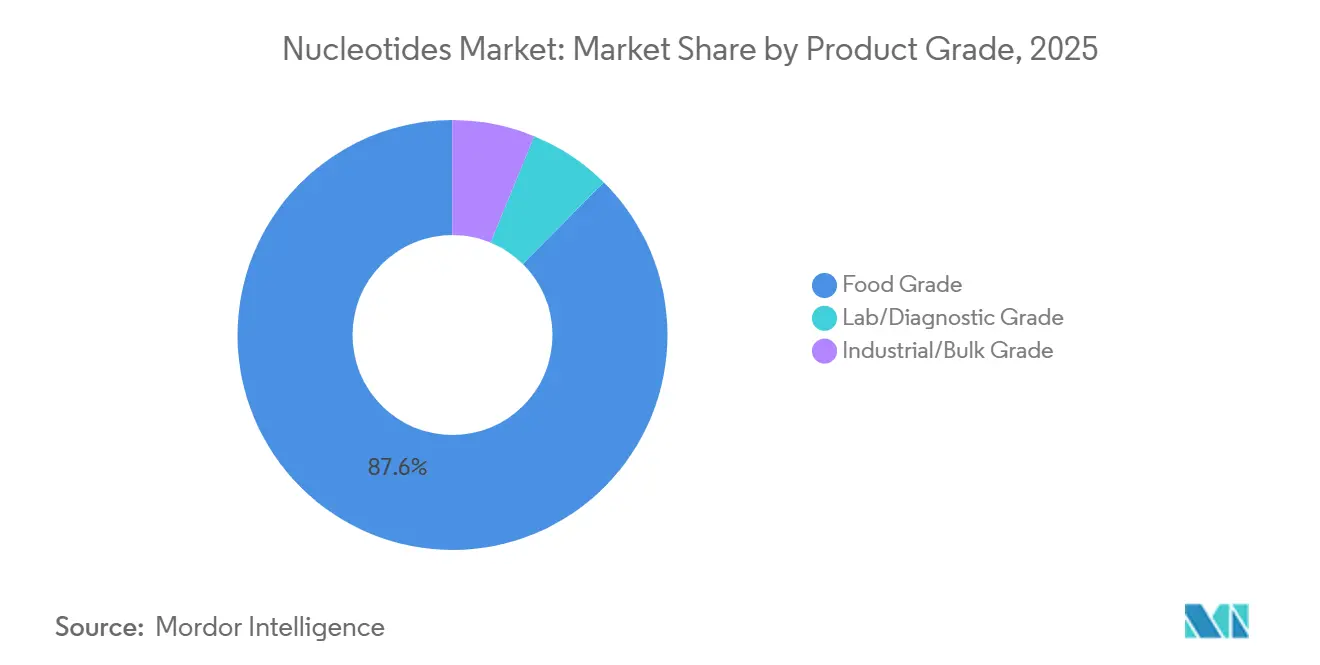
- By product grade, food-grade commanded 87.58% of revenue in 2025 and is advancing at 8.38% CAGR through 2031.
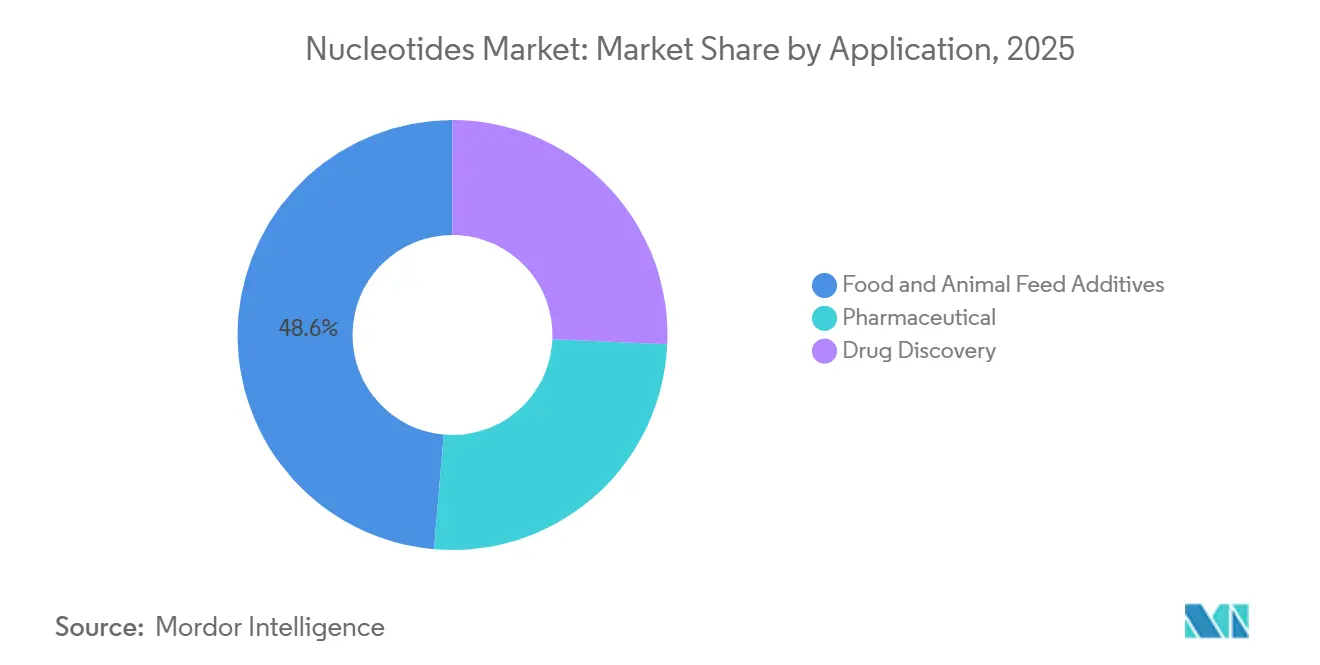
- By application, food and animal-feed additives led with 48.62% share of the nucleotides market size in 2025 and are forecast to post 7.65% CAGR through 2031.
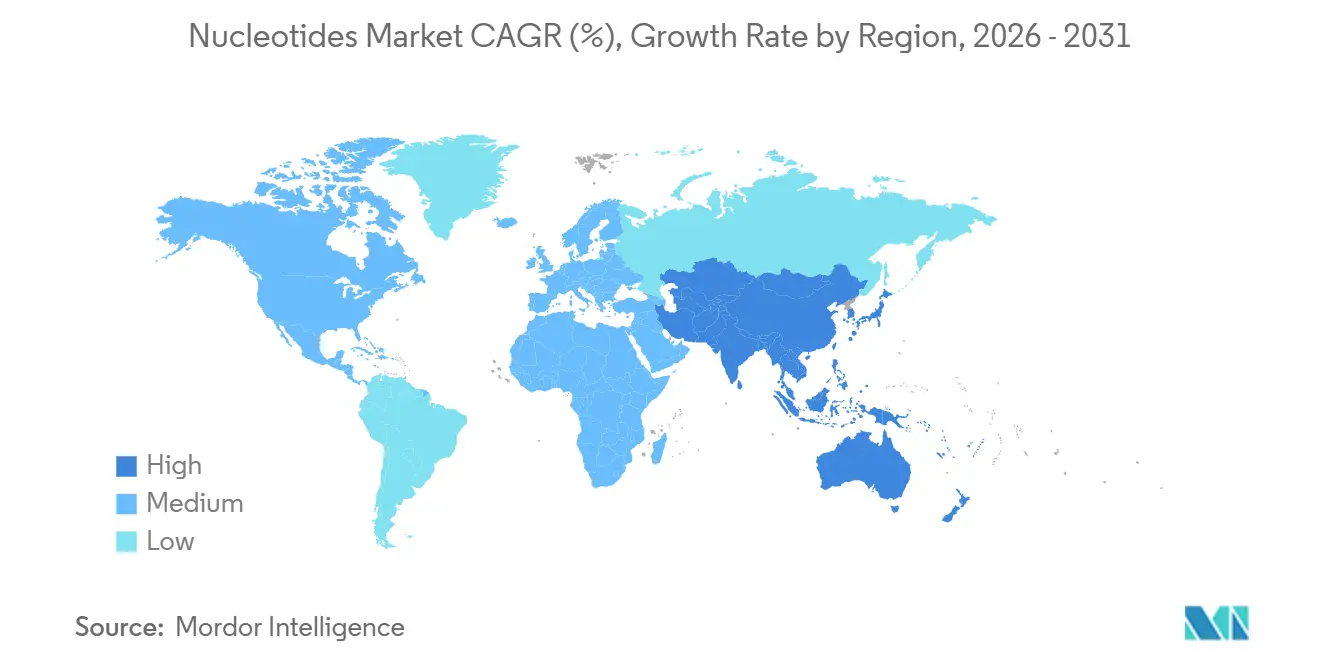
- By geography, Asia-Pacific held 44.71% share of the nucleotides market size in 2025 and is advancing at a 7.91% CAGR through 2031.
Note: Market size and forecast figures in this report are generated using Mordor Intelligence’s proprietary estimation framework, updated with the latest available data and insights as of January 2026.
Market Trends and Insights
Drivers Impact Analysis of Nucleotides Market*
| Driver | (~) % Impact on CAGR Forecast | Geographic Relevance | Impact Timeline |
|---|---|---|---|
| Growing demand from pharmaceutical and biopharma sectors | +2.1% | Global, concentrated in North America and Europe | Long term (≥ 4 years) |
| Rising adoption in functional infant and medical nutrition | +1.8% | Asia-Pacific core, spillover to Europe and North America | Medium term (2-4 years) |
| Inclusion in livestock and aquaculture feed to replace antibiotics | +1.3% | Europe and Asia-Pacific, emerging in Latin America | Medium term (2-4 years) |
| Rapid growth of oligonucleotide-based gene and cell-therapy pipelines | +1.6% | North America and Europe, early adoption in Japan | Long term (≥ 4 years) |
| Precision fermentation platforms lowering production cost | +1.2% | Global, led by Asia-Pacific manufacturing hubs | Short term (≤ 2 years) |
| Source: Mordor Intelligence | |||
Growing Demand from Pharmaceutical and Biopharma Sectors
Oligonucleotide therapeutics shifted from niche to mainstream after the FDA cleared Casgevy, Itvisma, RIVFLOZA, and TRYNGOLZA in 2024, prompting originators to lock in multi-year supply contracts for high-purity nucleotides. Thermo Fisher expanded a Singapore facility in 2025, injecting 500 kg of annual capacity and offering 2-week turnaround times for antisense and siRNA programs. The American Society of Gene and Cell Therapy counted 1,261 RNA-based therapies in active pipelines, a 22% rise year-over-year, underscoring pervasive demand for cytosine, adenine, guanine, and uracil monomers. Messenger-RNA vaccine plants consumed 12,000 t of nucleotides in 2024 and are switching to continuous processing, which heightens near-term raw-material tightness. Convergence of CRISPR, RNAi, and self-amplifying RNA platforms therefore cements structural pull for GMP-grade inputs that food-grade suppliers cannot match.
Rising Adoption in Functional Infant and Medical Nutrition
Regulators continue to endorse nucleotide fortification in formula. The European Food Safety Authority reaffirmed safe use up to 5 mg/100 kcal in 2024[1]. China’s National Health Commission mandated nucleotides in follow-on formula for 6- to 12-month infants in 2025, instantly lifting demand by 2,400 t per year. Clean-label brands now insist on fermentation-derived grades; lead times stretched to 20 weeks in early 2026, double 2024 norms, as capacity struggled to certify organic standards. Medical-nutrition firms add nucleotide blends at concentrations two-to-three times infant-formula norms, capturing premium pricing. As regulatory mandates intersect with consumer preference for natural inputs, procurement teams reevaluate supplier rosters in favor of dedicated clean-room fermenters.
Inclusion in Livestock and Aquaculture Feed to Replace Antibiotics
The European Union’s 2022 antibiotic ban catalyzed a shift toward immune-modulating nucleotide additives. Poultry trials adding 0.5–1 kg of nucleotide blend per metric ton of feed cut mortality 8–12% and improved feed conversion up to 5%. China approved six nucleotide feed additives for aquaculture in 2025, supporting shrimp and tilapia farms plagued by disease. Aquaculture is particularly responsive because fish have limited endogenous synthesis pathways. Brazilian integrators are running commercial pilots to secure antibiotic-free export premiums. Although the segment is price-sensitive, its volume stability cushions producers against pharmaceutical demand cycles.
Rapid Growth of Oligonucleotide-Based Gene and Cell-Therapy Pipelines
CRISPR-Cas9 approvals spotlight high per-patient nucleotide usage, with each Casgevy dose requiring roughly 250 g of modified oligos. Vertex disclosed USD 80 million of QC infrastructure spending to safeguard supply chain for the launch. Antisense launches need 5–10 kg of API per program, straining mid-tier CDMO capacity. Japan fast-tracked two oligonucleotide drugs in 2025, adding localized demand that domestic suppliers aim to capture. As the pipeline advances, achieving sub-USD 500 per gram cost for phosphorothioate oligos remains the gating hurdle to broad access.
Restraints Impact Analysis of Nucleotides Market*
| Restraint | (~) % Impact on CAGR Forecast | Geographic Relevance | Impact Timeline |
|---|---|---|---|
| High CAPEX and GMP-compliance costs for new plants | -0.9% | Global, acute in North America and Europe | Long term (≥ 4 years) |
| Volatile sugar/corn-based raw material prices | -0.7% | Asia-Pacific and North America | Short term (≤ 2 years) |
| Fermentation-capacity bottlenecks for clean-label infant-formula grade | -0.6% | Europe and Asia-Pacific | Medium term (2-4 years) |
| Source: Mordor Intelligence | |||
High CAPEX and GMP-Compliance Costs for New Plants
Building a GMP nucleotide plant demands USD 50–200 million in upfront spending plus stringent validation regimes that raise operating overhead 15–20% versus food-grade lines. BioSpring’s Hamburg expansion took 18 months of inspections before revenue flow, illustrating cash-flow drag. Average utilization hovers near 70% because changeovers and batch-release testing idle equipment, below the 85% threshold needed for robust returns. As a result, smaller CDMOs favor partnerships over greenfield builds, concentrating pharmaceutical-grade supply among a dozen qualified players.
Volatile Sugar/Corn-Based Raw-Material Prices
Glucose feedstocks represent up to half of bulk mononucleotide production costs, yet U.S. corn futures swung 18% during 2025 after weather disruptions in Brazil and the Midwest[2]. Chinese producers faced a 12% cost spike when drought hit Heilongjiang Province, squeezing margins on long-term fixed contracts. European suppliers hedge sugar but paid 6–8% premiums over spot, eroding competitiveness versus Asian rivals. Alternative carbon sources such as methanol remain at pilot scale and await regulatory clearance for food-grade and pharma-grade use. Until diversification matures, producers remain exposed to commodity cycles.
*Our forecasts treat driver/restraint impacts as directional, not additive. The impact forecasts reflect baseline growth, mix effects, and variable interactions.
Nucleotides Market Segment Analysis
By Nitrogenous Base Class:
Pyrimidine Dominance Anchored in mRNA PlatformsPyrimidines accounted for 54.87% of 2025 demand, reflecting the central role of cytidine and uridine in in-vitro transcription for mRNA vaccines and therapeutics. Each conventional mRNA dose uses roughly 1 g of pyrimidines, so vaccine ramp-ups from 2020–2024 locked in multi-year contracts for GMP lots. Self-amplifying RNA formats lower per-dose nucleotide requirements but pipeline growth in gene therapies offsets volume moderation. Purines make up the remaining 45.13% and are especially important in antisense oligos where phosphorothioate-modified adenosine and guanosine enhance stability. Balanced 55:45 pyrimidine-to-purine ratios in infant formula maintain a stable floor for both classes.
In pharmaceutical supply chains, pyrimidines enjoy pricing premiums because GMP lines must mitigate cytidine deamination and uridine oxidation. Thermo Fisher’s 2025 upgrade added dedicated reactors for cytidine triphosphate to address this constraint. Chinese fermentation groups are adding uridine crystallization capacity to capture higher margins, but Western buyers still prefer suppliers with robust impurity profiles validated by EMA norms. As mRNA vaccines diversify into oncology and autoimmune indications, pyrimidine momentum is unlikely to relent.
By Nucleotide Type:
Oligonucleotides Lead Growth Amid Therapeutic MomentumOligonucleotides are set to expand at 8.22% CAGR through 2031 as 87 late-stage drug candidates advance toward approval. Mononucleotides held 33.40% of the nucleotides market size in 2025, buoyed by infant-formula mandates and growing livestock applications. Dinucleotides remain a flavor-modulating niche tied to savory snacks, while polynucleotides benefit from record NIH RNA-biology funding of USD 3.2 billion for fiscal 2025.
Custom oligo houses such as BioSpring can deliver modified strands in 2 weeks, outpacing legacy four-to-six-week cycles and commanding 25% price premiums. CDMO shortages continue, evidenced by 12-month reservation queues at several U.S. providers, nudging biotech firms to dual-source supply. Process-scale phosphoramidite synthesis still dominates, but enzymatic alternatives could reduce solvent waste, a shift investors track closely.

By Product Grade:
Food Grade Dominates but Pharmaceutical Margins Reshape StrategiesFood-grade material contributed 87.58% of revenue in 2025, anchored by long-standing infant-formula inclusion guidelines and antibiotic-free livestock feed. Diagnostic-grade dNTPs and modified nucleotides serve PCR and sequencing kits, markets sustained by 2.5 billion global PCR tests in 2025. Industrial grade intermediates stagnate as users seek higher consistency. Lab/diagnostic grade lots, though small in volume, capture 40-50% gross margins, motivating Asian bulk suppliers to invest in GMP suites. EMA guidance in 2024 mandating full impurity profiling further narrowed the field to 10–12 compliant vendors.
By Application:
Feed Additives Lead Share While Pharma Drives MarginFood and animal additives represented 48.62% of 2025 demand, underpinned by EU antibiotic restrictions and China’s formula mandate. The pharmaceutical segment, despite a lower share, will grow fastest on the back of four FDA approvals and a robust late-stage pipeline; each commercial antisense launch needs up to 10 kg of API. Discovery-phase CRISPR libraries and high-throughput screens form a high-margin niche where customers accept USD 50–200 per gram prices. Ajinomoto signaled it would reallocate 60% of capex to pharma-grade capacity over the next three years to capture this margin arbitrage. Volume will remain anchored in feed and food, but profit pools are migrating toward therapeutic uses.
Geography Analysis
APAC Nucleotides Market
Asia-Pacific owned 44.71% of global demand in 2025 and is projected to expand at 7.91% CAGR to 2031. China alone houses the majority of worldwide fermentation capacity, propelled by oligo therapy trials aligned with the country’s precision-medicine roadmap. South Korea’s CJ CheilJedang leverages continuous fermenters to serve both formula and biotech buyers. India focuses on diagnostic reagents yet domestic infant-formula demand is climbing as urban breastfeeding rates fall.
North America and APAC Nucleotides Market
North America is led by the largest oligonucleotide drug pipeline and premium organic-formula segments. Thermo Fisher’s Singapore plant was built to shorten lead times for U.S. clients and safeguard supply chains against trans-Atlantic disruptions. Canada’s formula regulations specify nucleotide levels 20% above Codex minima, resulting in high per-capita consumption. Mexico’s poultry sector is piloting nucleotide feed blends to secure antibiotic-free certifications for exports.
EMEA and South America Nucleotides Market
Europe’s demand is characterized by strict clean-label rules that elongate lead times. EMA traceability guidance favors regional suppliers able to document every step, benefitting BioSpring and French CDMOs. Germany, France, and the U.K. host 38 companies developing oligonucleotide drugs, concentrating GMP raw-material usage. The organic-formula boom lifted nucleotide shortages, driving spot premiums. South America and Middle-East and Africa represent lower demand, yet Brazil’s USD 3 billion annual shrimp disease losses spur nucleotide adoption, and Saudi Arabia’s Vision 2030 includes pharma-input localization that could open new capacity bids.
Regulatory Landscape
Nucleotide ingredients used in food, nutrition, and supplements cut across multiple regulatory regimes that depend on end use and product grade. In the European Union, new or non-traditionally consumed nucleotide ingredients can fall under the Novel Food framework set by Regulation (EU) 2015/2283, with authorizations administered through the Union list established via Implementing Regulation (EU) 2017/2470, which sets the entry and labeling bar.
For dietary supplements in the United States, FDA oversight of new ingredients relies on the New Dietary Ingredient (NDI) notification pathway under Section 413 of the FD&C Act, shaping how suppliers structure dossiers when positioning mononucleotides and related materials into supplement channels. Cross-border trade also introduces additional compliance layers, including EPA TSCA import-export requirements for chemical substance imports into the United States, and additional border scrutiny that can apply when shipments are treated as biological materials or research nucleic acids (including through U.S. Customs and Border Protection processes) along with country-specific biosecurity controls. In Australia, importing nucleic acid materials can require meeting Department of Agriculture, Fisheries and Forestry biosecurity import conditions, affecting lead times and documentation for lab and research grade nucleotides shipped into regulated facilities.
Value Chain Analysis
The value chain starts with feedstocks and core inputs, including glucose (from corn or sugar), nitrogen sources, and phosphate reagents, then moves into fermentation or chemical and enzymatic synthesis routes to produce nucleosides and nucleotides (including triphosphates). After that, upstream purification, crystallization, and drying feed into downstream grades and formats, with tighter controls as end markets move toward pharmaceutical and lab/diagnostic use.
Upstream phosphate exposure is a structural risk because phosphorus supply chains are concentrated in a limited set of producing countries, which can amplify cost volatility for producers of nucleotide triphosphates and related intermediates. For pharmaceutical and lab/diagnostic grades, the chain requires tightly controlled GMP operations, validated analytics, and batch release documentation (CoA, impurity profiling) before distribution. Midstream manufacturing splits between bulk fermentation-scale suppliers that serve food and feed grades and specialized CDMOs producing high-purity and modified nucleotides for oligonucleotide therapeutics and molecular diagnostics. Hongene Biotech Corporation is one example of vertical integration, combining raw material synthesis with GMP drug substance and drug product services to reduce handoffs and shorten timelines for pharma customers. Downstream, GMP-grade nucleotides often use cold-chain logistics (often around -20 degrees C), with lead times extending from 6 to 10 weeks for standard GMP dNTPs to 12 to 20 weeks for modified or labeled nucleotides, which supports long-term offtake agreements and dual sourcing among biotechnology hubs.
Competitive Landscape
The nucleotides market remains moderately consolidated. Chinese firms dominate food-grade output due to scale and integrated amino-acid operations that cut unit costs 20-30% below Western peers. Western companies specialize in pharma grades; their GMP certifications, validated analytical suites, and regulatory track record create customer stickiness. Strategic moves focus on vertical integration: Asian suppliers are installing downstream oligo lines, and Western CDMOs are securing upstream monomers via offtake agreements to hedge feedstock risks.
Technology leadership is shifting. Thermo Fisher’s automated synthesis reduced per-gram costs by 25% and trimmed lead times to two weeks, allowing it to capture urgent research orders. Patent filings for modified nucleotides hit 47 in 2025, signaling intensified competition for IP around phosphorothioate and 2'-O-methyl chemistries. Regulatory hurdles remain a moat: EMA’s 2024 impurity-profiling rule shrank the compliant supplier pool to a dozen. Precision-fermentation startups are experimenting with CO₂-derived feedstocks; commercial scale remains several years out, but incumbents monitor these pilots closely.
Nucleotides Industry Leaders
-
Ajinomoto Co., Inc.
-
CJ CheilJedang Corp.
-
Meihua Holdings Group Co., Ltd.
-
DAESANG
-
STAR LAKE BIOSCIENCE
- *Disclaimer: Major Players sorted in no particular order
Nucleotides Market Companies Covered in this Report
- AFINE CHEMICALS LIMITED
- Ajinomoto Co., Inc.
- Beijing Ruibo Biotechnology Co., Ltd.
- BioSpring Gesellschaft für Biotechnologie mbH
- CJ CheilJedang Corp.
- DAESANG
- F. Hoffmann-La Roche Ltd
- Fineton Industrial Minerals Limited
- Fufeng Group
- Jena Bioscience GmbH
- LGC Biosearch Technologies
- Meihua Holdings Group Co., Ltd.
- Merck
- Meridian Bioscience, Inc.
- Promega Corporation
- STAR LAKE BIOSCIENCE
- SynCrest Inc.
- Thermo Fisher Scientific Inc.
Market Opportunities and Future Outlook
A major whitespace centers on expanding pharma-grade and enabling-capability supply, including enzymes, building blocks, and integrated production workflows that connect upstream nucleotides to oligonucleotide and RNA therapeutic manufacturing. Recent, concrete capacity and capability moves highlight where investment is concentrating: Asymchem commissioned a fully integrated TIDES commercial supply matrix at its TJ4 site in April 2026 (including over 45,000 L SPPS reactor volume and stated oligonucleotide capacity of at least 180 mol per year), while TriLink (Maravai LifeSciences) opened a GMP enzyme manufacturing facility in Jupiter, Florida, in June 2026 to support integrated IVT supply from R&D to commercial scale. These initiatives align with customer demand for fewer handoffs between nucleotide inputs, enzymes, and downstream synthesis, particularly where quality systems and release timelines drive supplier selection.
Geographic diversification and regional manufacturing footprints also create opportunity for suppliers that can meet GMP and documentation requirements while reducing logistics friction. In Europe, BioSpring began construction activity (July 2025) for a large production facility for pharmaceutical nucleic acid APIs, and in the United Kingdom, 4basebio announced a leased innovation hub and manufacturing facility in Cambridge (March 2026) to expand synthetic DNA output used in research and quality applications. In India, Cohance Lifesciences reported progress (August 2025) on a cGMP oligonucleotide building block facility in Hyderabad with a planned annual capacity of 700 kg, indicating growing local availability of key building blocks and expanding supplier options beyond incumbent East Asian fermentation hubs.
Recent Industry Developments in Nucleotides Market
- June 2026: TriLink (Maravai LifeSciences) opened a GMP enzyme manufacturing facility in Jupiter, Florida, expanding in-house production capacity for enzymes used in RNA manufacturing workflows. The added capability supports integrated IVT supply from R&D through commercial scale, tightening control over quality and lead times for RNA-therapeutic customers that also consume high-purity nucleotide inputs.
- August 2025: Cohance Lifesciences reported progress on a cGMP oligonucleotide building block facility in Hyderabad, India, with a planned annual capacity of 700 kg. The project strengthens regional availability of critical inputs for oligonucleotide therapeutics and reduces dependence on a small set of established GMP building-block supply bases.
- July 2024: BioSpring inaugurated construction of a production facility on the Offenbach Innovation Campus in Germany for DNA- and RNA-based active pharmaceutical ingredients. The expansion increases European manufacturing depth for nucleic-acid therapeutics, which elevates demand for validated nucleotide and related building-block supply chains that can meet EMA-aligned impurity and documentation expectations.
Nucleotides Market Report Scope and Research Methodology
Market Definition and Coverage
We size the nucleotides market as the value of purified nucleotide ingredients that are produced and sold for use in pharma, nutrition, diagnostics, and animal feed formulations, across major regions.
Scope exclusions: finished drugs, infant formula products, and feed premixes that only contain nucleotides are excluded from the market value.
Segments Covered in This Report
- By Nitrogenous Base Class
- Pyrimidine
- Purine
- By Nucleotide Type
- Mononucleotides (NMPs)
- Dinucleotides
- Oligonucleotides
- Polynucleotides
- By Product Grade
- Food Grade
- Lab/Diagnostic Grade
- Industrial/Bulk Grade
- By Application
- Food and Animal Feed Additives
- Pharmaceutical
- Drug Discovery
- By Geography
- Asia-Pacific
- China
- Japan
- India
- South Korea
- ASEAN Countries
- Rest of Asia-Pacific
- North America
- United States
- Canada
- Mexico
- Europe
- Germany
- United Kingdom
- France
- Italy
- Rest of Europe
- South America
- Brazil
- Argentina
- Rest of South America
- Middle-East and Africa
- Saudi Arabia
- South Africa
- Rest of Middle-East and Africa
- Asia-Pacific
Data Sources, Market Sizing, and Validation
Desk Research
Desk research was used to set the market frame and build initial volume and price assumptions that can be checked later through interviews. Public sources that helped anchor the context included US FDA food ingredient and labeling references, EFSA scientific opinions, FAO food and agriculture statistics, and UN Comtrade trade statistics where relevant trade codes could be mapped to nucleotide ingredient flows.
We also reviewed practical supporting documents, such as company annual reports and investor presentations, association publications, and peer reviewed papers on fermentation and chemical synthesis routes. These sources helped us understand grade mix and typical end uses. For cross checking shipment signals and manufacturer footprints, we used approved paid subscriptions for company financials and intelligence, patents, and shipment level import export data in select countries when public series were not granular enough. The desk sources listed here are illustrative and not exhaustive, and many other sources were referenced for data collection, validation, and clarification.
Primary Interviews and Surveys
Primary work focused on validating what share of nucleotide demand comes from each major end use and how pricing shifts by grade (food, lab, and industrial) and by supply route. We spoke with a mix of manufacturers, distributors, and downstream formulators. We also pressure tested assumptions with technical experts who understand yields, purity specifications, and regional demand patterns across APAC, EMEA, and the Americas.
Distribution of primary research fieldwork respondents
| Company type | Respondent position | Region |
|---|---|---|
| Top tier: 28% | CXOs: 15% | APAC: 46% |
| Mid tier: 57% | Functional/Unit leaders: 34% | EMEA: 29% |
| Smaller Players: 15% | Managers: 51% | Americas: 25% |
Market-Sizing & Forecasting
Market sizing started with a top-down build where production and trade indicators, followed by application level usage rates, were used to reconstruct the addressable demand pool for purified nucleotide ingredients. Once the first view was formed, we corroborated it with selective bottom-up checks, such as rolling up a sample of supplier revenues by nucleotide ingredient lines and running channel checks on typical price bands, which are then used to adjust totals when gaps are found.
Key inputs that shaped the model included fermentation versus chemical synthesis capacity signals, grade mix (food, lab, industrial), end-use split across nutrition, pharma, diagnostics, and feed, and average selling price ranges by purity and pack form (solid versus liquid). We also tracked practical markers such as regional manufacturing footprint shifts, import dependence in smaller markets, and adoption of nucleotide fortification in nutrition products. These indicators tend to move volumes faster than headline GDP trends.
For forecasting, scenario analysis was used around two drivers that practitioners consistently raised, capacity additions and ASP progression by grade. Where bottom-up evidence was incomplete for smaller countries or niche lab applications, we applied conservative penetration assumptions and then re-checked them against trade flow direction and expert feedback so the final time series remains repeatable and auditable.
Data Validation & Update Cycle
Totals were validated through multiple checks so the model does not drift away from real-world signals. We compared outputs against independent indicators such as import export direction, known capacity changes, and typical grade pricing bands, and then investigated any sharp step changes before final sign-off.
A second analyst review was done for formulas, conversions, and year-on-year logic. Follow-up calls were triggered when a key assumption moved outside the ranges provided in the interviews. Reports are refreshed annually, with interim updates when material events affect capacity, pricing, or downstream demand. Before delivery, the model and key tables receive a fresh pass so clients get the latest updated view.
Mordor Intelligence's Nucleotides Market Sizing Compared With Other Published Estimates
Published market values for nucleotides often differ because the included product boundary is not consistent, and because each publisher makes different choices on what counts as an ingredient sale versus a finished product revenue. Differences also come from how average selling prices are built across grades and regions, and from how frequently older assumptions are refreshed.
The main gap comes from whether finished diagnostic products and other downstream formulations are counted in the same total, and from how lab-grade demand is treated when volumes are small and pricing is high. Some estimates apply one blended ASP across all regions or carry older price points forward, which can push the total up or down even when volumes look similar. The main gap comes from excluding finished formulas and kits, where Mordor Intelligence counts only purified nucleotide ingredients sold in food, lab, and industrial grades and then updates grade-level ASP ranges during validation.
Benchmark comparison
| Source | Market Size | Gaps in Research Methodology |
|---|---|---|
| Mordor Intelligence | USD 0.92 B (2026) | |
| Trade Publisher A | USD 0.67 B (2024) | Uses a straight-line CAGR style build with limited evidence on lab-grade volumes, and it appears to undercount smaller country demand where imports are the main supply route. |
| Industry Update B | USD 0.67 B (2024) | Mixes ingredient demand with broader diagnostics research categories and does not clearly separate purified nucleotide inputs from downstream product revenues, which can distort like-for-like comparisons. |
The table shows that the spread is mainly explained by scope choices (ingredient only versus ingredient plus downstream products) and by how prices are averaged across grades and regions. By keeping inputs tied to observable signals like capacity, trade direction, and grade-level pricing ranges, the final value stays easier to replicate and more stable when assumptions are revisited.
Key Questions Answered in the Report
How fast is the nucleotides market expected to grow through 2031?
The market is forecast to post a 7.49% CAGR, taking value from USD 0.92 billion in 2026 to USD 1.32 billion by 2031.
Which nucleotide class leads global demand today?
Pyrimidine derivatives held 54.87% share in 2025 due to heavy use in mRNA vaccine and infant-formula production.
What is driving the surge in pharmaceutical-grade nucleotide consumption?
Four FDA approvals in 2024 validated oligonucleotide therapies and, coupled with 1,261 RNA-based drugs in development, are pulling more GMP-grade supply into biopharma channels.
Why are clean-label nucleotide supplies tight in Europe?
Organic-formula growth, strict EU purity rules, and limited dedicated fermenter capacity have pushed lead times for certified batches to 20 weeks.