
Market Overview
| Study Period | 2020 - 2031 |
|---|---|
| Forecast Data Period | 2026 - 2031 |
| Base Year Market Size (2025) | USD 35.88 Billion |
| Market Size (2026) | USD 39.52 Billion |
| Market Size (2031) | USD 64.07 Billion |
| Growth Rate (2026 - 2031) | 10.15 % |
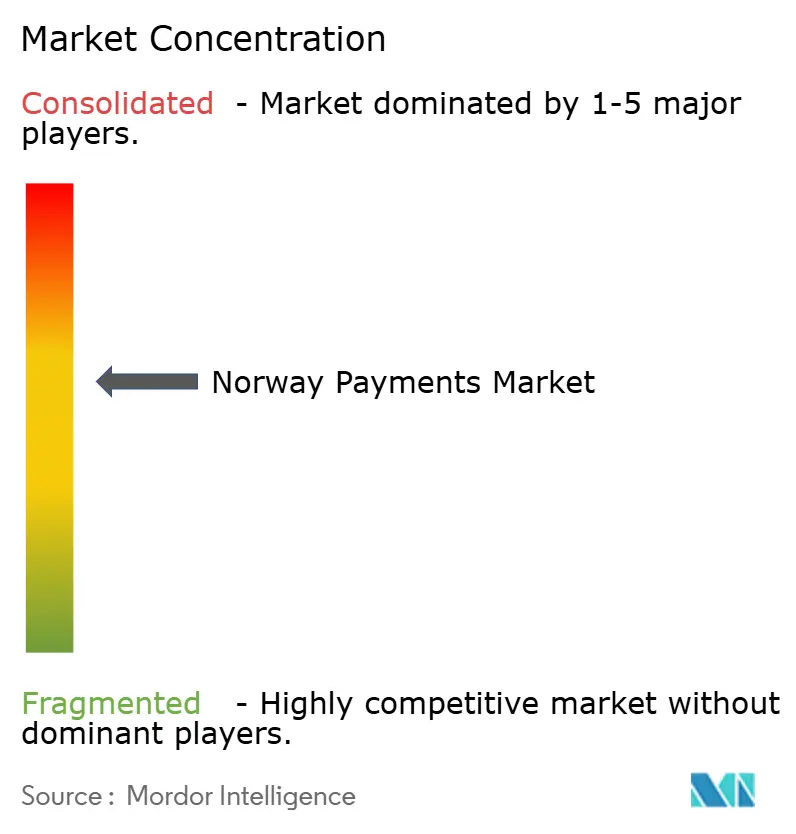
| Market Concentration | Medium |
Major Players *Disclaimer: Major Players sorted in no particular order Image © Mordor Intelligence. Reuse requires attribution under CC BY 4.0. | |
Norway Payments Market Analysis by Mordor Intelligence
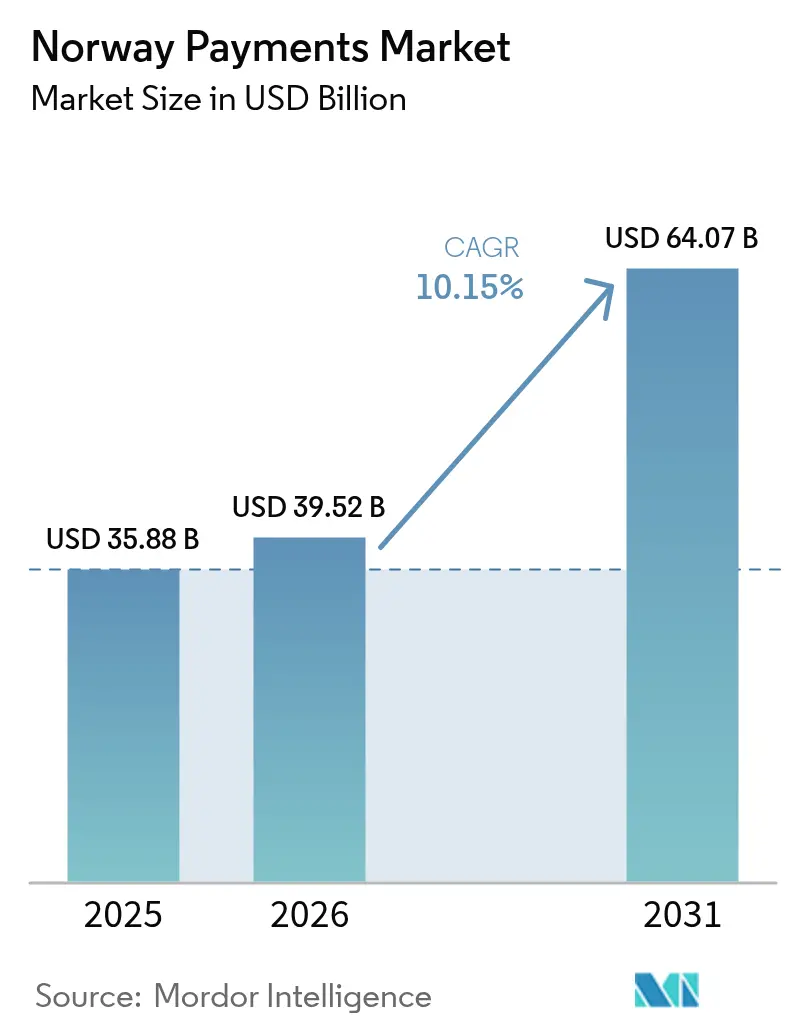
The Norway payments market size is expected to grow from USD 35.88 billion in 2025 to USD 39.52 billion in 2026 and is forecast to reach USD 64.07 billion by 2031 at 10.15% CAGR over 2026-2031. Digital wallet penetration, mandatory contact-less terminals and advanced open-banking rules have positioned the country as Europe’s most cash-averse society, with cash now used for only 3% of consumer transactions.[1]Norges Bank, “Web Report Financial Infrastructure 2025,” norges-bank.no Payments innovation is further propelled by the National Digitalisation Strategy 2024-2030, which directs EUR 90 million (USD 97 million) in annual funding to modernise real-time rails.[2]Norwegian Ministry of Digitalisation, “The Digital Norway of the Future: National Digitalisation Strategy 2024–2030,” regjeringen.no Rapid uptake of NFC services, widespread 5G coverage and a surge in fintech investments are expanding addressable volumes in the Norway payments market, while tighter cyber-fraud mandates and new cash-acceptance rules temper near-term margins. Consolidation around Vipps MobilePay and BankAxept underscores the duopolistic character of the Norway payments market, although interoperability requirements through 2027 preserve access for third-party acquirers.
Key Report Takeaways
- By mode of payment, point-of-sale led with 71.12% of Norway payments market share in 2025; digital wallets are projected to grow at 13.45% CAGR to 2031.
- By interaction channel, point-of-sale retained 71.02% revenue share in 2025, while e-commerce and m-commerce channels advance at 12.05% CAGR through 2031.
- By transaction type, consumer-to-business flows held 80.92% of the Norway payments market size in 2025; person-to-person payments expand fastest, at 10.85% CAGR to 2031.
- By end-user industry, retail accounted for 45.62% share of the Norway payments market size in 2025, whereas healthcare is set to grow at 13.2% CAGR through 2031.
Note: Market size and forecast figures in this report are generated using Mordor Intelligence’s proprietary estimation framework, updated with the latest available data and insights as of 2026.
Norway Payments Market Trends and Insights
Drivers Impact Analysis*
| Driver | (~) % Impact on CAGR Forecast | Geographic Relevance | Impact Timeline |
|---|---|---|---|
| Government push toward cashless & real-time payments | +2.8% | National, with early adoption in Oslo, Bergen, Trondheim | Short term (≤ 2 years) |
| Widespread smartphone & internet penetration | +2.1% | National, with rural areas catching up through 5G rollout | Medium term (2-4 years) |
| Mandated rollout of NFC/contactless terminals | +1.9% | National, with retail and hospitality sectors leading | Short term (≤ 2 years) |
| Open-banking regulation spurring fintech apps | +1.7% | National, with spillover effects to Nordic region | Medium term (2-4 years) |
| Consolidation of domestic wallets (Vipps merger effects) | +1.4% | Nordic region, with strongest impact in Norway, Denmark, Finland | Long term (≥ 4 years) |
| Gig-economy demand for instant salary payouts | +1.2% | Urban centers, expanding to suburban areas | Medium term (2-4 years) |
| Source: Mordor Intelligence | |||
Government Push Toward Cashless & Real-Time Payments
Annual public funding of EUR 90 million (USD 97 million) accelerates real-time rails, while Norway’s forthcoming entry into TARGET Instant Payment Settlement in 2028 will permit krone-euro instant clearing and reduce cross-border friction.[3]European Central Bank, “Norway Joins TIPS,” ecb.europa.eu Norges Bank is in parallel testing wholesale CBDC use cases, signalling readiness for post-cash settlement models. Mandatory access to cash up to NOK 20,000 mitigates resilience concerns, thereby sustaining consumer trust even as cash use plummets. Together these measures underpin the long-term expansion of the Norway payments market.
Widespread Smartphone & Internet Penetration
Universal broadband and 5G have unlocked biometric and offline payment features that widen digital acceptance in rural areas. Visa finds mobile-wallet usage at 94%, Europe’s highest.[4]Visa, “Decoding the European Mobile Wallet Evolution,” visa.co.uk Offline-first payment design, pioneered by Nordic operators, ensures continuity during outages and mitigates systemic risk, boosting the versatility of the Norway payments market.
Mandated Rollout of NFC/Contactless Terminals
EU Digital Markets Act forced Apple to unlock iPhone NFC, enabling Vipps MobilePay to launch “Tap with Vipps,” the world’s first native iOS alternative to Apple Pay. Hospitality chains such as King Foods and Frich’s cut queue times and labour costs by pairing contactless kiosks with unified POS stacks. Network effects from terminal upgrades speed wallet adoption and lift transaction velocity across the Norway payments market.
Open-Banking Regulation Spurring Fintech Apps
PSD2 opened account-to-account data but bank API pricing has triggered competition complaints from Neonomics. PSD3, effective 2026, will hard-wire dedicated fraud-mitigation APIs, creating fresh parity for third-party apps. As data portability improves, differentiated user journeys will attract new cohorts, bolstering volumes in the Norway payments market.
Restraints Impact Analysis*
| Restraint | (~) % Impact on CAGR Forecast | Geographic Relevance | Impact Timeline |
|---|---|---|---|
| Escalating cyber-fraud mitigation costs | -1.8% | National, with higher impact on smaller financial institutions | Short term (≤ 2 years) |
| High interchange & acquiring fees for SMEs | -1.2% | National, with disproportionate effects on rural and small businesses | Medium term (2-4 years) |
| Margin compression from intense PSP competition | -0.9% | National, with spillover effects to Nordic region | Medium term (2-4 years) |
| Data-privacy & localisation concerns | -0.7% | National, with EU regulatory compliance requirements | Long term (≥ 4 years) |
| Source: Mordor Intelligence | |||
Escalating Cyber-Fraud Mitigation Costs
DNB blocked NOK 2.1 billion (USD 190 million) of fraud in 2024, diverting capital toward defensive tooling that might otherwise fund product innovation. Finans Norge’s Cyber Threat Support Unit now coordinates shared intelligence, but Digital Operational Resilience Act compliance imposes fresh cost lines, denting smaller PSP margins and slowing new-service launches within the Norway payments market.
High Interchange & Acquiring Fees for SMEs
International scheme fees remain high for low-volume merchants, while mandatory cash-acceptance rules add parallel cost structures. These dual burdens deter SMEs from upgrading to premium payment functionality, keeping a portion of potential volumes out of the Norway payments market.
*Our forecasts treat driver/restraint impacts as directional, not additive. The impact forecasts reflect baseline growth, mix effects, and variable interactions.
Segment Analysis
By Mode of Payment: Digital Wallets Disrupt Card Dominance
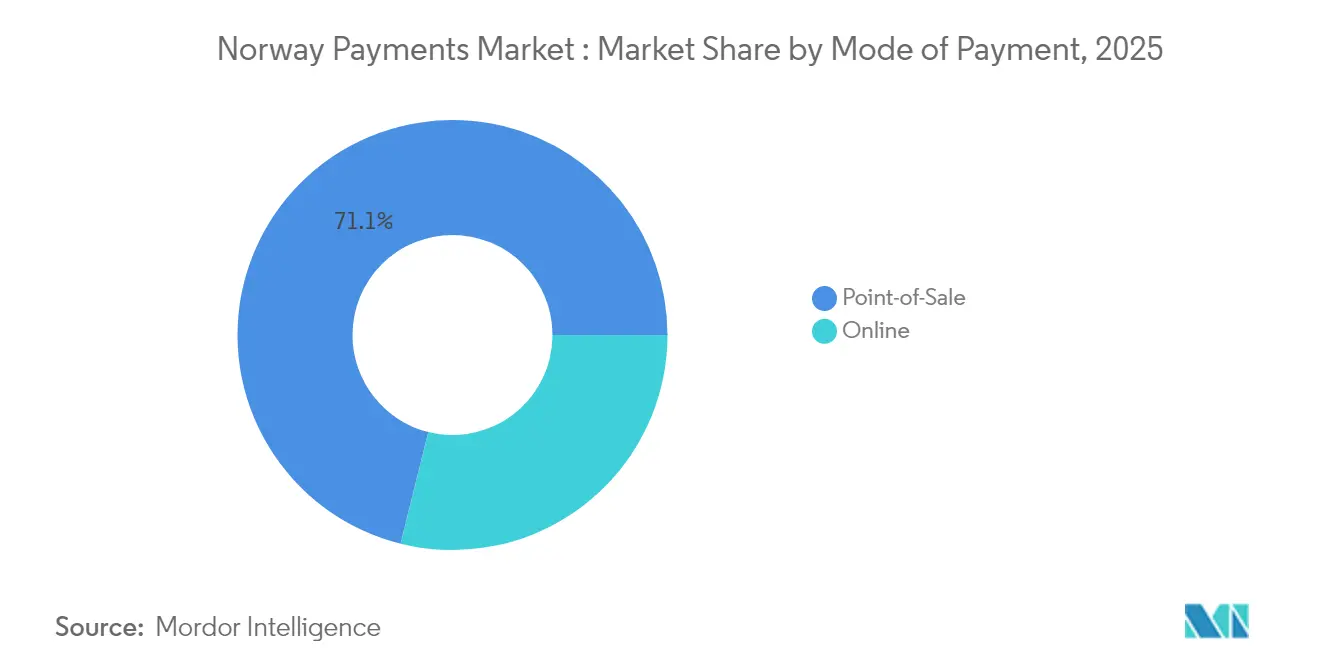
Point-of-sale held 71.12% Norway payments market share in 2025. Yet digital wallets and direct account transfers are rising at 13.45% CAGR, enabled by ISO 20022 migration that delivers richer data for consent-based analytics. The Norway payments market size attached to digital-first rails is forecast to eclipse USD 22.46 billion by 2031, reshaping acquirer economics.
Card issuers respond with value-added perks and tokenised credentials to defend spend levels, but “Tap with Vipps” on iOS cracks closed ecosystems and compresses issuer lock-in. Cash slides below 3% of volume as consumer trust migrates to biometrically-authenticated wallets. Integration of loyalty, BNPL and P2P in single super-apps deepens engagement and magnifies lifetime value within the Norway payments market.


By Interaction Channel: E-commerce Momentum Challenges Physical Dominance
The Norway payments market size transacted through e-commerce and m-commerce grows at 12.05% CAGR, chipping away at physical-only channels that keep 71.02% share today. Logistics-first retailers like Oda already service 70% of online grocery demand, demonstrating scalability of cold-chain automation in Norway’s dispersed geography.In-store merchants counter with omnichannel check-out, click-and-collect and self-checkout kiosks that tether inventory to cloud POS. The Norway payments market dovetails with civic digitisation, as tax, toll and health portals adopt the same rails consumers use for shopping. Mobile commerce further blurs lines, embedding purchase and payment links inside social feeds, live streams and gaming environments.
By Transaction Type: P2P Payments Accelerate Beyond C2B Foundation
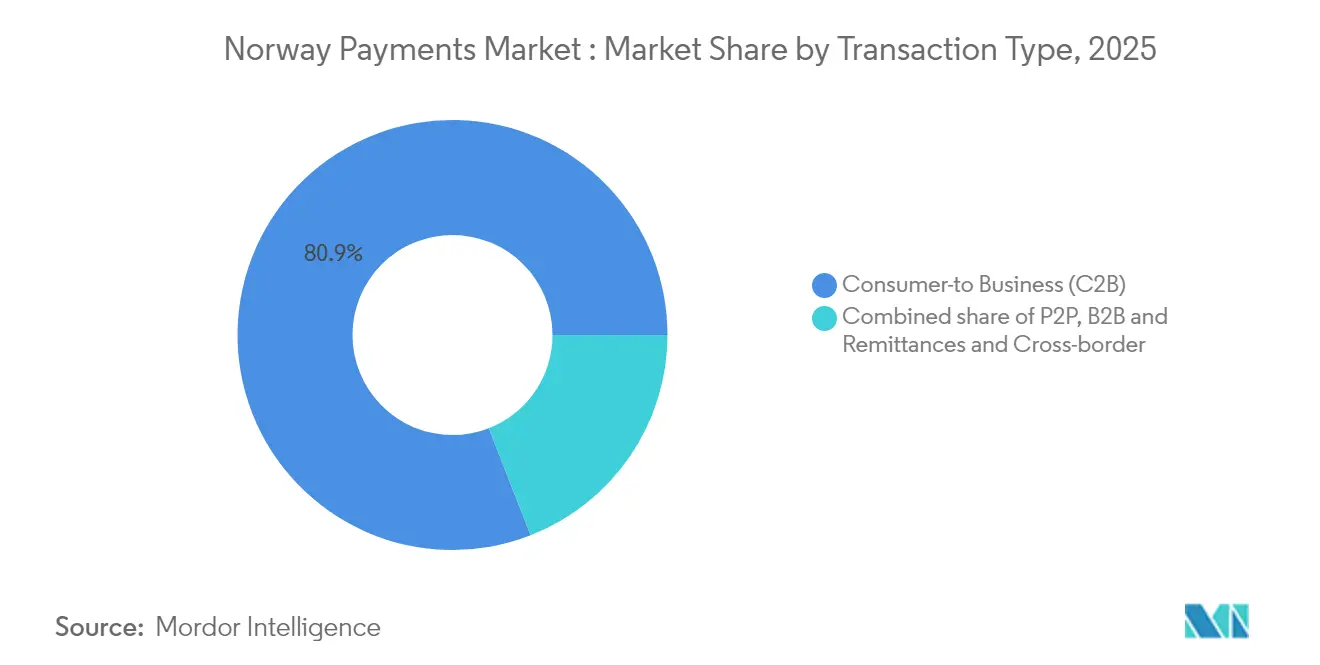
Consumer-to-business flows deliver 80.92% of Norway payments market size, underpinned by high per-capita retail spend and universal card ownership. Person-to-person transfers, however, climb 10.85% yearly as cultural shifts orient money exchange around chat-like experiences. Instant salary schemes for gig workers accelerate demand, creating overlap between payroll, remittance and social-transfer use cases.
Business-to-business corridors move slower due to compliance workflows, but TARGET Instant Payment Settlement will shave cross-border latency, unlocking fresh liquidity benefits for SMEs by 2028. Regulatory commitments to non-discriminatory access keep P2P rails open, allowing new overlay services such as group gifting and escrow inside the Norway payments market.
By End-user Industry: Healthcare Innovation Outpaces Retail Maturity
Retail still contributes 45.62% Norway payments market share, reflecting mature POS coverage and omnichannel expansion. Yet healthcare leads growth at 13.2% CAGR, fuelled by USD 47 billion in national health spending, extensive telemedicine adoption and e-prescription roll-outs.
Hospitals now integrate payment APIs into patient portals for co-pays and teleconsult fees, while pharmacies pilot automatic recurring billing for chronic medications. Government utilities digitise billing, adding stable throughput. Entertainment, gaming and streaming subscriptions surge as well, embedding micro-transactions and fractional usage models that lift ARPU across the Norway payments market.Geography Analysis
Norway’s domestic arena remains the epicentre of the Norway payments market, boasting a 94% mobile-wallet adoption rate, the world’s highest. Oslo, Bergen and Trondheim spearhead pilot programmes for CBDC retail testing, while remote northern counties benefit from 5G-enabled offline settlement to assure network resilience. The Nordic region offers spill-over potential through the consolidated Vipps MobilePay user base, yet P27’s uncertain licence status pauses broader cross-border clearing ambitions.
EEA alignment forces Norway to adopt EU payment directives. The Digital Markets Act has already reshaped NFC competition dynamics; PSD3 will layer tougher AML and liability provisions, pushing banks to upgrade fraud orchestration engines ahead of continental peers. TARGET Instant Payment Settlement integration links Norwegian kroner with euro real-time rails by 2028, positioning exporters for faster receivables and drawing foreign PSPs into the Norway payments market.
Outside Europe, Norwegian PSPs explore selective expansion where digital infrastructure readiness mirrors domestic standards—namely Singapore, Australia and the Gulf. Nordic diaspora and shared SEPA SCT Inst adherence ease corridor testing. Currency volatility risk remains elevated due to the krone’s float, but advanced hedging tools embedded in corporate accounts moderate exposure for mid-tier exporters within the Norway payments market.
Regulatory Landscape
Norway aligns its payments rules with the EEA framework. Finanstilsynet supervises payment service providers and enforces requirements around security and operational risk, while Norges Bank oversees the payment system and operates the Norges Bank Settlement System (NBO) under the Payment Systems Act. PSD2 has been implemented in Norway since April 1, 2019, formalizing account information and payment initiation services and shaping how banks expose APIs to third parties.
Infrastructure policy has increasingly emphasized resilience and interoperability, including Norges Bank engagement with the Eurosystem on next-generation settlement connectivity. Norges Bank signed an agreement with the European Central Bank on November 28, 2024 to use TIPS for instant payments in NOK, and in February 2025 it commenced formal discussions with the ECB on potential participation in the T2 settlement platform. This points to an evolving regulatory-operational pathway that affects clearing, settlement, and participant readiness across domestic and cross-border NOK flows.
Value Chain Analysis
The Norway payments value chain begins with end users (consumers, merchants, corporates, and public-sector billers) initiating transactions via POS terminals, e-commerce checkouts, and in-app wallet experiences. Merchant acquirers and PSPs enable these flows and route transactions through domestic and international schemes. In domestic acceptance, BankAxept supports debit acceptance and Vipps MobilePay supports wallet-led P2P and merchant payments, while Visa and Mastercard remain central for international card routing. Settlement and liquidity management are anchored in bank-led clearing arrangements and Norges Bank through NBO.
Upstream enablers include identity and authentication (including bank eID flows and strong customer authentication), fraud and cyber controls coordinated across the sector (including Finans Norge initiatives), and infrastructure governance through industry forums such as Betalingsforumet. Modernization of clearing and settlement is a key linkage point, with Norges Bank moving NBO to ISO 20022 in 2025 and pursuing deeper integration with Eurosystem platforms, including the TIPS agreement signed in November 2024 and T2 participation discussions initiated in February 2025. Acceptance dynamics keep pulling through the chain, with mobile payments in shops reaching 27% of terminal transactions in 2025, up from 12% in 2024, which reinforces demand for tokenization, device-level NFC access, and omni-channel orchestration across merchants and PSPs.
Competitive Landscape
Vipps MobilePay and BankAxept dominate domestic acceptance rails, while Visa and Mastercard control international scheme routing. Extended merger undertakings oblige Vipps to offer transparent pricing and open APIs, sustaining contestability through 2027. DNB leverages scale to run 392 million daily payment instructions, monetising data-rich ISO 20022 messages for treasury analytics.
Fintech challengers pursue niche penetration; Neonomics offers single-API account aggregation and wages regulatory warfare to dismantle gatekeeping. Sokin gains foothold through its Settle acquisition, targeting remittances and SME multicurrency accounts. International processors such as Worldline pair with incumbents on instant-payment front-ends, securing relevance as the Norway payments market shifts to real-time settlement.
Security posture now differentiates leaders: Thales supplies HCE tokenisation and biometric authentication, enabling Vipps’ iOS NFC breakthrough that reached 1 million users in five months. Shared cyber-intelligence via Finans Norge counters sophisticated attack vectors, though smaller acquirers struggle to fund zero-day response capabilities. Overall, the Norway payments market rewards scale, trust and innovation cadence.
Norway Payments Industry Leaders
Vipps AS
Bank Norwegian
Klarna Bank AB
PayPal Holdings Inc.
Nets A/S (Nexi Group)
- *Disclaimer: Major Players sorted in no particular order

Market Opportunities and Future Outlook
Mandated business digitalization is creating a measurable whitespace in payment-adjacent workflows that connect invoicing, reconciliation, and settlement. In June 2026, the Norwegian Government enacted changes to the Bookkeeping Act that mandate B2B e-invoicing from January 1, 2027 and digital bookkeeping from January 1, 2030. This shifts merchants and corporates toward standardized e-invoice formats and tighter system integrations, benefiting PSPs, banks, and software providers offering embedded payments, automated matching, and compliant audit trails.
On rails modernization, Norges Bank continues to operationalize interoperability and resilience upgrades that shape product design for instant payments and cross-border NOK flows. The 2026 Financial Infrastructure Report confirmed stable operations of NBO and reported average daily turnover of NOK 359 billion in 2025, while prior actions such as the November 28, 2024 agreement with the ECB to use TIPS for instant payments in NOK and the 2025 ISO 20022 transition expand the addressable set of data-rich payment services. These include fraud controls, corporate treasury reporting, and API-based overlays, which translate into near-term opportunity across ISO 20022-native analytics, real-time liquidity tools for SMEs, and merchant solutions that unify POS, wallet acceptance, and invoice-to-pay experiences under the compliance timetable.
Recent Industry Developments
- May 2026: Vipps MobilePay reported it was close to profitability after a strong turnaround, highlighting a sharper focus on core wallet economics and operating discipline. The update supported continued investment in high-usage use cases such as in-store contactless and P2P without relying on a broad, loss-making product footprint.
- April 2026: Vipps announced its contactless in-store payment solution surpassed 100 million tap transactions since its wider launch in September 2025. The milestone reinforced wallet-led contactless as a mainstream tender type in Norwegian stores, strengthening merchant acceptance incentives and competitive pressure on global mobile wallets. Vipps is expanding integration with BankAxept to deepen acceptance at point-of-sale across retail channels.
- February 2025: Norges Bank commenced formal discussions with the European Central Bank on potential participation in the TARGET2 settlement platform. This marks a strategic step toward deeper cross-border settlement interoperability for NOK transfers and aligns Norges Bank's road map with the Eurosystem's modernization agenda. The discussions set the stage for future interoperability projects and potential shared liquidity and settlement efficiency improvements across domestic and cross-border flows.


Research Methodology Framework and Report Scope
Market Definition and Coverage
For this report, the Norway payments market is defined as the value of payment transactions executed in Norway through regulated payment rails, including cards, bank transfers, direct debits, and digital wallet initiated payments across online and offline channels.
Scope exclusions: Crypto asset transfers and wholesale interbank settlement balances are not included in this market sizing.
Segmentation Overview
- By Mode of Payment
- Point-of-Sale
- Card (Debit, Credit, Pre-paid)
- Digital Wallets (Apple Pay, Google Pay, Interac Flash)
- Cash
- Other POS (Gift-cards, QR, Wearables)
- Online
- Card (Card-Not-Present)
- Digital Wallet and Account-to-Account (Interac e-Transfer, PayPal)
- Other Online (COD, BNPL, Bank Transfer)
- Point-of-Sale
- By Interaction Channel
- Point-of-Sale
- E-commerce/M-commerce
- By Transaction Type
- Person-to-Person (P2P)
- Consumer-to-Business (C2B)
- Business-to-Business (B2B)
- Remittances and Cross-border
- By End-user Industry
- Retail
- Entertainment and Digital Content
- Healthcare
- Hospitality and Travel
- Government and Utilities
- Other End-user Industries
Data Sources, Market Sizing, and Validation
Desk Research
Desk research helped us set the basic boundaries of what a payment is in Norway and how the main rails are measured. Public sources were used to anchor key totals and trends, such as Norges Bank retail payment services publications, Statistics Norway macro and household indicators, and guidance and statistics from the Norwegian Financial Supervisory Authority on payment institutions.
To make the model practical, we also leaned on international reference series where Norway is consistently tracked, such as BIS payment statistics, European Central Bank payments reporting for comparable definitions, and relevant EU regulatory texts (PSD2 and related technical standards) that influence reporting and fraud controls. Company annual reports, investor presentations, and reputable business press were used to sense-check pricing changes and adoption signals, and a paid subscription for company financials, news and financial intelligence, and patent databases was used selectively to validate revenue exposure and product direction. These sources are not exhaustive, and many other public and paid references were reviewed for data collection, validation, and clarification.
Primary Interviews and Surveys
We interview Norwegian payment issuers, acquirers, merchants, processors, technology providers, and regulators through expert interviews and surveys. CXOs, functional leaders, and managers help validate transaction growth, average ticket movement, channel mix, pricing, and missing data, with follow-up checks used to resolve gaps and triangulate the final model.
Distribution of primary research fieldwork respondents
| Company type | Respondent position |
|---|---|
| Top tier: 30% | CXOs: 18% |
| Mid tier: 50% | Functional/Unit leaders: 32% |
| Smaller Players: 20% | Managers: 50% |
Market-Sizing & Forecasting
Market sizing was built using a top-down approach where official payment statistics and reported transaction values were used to reconstruct the total spend moving through Norway payment rails, and then the revenue pool was derived using blended pricing and fee logic by rail and channel. To keep the numbers realistic, selective bottom-up checks were run using sampled provider revenue exposure, merchant category level channel checks, and volume times average fee calculations where inputs were available.
Inputs that mattered most included total transaction value by instrument (cards, credit transfers, direct debits), online versus in-store mix, wallet usage trends, interchange and acquiring fee direction, fraud and chargeback cost pressure, and the share shift between domestic and international card schemes. For forecasting, we relied on scenario analysis supported by expert views on consumer spending, e-commerce growth, and the pace of instant payments and wallet adoption, which were then applied to instrument level growth curves. Where company disclosures did not split Norway specific payments revenue cleanly, gaps were handled through proportional allocation using disclosed regional mix, product mix, and observed activity indicators, and then reviewed with interview feedback.
Data Validation & Update Cycle
Outputs were cross-checked against independent signals such as central bank transaction value series, macro consumption indicators, and reported payment income pools where available. When a variance appeared, the driver was traced back to one assumption (for example, channel mix, fee rate, or instrument substitution) and then reworked before final sign-off.
A multi-step internal review was followed so calculations, units, and currency timing were consistent across the model. Interviews are re-opened when a material change is observed, such as a major rule update, pricing shift, or a structural move in wallet or instant payment adoption. Reports are refreshed annually, with interim updates for major events, and a final pre-delivery pass is completed so the latest public data are reflected.
Mordor Intelligence's Norway Payments Market Sizing Compared With Other Published Estimates
Published numbers for Norway payments do not always line up because the word payments can mean different things, and because some publishers size transaction value while others size provider revenues. Differences also show up when currency timing is handled differently or when the update cycle does not capture recent shifts in wallet usage and instant transfers.
Crypto asset transfers sit outside Mordor Intelligence's scope for Norway payments, which removes a fast moving value pool that some broader digital payments write-ups occasionally blend in with regulated rails. The spread can also come from whether cross-border flows are counted only when settled through licensed banks or payment institutions, and whether fee progression is modeled as stable, falling, or rising with fraud and compliance costs.
Benchmark comparison
| Source | Market Size | Gaps in Research Methodology |
|---|---|---|
| Mordor Intelligence | USD 35.88 B (2025) | |
| Regional Consultancy A | USD 28.40 B (2026) | Uses a narrower revenue-only view that leans on provider reported income and standard fee bands, which can understate total value moving through regulated rails when instrument mix shifts quickly. |
| Trade Journal B | USD 44.10 B (2025) | Leans toward a broader definition that can blend adjacent digital value pools and apply higher implied fee rates, and it may also use different USD conversion timing for NOK-denominated series. |
Across the three figures, the main pattern is that totals rise when adjacent value pools or higher fee assumptions are included, and they fall when only a tighter revenue subset is counted. Our approach keeps the sizing traceable to payment instrument activity and fee logic that can be rechecked year to year using repeatable steps.


Key Questions Answered in the Report
How large is the Norway payments market today and what is its growth outlook?
The market stands at USD 39.52 billion in 2026 and is forecast to expand to USD 64.07 billion by 2031, reflecting a 10.15% CAGR.
What portion of everyday transactions in Norway are still made with cash?
Cash now represents just 3% of all payment volumes, confirming Norway’s position as Europe’s most cash-averse economy.
Which payment channel is growing fastest in Norway?
Digital wallets and account-to-account transfers are expanding at a 13.45% CAGR through 2031, eroding the historical dominance of point-of-sale cards.
What government policies are driving rapid payment digitalisation?
The National Digitalisation Strategy 2024-2030 directs EUR 90 million (USD 97 million) in annual funding toward real-time rails and mandates instant settlement for public-sector payments.
How did Norway become the first country with an Apple Pay alternative on iPhone?
The EU Digital Markets Act forced Apple to open iPhone NFC technology, enabling Vipps MobilePay to launch “Tap with Vipps” in December 2024.
Who controls the core payment infrastructure in Norway?
Domestic providers Vipps MobilePay and BankAxept manage essential rails, while Visa and Mastercard dominate cross-border scheme routing; open-access conditions remain in force until 2027.
Page last updated on:


 Your data is secure and never sold or shared.


