
Market Overview
| Study Period | 2020 - 2031 |
|---|---|
| Forecast Data Period | 2026 - 2031 |
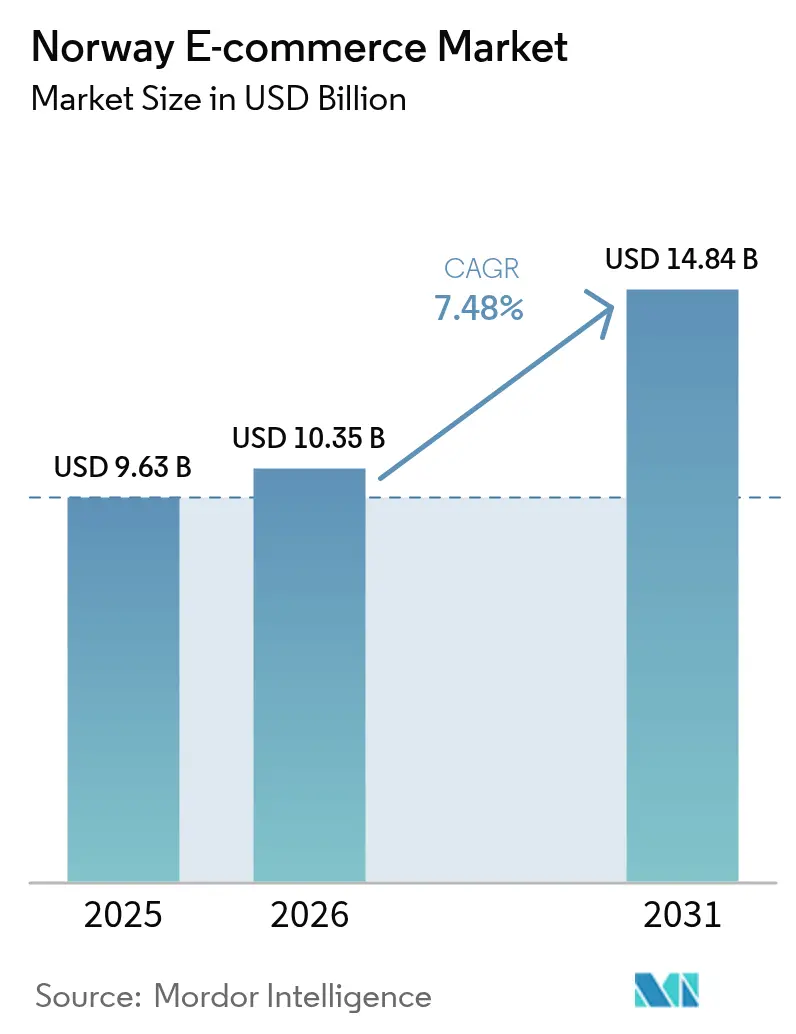
| Base Year Market Size (2025) | USD 9.63 Billion |
| Market Size (2026) | USD 10.35 Billion |
| Market Size (2031) | USD 14.84 Billion |
| Growth Rate (2026 - 2031) | 7.48 % |
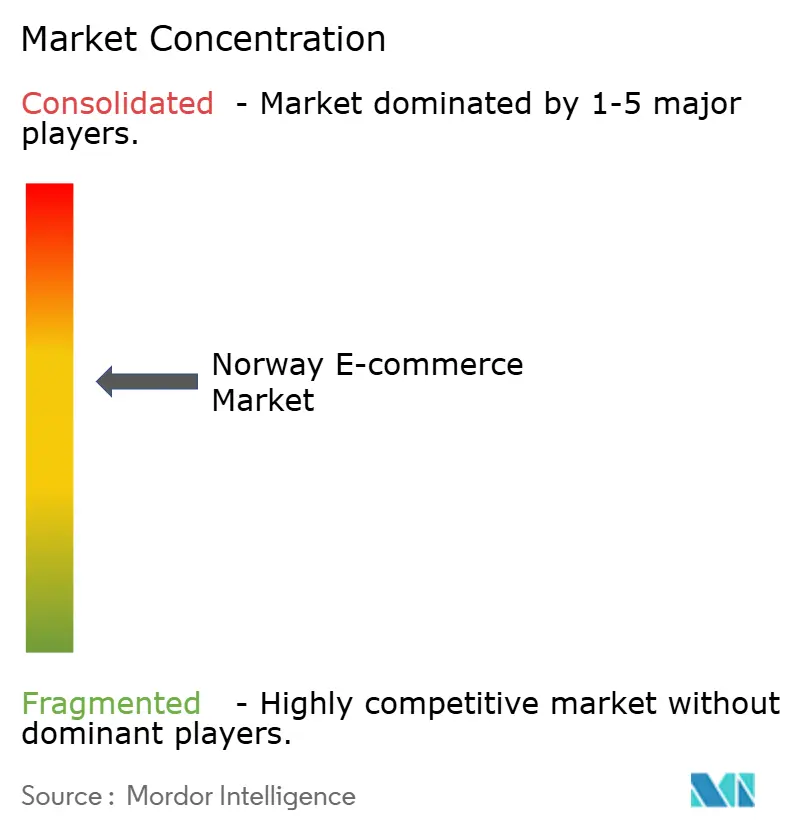
| Market Concentration | Medium |
Major Players *Disclaimer: Major Players sorted in no particular order Image © Mordor Intelligence. Reuse requires attribution under CC BY 4.0. | |
Norway E-commerce Market Analysis by Mordor Intelligence
The Norway e-commerce market size was valued at USD 9.63 billion in 2025 and estimated to grow from USD 10.35 billion in 2026 to reach USD 14.84 billion by 2031, at a CAGR of 7.48% during the forecast period (2026-2031). Continuous public-sector investments in digital infrastructure, 98% internet penetration, and sustained consumer spending underpin this trajectory.[1] The government’s NOK 2.8 billion (USD 747 million) fiber program boosts remote connectivity, while 87% of domestic online sales already accrue to Norwegian stores, evidencing strong local capabilities. Mobile commerce, commanding two-thirds of sales, benefits from smartphone penetration exceeding 95% and a growing appetite for seamless “green delivery” options. Payment innovation is reshaping checkout experiences as Buy-Now-Pay-Later (BNPL) expands faster than any other method, driven by Klarna’s 18% domestic share. Currency volatility and high last-mile costs in sparsely populated areas temper full-market conversion but are mitigated by EU VAT One-Stop Shop (OSS) reforms that simplify cross-border compliance for small sellers.[2]
Key Report Takeaways
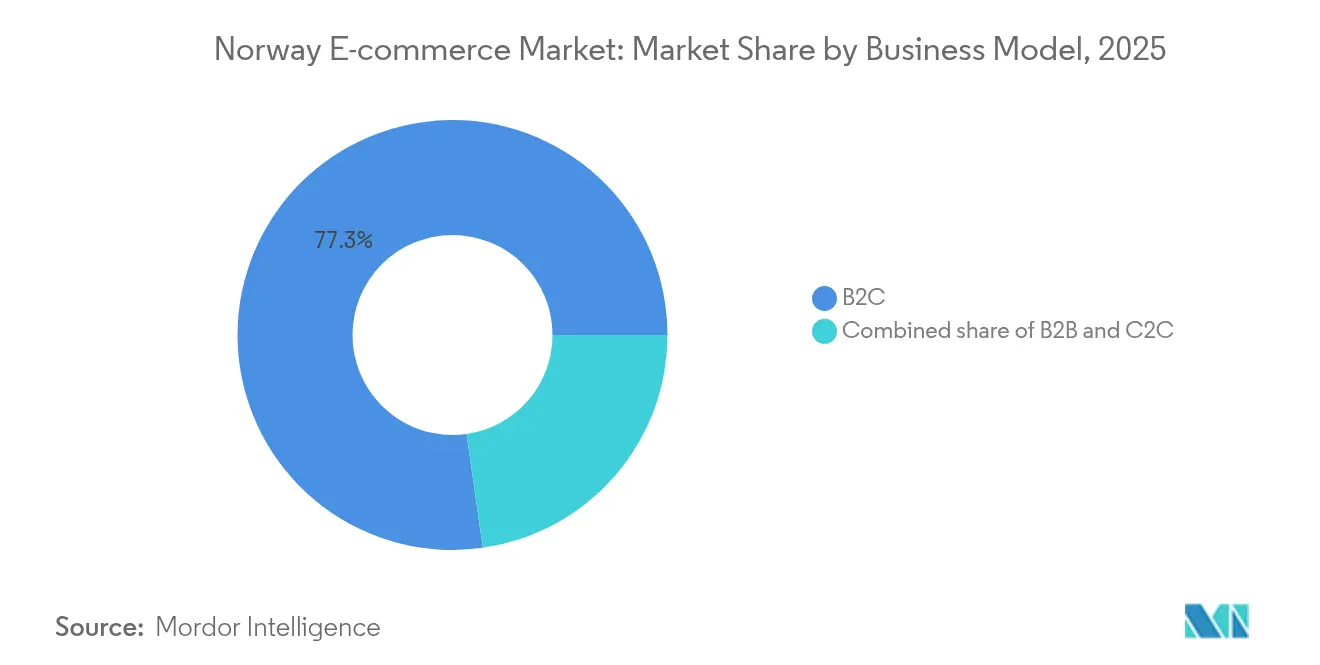
- By business model, B2C retained 77.25% of Norway e-commerce market share in 2025, while C2C is accelerating at a 12.05% CAGR through 2031.
- By device type, smartphones secured 65.40% revenue share in 2025; other connected devices are forecast to expand at a 10.05% CAGR to 2031.
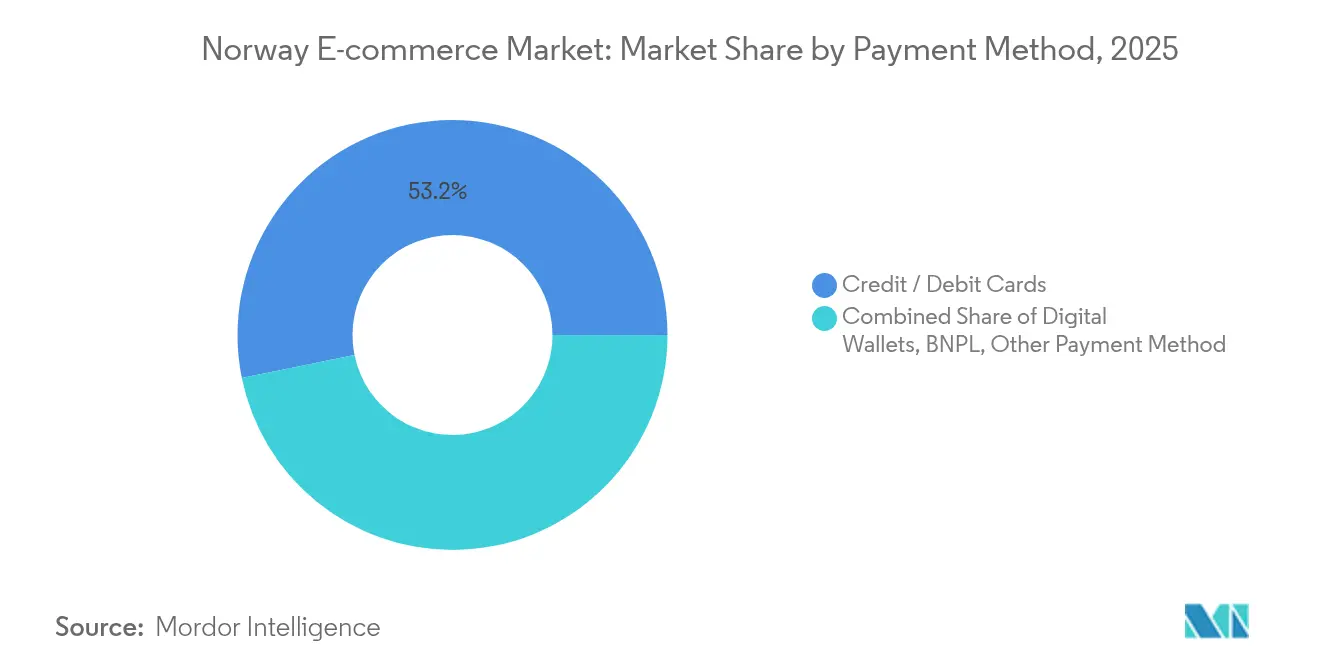
- By payment method, card payments held 53.20% share of the Norway e-commerce market size in 2025, but BNPL is scaling at a 13.15% CAGR through 2031.
- By B2C product category, fashion & apparel contributed 28.55% of the Norway e-commerce market size in 2025; food & beverages is advancing at a 14.1% CAGR through 2031.
Note: Market size and forecast figures in this report are generated using Mordor Intelligence’s proprietary estimation framework, updated with the latest available data and insights as of 2026.
Norway E-commerce Market Trends and Insights
Drivers Impact Analysis*
| Driver | (~) % Impact on CAGR Forecast | Geographic Relevance | Impact Timeline |
|---|---|---|---|
| Government-backed High-Speed Fibre Roll-out to Remote Regions | +1.2% | National, with early gains in northern regions | Medium term (2-4 years) |
| Growing Popularity of Buy-Now-Pay-Later among Gen-Z & Millennials | +0.9% | National, concentrated in urban areas | Short term (≤ 2 years) |
| EU Cross-border VAT One-Stop Shop (OSS) Simplifying Compliance for SMEs | +0.7% | National, with spillover to EU markets | Short term (≤ 2 years) |
| Surge in Domestic Warehousing Automation to Cut Delivery Lead-times | +0.8% | National, focused on Oslo and Bergen regions | Medium term (2-4 years) |
| Booming Adoption of Sustainable "Green Delivery" Preferences | +0.6% | National, strongest in urban centers | Long term (≥ 4 years) |
| Source: Mordor Intelligence | |||
Government-backed High-Speed Fibre Roll-out Drives the Market
Extending submarine cables to Svalbard and Jan Mayen broadens nationwide digital inclusion, transforming previously underserved households into viable e-shoppers. Space Norway’s oversight ensures strategic control and commercial participation, while the Ministry of Digitalisation’s 2024-2030 roadmap targets 100% gigabit coverage ahead of EU objectives. The fibre buildout complements hyperscale investments such as CoreWeave’s USD 2.2 billion AI campus, collectively raising cloud capacity and network resilience. As infrastructure bottlenecks ease, the Norway e-commerce market deepens outside metropolitan areas through reliable access, higher order frequency, and greater SKU diversity. Retailers that align expansion roadmaps with new coverage zones gain first-mover advantage in customer acquisition.
Growing Popularity of Buy-Now-Pay-Later among Gen-Z & Millennials
BNPL reshapes checkout economics by deferring cash outflow for consumers and lifting basket values for merchants. Klarna invoices feature on 39.2% of Norwegian online storefronts, reflecting deep trust and cultural proximity with Sweden. Two and Avarda’s 2025 white-label launch signals convergence of B2B and B2C BNPL rails, addressing a combined Nordic opportunity of USD 41.47 billion by 2025. Local payment methods are expected to command 59% of transactions by 2028, eroding credit card dominance to 30%. Merchants integrating BNPL early in the customer journey capture incremental sales without heightening fraud exposure, thus strengthening loyalty among digitally native cohorts who value transparency and instant approval flows. Consequently, the Norway e-commerce market benefits from higher conversion in discretionary categories such as fashion and electronics.
EU Cross-border VAT One-Stop Shop Simplifies SME Compliance
The OSS regime enables Norwegian sellers to file a single EU VAT return, eliminating the historical need for multiple country registrations. Since the 2024 VOEC upgrade, goods under NOK 350 (USD 93) are no longer duty-free, but VAT is settled at checkout, improving customer transparency while preserving fiscal neutrality. SMEs, which form the backbone of the Norway e-commerce market, report lower administrative costs and faster customs clearance. The alignment with Oslo’s goal of becoming the world’s most digitised capital boosts confidence for micro-exporters seeking Europe-wide reach. Cross-border sales already account for 37.5% of turnover, indicating sizeable headroom for further growth under simplified rules.
Surge in Domestic Warehousing Automation Cuts Lead-times
AutoStore maintains a 97% global share of cubic storage automation and anticipates USD 575–600 million in 2024 revenue, underscoring Norway’s technology leadership.[3] Dense cube storage reduces picking times, frees floor space, and lowers energy use—critical advantages in the high-cost Norwegian labor market. Retailers deploying goods-to-person systems in Oslo and Bergen reduce same-day delivery cut-offs by nearly two hours, enhancing competitiveness with international platforms. StrongPoint’s focus on e-grocery order picking technology further shortens fulfilment cycles. These innovations align with consumer expectations for rapid, predictable delivery and minimize CO₂ emissions per parcel, reinforcing Norway’s sustainability ethos.
Restraints Impact Analysis*
| Restraint | (~) % Impact on CAGR Forecast | Geographic Relevance | Impact Timeline |
|---|---|---|---|
| High Last-mile Costs in Sparsely Populated Northern Regions | -0.8% | Northern Norway, rural areas | Long term (≥ 4 years) |
| Stringent Data-Privacy Norms Limiting Personalised Marketing | -0.5% | National, EU-aligned regulations | Medium term (2-4 years) |
| Persistent Returns-Logistics Burden in Fashion Category | -0.4% | National, concentrated in fashion segment | Medium term (2-4 years) |
| Dependence on Foreign Marketplaces Elevates Currency-Risk Exposure | -0.3% | National, affecting cross-border transactions | Short term (≤ 2 years) |
| Source: Mordor Intelligence | |||
High Last-mile Costs in Sparsely Populated Northern Regions
Delivering to remote settlements where population density falls below economic thresholds inflates logistics outlays by more than 20% of average order value. Light electric freight vehicles excel in Oslo but lose efficiency over Arctic distances. Although PostNord’s locker rollout eases urban congestion, scaling that model to the north requires capital that current parcel volume cannot justify. Many merchants institute delivery surcharges or higher free-shipping thresholds in these zones, slowing adoption and constraining the total Norway e-commerce market addressable base. Collaborative delivery hubs and state subsidies could ease the burden yet remain nascent.
Stringent Data-Privacy Norms Limiting Personalised Marketing
Norway enforces GDPR rigorously, and 5.3% of citizens avoid digital services due to privacy concerns. The digital strategy prioritizes “privacy-by-design,” compelling retailers to invest in consent-management platforms before deploying advanced personalisation engines. Email segmentation, product recommendations, and look-alike profiling face strict lawful-basis tests, resulting in higher acquisition costs and reduced remarketing ROI. Domestic firms lean toward first-party data accumulation and contextual targeting, which lengthen payback periods on marketing spend. In turn, adoption of AI-driven commerce tools lags peers in more permissive jurisdictions, slightly dampening Norway e-commerce market momentum.
*Our forecasts treat driver/restraint impacts as directional, not additive. The impact forecasts reflect baseline growth, mix effects, and variable interactions.
Segment Analysis
By Business Model: B2C Stability Confronts C2C Acceleration
The B2C segment contributed 77.25% to the Norway e-commerce market in 2025, supported by omnichannel rollouts from legacy retailers and trusted local payment options. Heavyweights such as KID ASA expanded online revenue 17.6% year on year, illustrating how brick-and-mortar brands defend share by integrating click-and-collect, unified inventories, and free returns. The Norway e-commerce market size for B2C transactions is expected to rise in tandem with household spending growth and fiber reach into secondary cities. However, the C2C segment, propelled by sustainability and price sensitivity, is forecast to log a 12.05% CAGR through 2031, eroding B2C dominance. Schibsted Marketplaces monetises C2C traffic via listing fees and value-added logistics, capturing NOK 2,103 million (USD 561 million) in Q4 2024 revenue.
C2C uptake reflects a social shift toward circular consumption, with 34% of citizens purchasing second-hand goods online in the past year. Recommerce platforms generate network effects that traditional retailers struggle to replicate, pushing incumbents to launch take-back programs and own-brand marketplaces. B2B e-commerce, while currently niche, benefits from Two and Avarda’s BNPL rail for trade buyers, aligning invoicing simplicity with procurement workflows. As B2B digital maturity increases, the Norway e-commerce industry unlocks incremental volume from wholesale and industrial categories.

By Device Type: Mobile Supremacy Meets IoT Commerce
Smartphones accounted for 65.40% of turnover in 2025, and app purchases now represent 52% of mobile transactions, indicating preference for feature-rich native experiences. Retailers prioritise app personalisation, biometric login, and in-app BNPL modules to raise conversion. Nevertheless, the fastest-growing slice—other connected devices—will expand at 10.05% CAGR, catalysed by smart speakers, watches, and in-car infotainment commerce. Norway’s renewable-powered data-center cluster hosts the compute backbone for voice assistants, enabling merchants to trial hands-free re-order journeys.
Desktop usage remains relevant for complex, high-consideration purchases and B2B orders requiring detailed specifications. The Norway e-commerce market size for multi-device shoppers will continue to increase as IoT endpoints proliferate in households averaging 2.8 connected devices beyond phones. Early adopters already manage grocery re-plenishment through fridge sensors, while wearables nudge health-related product recommendations, foreshadowing broader omnichannel convergence.
By Payment Method: Cards Yield to BNPL and A2A Innovation
Card payments still led with 53.20% share in 2025, but growth has plateaued amid rising interchange scrutiny and card-not-present fraud prevention expenses. BNPL, expanding at 13.15% CAGR, capitalises on transparent fee structures and soft-credit checks attractive to millennials wary of revolving credit. Vipps anchors domestic wallets, facilitating low-cost peer-to-merchant transfers that now appear alongside BNPL at checkout. A2A payments will double to 16% share by 2028, supported by PSD2 APIs that route funds instantly and cheaply between bank accounts.
Merchants integrating multi-rails achieve higher acceptance rates and lower cost-of-payment. The first movers leverage real-time settlement data to optimise inventory and reduce chargeback risk. Consequently, the Norway e-commerce market enjoys enhanced liquidity cycles for SMEs and better user experience across checkout journeys.
By B2C Product Category: Fashion Leadership Faces F&B Momentum
Fashion & apparel dominated with 28.55% of Norway e-commerce market share in 2025, but return rates approach 45%, pressuring logistics budgets. Sustainability concerns elevate interest in rental and second-hand fashion, compelling brands to develop circular programs. Food & beverages is the fastest-growing vertical at 14.1% CAGR, as Oda scales dark-store operations and accelerates ambient-temperature SKUs. The Norway e-commerce market size for online groceries is positioned to climb as consumers embrace weekly subscription models for pantry staples.
Electronics remains resilient due to high disposable income and early adoption of new gadgets. Komplett and Elkjøp shield domestic share through express pick-up and extended warranty bundles. Beauty & personal care benefits from premiumisation, while furniture gains from augmented-reality visualisers that mitigate size-related cart abandonment. Category expansion underscores how breadth of assortment and last-mile reliability dictate competitive advantage.
Geography Analysis
Urban clusters around Oslo and Bergen form the core of the Norway e-commerce market, generating dense delivery routes and shorter fulfilment windows. Domestic firms optimise inventory staging within 50 kilometres of these hubs to achieve same-day cut-offs. By contrast, Northern Norway’s sparse population yields a cost-to-serve that reduces average order frequency even though fibre coverage is improving under public investment programs. Shipping surcharges erode price competitiveness against physical retail, prompting experimentation with micro-fulfilment and communal pick-up points.
Cross-border behaviour remains entrenched: 48% of consumers place international orders monthly, primarily from Sweden and China, leveraging currency arbitrage and broader assortments. EU OSS reforms enable Norwegian SMEs to counterbalance outbound flows by marketing niche products to Europe without complex tax filings. The European cross-border e-commerce market reached EUR 326 billion (USD 354 billion) in 2024, presenting ample upside for export-oriented Norwegian brands. A strong trade surplus and energy-backed NOK valuation can, however, dampen import attractiveness, shifting consumer focus toward domestic SKUs when the krone strengthens.
Infrastructure resilience also varies by region. The upcoming Svalbard cable redundancy and new DC campuses position Northern territories as viable data-intensive commerce hubs over the long term, narrowing the urban-rural digital divide. Collectively, these dynamics sustain a multi-speed Norway e-commerce market that rewards localisation strategies and cross-border dexterity in equal measure.
Regulatory Landscape
Norway’s e-commerce framework is anchored in the Electronic Commerce Act (Ehandelsloven, 2003) and tracks EEA and EU-style rules for consumer protection and platform conduct. Consumer-facing marketing and sales terms are overseen by bodies such as Forbrukertilsynet (Norwegian Consumer Authority), while the government’s Digitaliseringsstrategi 2024-2030 (Ministry of Digitalisation and Public Governance) sets policy direction for digital infrastructure, privacy-by-design, and public-private digitisation priorities that affect online retail operations.
Tax and cross-border compliance have become more checkout-centric after the removal of the low-value VAT exemption from January 1, 2024. VAT is collected at point of sale and settled through schemes such as VOEC for eligible low-value B2C goods (commonly referenced up to NOK 3,000 for most goods). For cross-border sellers and marketplaces, this raises the need for VAT registration, transparent landed-cost display, and customs-ready data, while Norway’s strict GDPR-aligned privacy regime continues to limit personalised marketing unless consent and lawful-basis requirements are met.
Value Chain Analysis
Norway’s e-commerce value chain begins with merchant sourcing and assortment creation, then moves through digital storefronts (brand webshops and marketplaces), payment acceptance, fulfilment, and last-mile delivery, with returns logistics as a major cost node for categories such as fashion. Payment flows combine international cards and alternative rails, while local checkout options such as Vipps and BNPL providers are integrated via PSPs and checkout platforms to reduce friction on mobile-first journeys.
Fulfilment is increasingly localised to manage geography-driven costs, combining national DCs with store-as-micro-fulfilment and carrier networks that include Posten Bring, PostNord, Helthjem, and the Instabee group (Instabox/Porterbuddy). Cross-border parcels rely more heavily on global integrators such as DHL, DPD, and UPS, and capacity additions show up in 2026 with DHL Group activating a DHL Fulfillment Network (DFN) site in Oslo to support integrated warehousing and shipping for Nordic retailers. Compliance and data exchange run throughout the chain, including VAT collection under VOEC for eligible low-value imports and Norway’s standardised e-invoicing formats in public procurement (EHF/Peppol BIS), which also affect back-office integrations for larger merchants and B2B sellers.
Competitive Landscape
Norway’s e-commerce arena exhibits moderate fragmentation where domestic proficiency in logistics and local taste offsets global scale. Schibsted Marketplaces posted NOK 8,326 million (USD 2.2 billion) in 2024 revenue, validating its focus on classifieds and recommerce at a national level. International apparel giants Zalando and H&M leverage advanced AI recommendation engines but must accommodate local payment rails and high free-return expectations. Electronics leaders Komplett, Elkjøp, and Power utilise regional warehouses integrated with AutoStore robotics to maintain 24-hour delivery promises statewide.
Technology capability acts as the prime differentiator. AutoStore’s global automation footprint attracts foreign retailers seeking modular fulfilment inside Norway, indirectly enriching the Norway e-commerce market ecosystem. Vipps’ expansion into bundled financial services fosters platform lock-in effects similar to Asian super-apps, giving domestic merchants a loyalty lever unattainable to global competitors operating without local banking partnerships. Emerging players like Tise.com exploit sustainability niches by aligning peer-to-peer commerce with green values, enabling agile entry against incumbents bound to inventory-heavy models.
M&A prospects concentrate on logistics tech, payment orchestration, and niche marketplaces, evidenced by increased FDI scrutiny as the government lowers filing thresholds from one-third to 10 % of ownership for sensitive sectors. Overall, the Norway e-commerce market rewards speed-to-doorstep, eco-credentials, and adaptability to evolving payment habits.
Norway E-commerce Industry Leaders
-
Prisjakt Sverige AB
-
Komplett AS
-
Elkjøp Norge AS
-
Finn.no
-
Power International AS
- *Disclaimer: Major Players sorted in no particular order
Market Opportunities and Future Outlook
White space remains in operational and conversion improvements that target Norway’s high delivery and service costs, especially outside Oslo and Bergen. Retailers and enablers are investing in more integrated fulfilment and service layers, as shown by DHL Group activating DFN fulfilment capabilities in Oslo in 2026, supporting faster local delivery promises and helping Nordic-wide inventory positioning for cross-border merchants selling into Norway.
A second opportunity area is compliant, secure personalisation and digital trust tooling that fits Norway’s strict privacy regime and EU-aligned security posture. The National Digitalisation Strategy 2024-2030 formalises public-sector direction around privacy-by-design and broader digital transformation, while ongoing incorporation of EU-aligned cybersecurity obligations (for example, NIS2-type requirements for risk management and incident reporting) increases demand for identity, consent management, fraud controls, and secure-by-design commerce features. Checkout optimisation stays a near-term lever, given mobile dominance and expanding BNPL usage; merchants that combine local payment rails such as Vipps with BNPL, accurate VAT-at-checkout, and clearer returns handling can reduce abandonment and improve repeat frequency without leaning on aggressive third-party tracking.
Recent Industry Developments
- July 2026: Komplett Group reported its Q2 2026 update, highlighting improved seasonal sales alongside cost reduction measures. The combination of merchandising discipline and efficiency actions reinforces the focus on margin management in a market where delivery and returns costs materially shape online profitability.
- February 2026: Elkjop announced the acquisition of Eplehuset, an Apple Premium Partner with 25 stores, adding a specialist retail and service footprint. The deal strengthens Elkjop’s omnichannel reach and expands access to premium consumer-electronics demand that also converts into online sales and service-led repeat purchases.
- December 2024: Norway’s Ministry of Digitalisation launched the National Digitisation Forum (NDF) to support AI and broader digital transformation across the economy. The forum signals continued public-sector coordination around digital capabilities and governance, feeding into the infrastructure and compliance environment that e-commerce players build against.
Research Methodology Framework and Report Scope
Market Definition and Coverage
For this methodology, the Norway e-commerce market is treated as the value of online commerce generated when purchases are completed through internet-enabled storefronts for delivery or digital fulfillment within Norway, across domestic and cross-border platforms.
Scope exclusions: We exclude pure payment gateway fees, in-app gaming micro-transactions, and motor-vehicle sales.
Segmentation Overview
- By Business Model
- B2C
- B2B
- C2C
- By Device Type
- Smartphone / Mobile
- Desktop and Laptop
- Other Device Types
- By Payment Method
- Credit / Debit Cards
- Digital Wallets
- BNPL
- Other Payment Method
- By B2C Product Category
- Beauty and Personal Care
- Consumer Electronics
- Fashion and Apparel
- Food and Beverages
- Furniture and Home
- Toys, DIY and Media
- Other Product Categories
Data Sources, Market Sizing, and Validation
Desk Research
Desk research helped us pin down Norway-specific context for online spending, inflation pressure on prices, and changes in cross-border ordering behavior. We leaned on reputable public sources such as Statistics Norway for retail trade, household consumption, and price series, Norges Bank for macro and payments context, and the Norwegian Tax Administration for VAT and cross-border guidance, including OSS-related materials.
To keep definitions consistent, we also used customs and trade publications where relevant, along with public company filings, annual reports, and investor presentations from retail, logistics, and digital commerce participants operating in Norway. Paid subscriptions focused on company financials and intelligence, news and financials, and patent databases were used selectively to fill disclosure gaps and to time major capability shifts. The sources mentioned here are illustrative and not exhaustive, and many other public documents and datasets were also referenced for data collection, validation, and research clarification.
Primary Interviews and Surveys
Interviews and surveys with Norwegian ecommerce sellers, payment specialists, logistics contacts, and retail managers clarify order frequency, basket values, cross-border buying, mobile use, and channel shifts within Norway. Respondent input helps resolve gaps in secondary data and adjust assumptions before final analysis, particularly where payment or retail trends do not match reported changes. Re-contact is used to investigate those discrepancies.
Distribution of primary research fieldwork respondents
| Company type | Respondent position |
|---|---|
| Top tier: 29% | CXOs: 18% |
| Mid tier: 46% | Functional/Unit leaders: 30% |
| Smaller Players: 25% | Managers: 52% |
Market-Sizing & Forecasting
The core sizing logic is a top-down build that reconstructs Norway online commerce value from retail and digital activity signals, then allocates that value into e-commerce based on observed online purchase behavior. Once the demand pool is defined, the value layers are applied at the end so the totals remain aligned with real spending capacity.
To keep the outputs realistic, we corroborated totals with selective bottom-up approximations, such as sampled revenue roll-ups from key online-first retailers, channel checks on cross-border volumes, and simple ASP times order-volume tests for high-velocity categories. Where coverage gaps exist, for example smaller merchants with limited disclosure, we filled them using penetration assumptions validated through interviews and then rechecked against category-level reasonableness.
Key inputs used in the model include online shopper participation, average order values by major B2C categories, domestic versus cross-border purchase share, payment mix shifts that can affect conversion, and parcel volume growth as a practical fulfillment proxy. Forecasts were produced using scenario analysis supported by expert consensus, where we stress-tested upside and downside cases around inflation-led ASP movement, promotional depth, and the pace of cross-border normalization after VAT and compliance changes.
Data Validation & Update Cycle
Before sign-off, outputs are triangulated against independent signals such as retail trade direction, payment usage trends, and logistics throughput, so outliers are explained rather than averaged away. Any sharp variance triggers an analyst review, followed by a re-check of the underlying drivers and, where needed, a re-contact with relevant interviewees to confirm what changed.
The report is refreshed on an annual schedule, and interim updates are completed when material events occur, such as tax rule shifts, major platform policy changes, or abrupt pricing swings. Right before delivery, a final freshness pass is done so clients receive the most current view available at that time.
Mordor Intelligence's Norway Ecommerce Market Size Measured Against Other Published Estimates
Published values for Norway e-commerce often do not align perfectly because studies use different timing for currency conversion, different price assumptions, and different rules on what counts as e-commerce revenue. Some series are updated quickly when inflation and discounting change, while others keep average order values steady for longer periods.
A major gap driver is whether cross-border storefront purchases are counted at the time of checkout in local currency or adjusted later using annual average FX, which can move the USD value even if local spending is stable. Another difference is whether category-level ASP progression is revalidated against order-volume and parcel-flow signals during refresh cycles, which helps keep assumptions consistent with the approach used by Mordor Intelligence.
Benchmark comparison
| Source | Market Size | Gaps in Research Methodology |
|---|---|---|
| Mordor Intelligence | USD 9.63 B (2025) | |
| Industry Data Platform A | USD 8.55 B (2025) | Often centers on tracked e-commerce revenue and category aggregation, which can apply tighter inclusion rules on adjacent digital items and may not fully reconcile cross-border platform activity with local checkout timing and VAT handling. |
| Retail Analytics Publisher B | USD 16.48 B (2025) | Commonly reported as retail e-commerce sales with broader retail coverage and stronger growth assumptions, and it can embed different FX timing plus a higher assumed online share of retail, which pushes the USD total upward. |
The table suggests the spread comes mainly from scope boundaries and refresh variables rather than a simple calculation error. When the inputs are anchored to observable demand signals and then rechecked for FX timing, cross-border share, and ASP drift, the final number becomes easier to trace back to repeatable steps for Norway.
Key Questions Answered in the Report
What is the current size of the Norway e-commerce market?
The market is worth USD 10.35 billion in 2026 and is forecast to grow to USD 14.84 billion by 2031 at a 7.48% CAGR.
Which business model leads online retail in Norway?
B2C dominates with 77.25% share in 2025, although C2C is the fastest-growing at 12.05% CAGR through 2031.
How important is mobile commerce in Norway?
Smartphones generate 65.40% of online sales, and dedicated apps account for more than half of those purchases.
Why is BNPL growing so quickly in Norway?
BNPL appeals to Gen-Z and millennials for fee transparency and budgeting flexibility, driving a 13.15% CAGR to 2031 and eroding traditional credit card usage.
What challenges hinder e-commerce expansion in Northern Norway?
Low population density and harsh terrain inflate last-mile delivery costs by over 20% of order value, prompting surcharges and longer lead-times.
How does the EU OSS regime benefit Norwegian sellers?
It allows SMEs to file one consolidated VAT return for all EU sales, cutting administrative overhead and accelerating cross-border shipments.