
Northern Virginia Data Center Market Size and Share
Market Overview
| Study Period | 2020 - 2031 |
|---|---|
| Forecast Data Period | 2026 - 2031 |
| Base Year Market Size (2025) | 16.04 gigawatt |
| Market Volume (2026) | 20.32 gigawatt |
| Market Volume (2031) | 43.52 gigawatt |
| Growth Rate (2026 - 2031) | 3.38% CAGR |
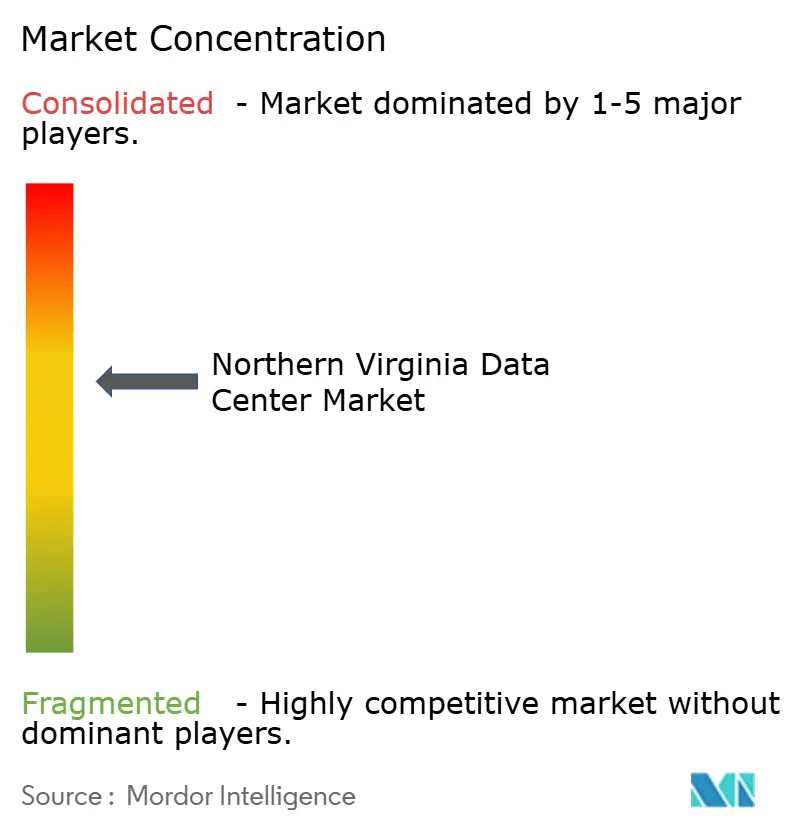
| Market Concentration | Medium |
Major Players *Disclaimer: Major Players sorted in no particular order Image © Mordor Intelligence. Reuse requires attribution under CC BY 4.0. | |
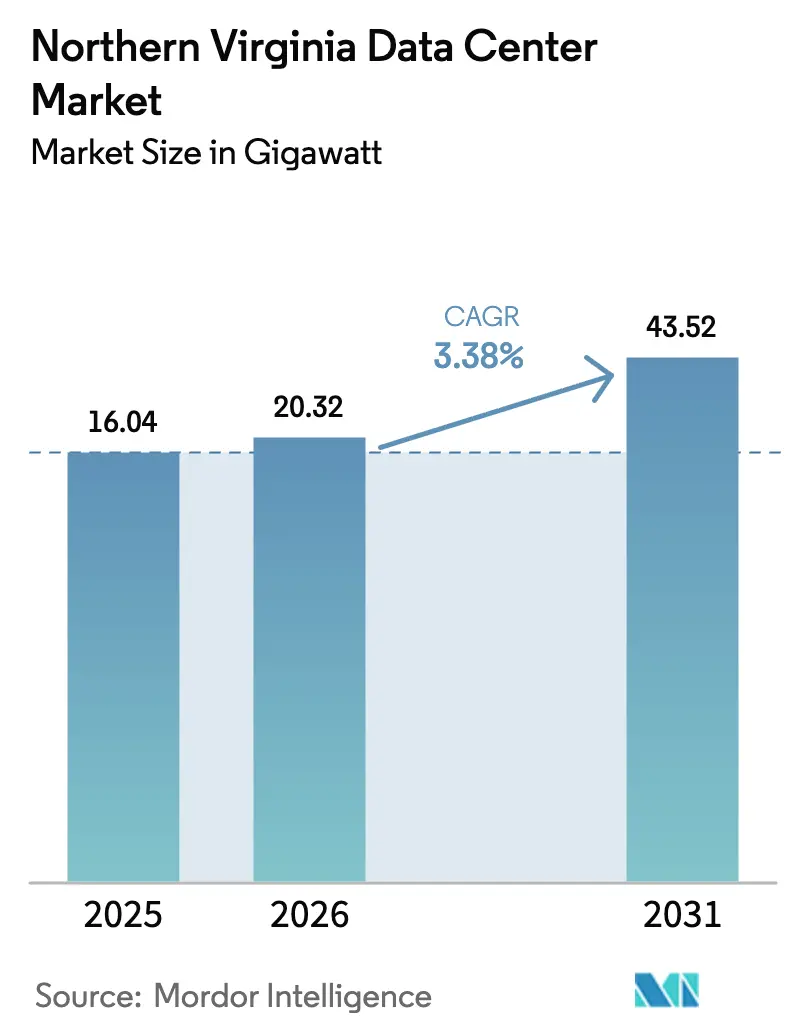
Northern Virginia Data Center Market Analysis by Mordor Intelligence
Northern Virginia data center market size in 2026 is estimated at 20.32 GW, growing from the 2025 value of 16.05 GW, with 2031 projections showing 43.52 GW, growing at a 3.38% CAGR over 2026-2031. Sustained hyperscale capital expenditure, record-high fiber density, and a tax regime that exempts data-center equipment from sales‐and-use taxes underpin this steady growth trajectory. Roughly 70% of global internet traffic already passes through facilities located in Loudoun, Prince William, and Fairfax counties, giving operators unrivaled interconnection advantages while reinforcing the virtuous cycle that attracts new entrants. Energy remains the central constraint: data centers consumed 25% of Virginia’s electricity mix in 2025 and could account for 46% by 2030, driving a rapid pivot toward multi-gigawatt power-purchase agreements, on-site generation, and battery storage. Land scarcity inside the traditional Ashburn corridor is accelerating a shift to multi-story facilities and secondary counties, and it is intensifying bidding wars for parcels already zoned for digital infrastructure.
Key Report Takeaways
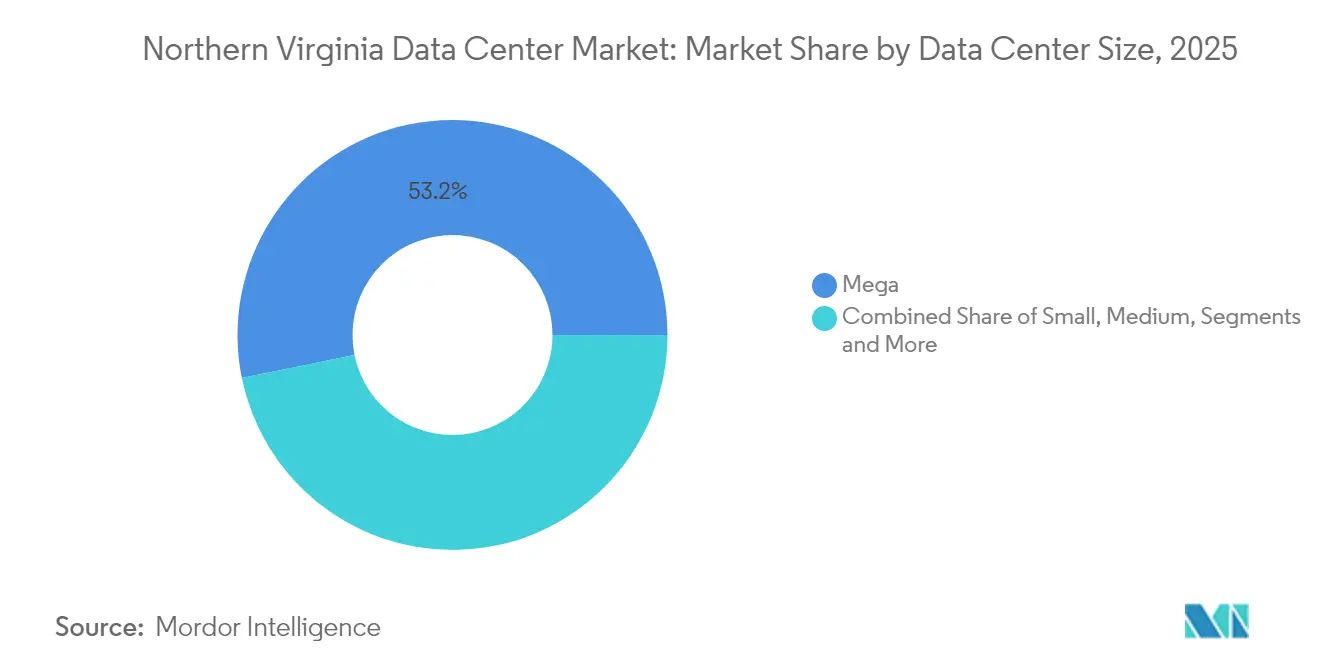
- By data center size, hyperscale facilities held 53.20% of the Northern Virginia data center market share in 2025; large facilities are projected to post the fastest 4.05% CAGR through 2031.
- By tier type, Tier 3 sites commanded 77.90% share of the Northern Virginia data center market size in 2025, while Tier 4 deployments are forecast to grow at a 5.05% CAGR through 2031.
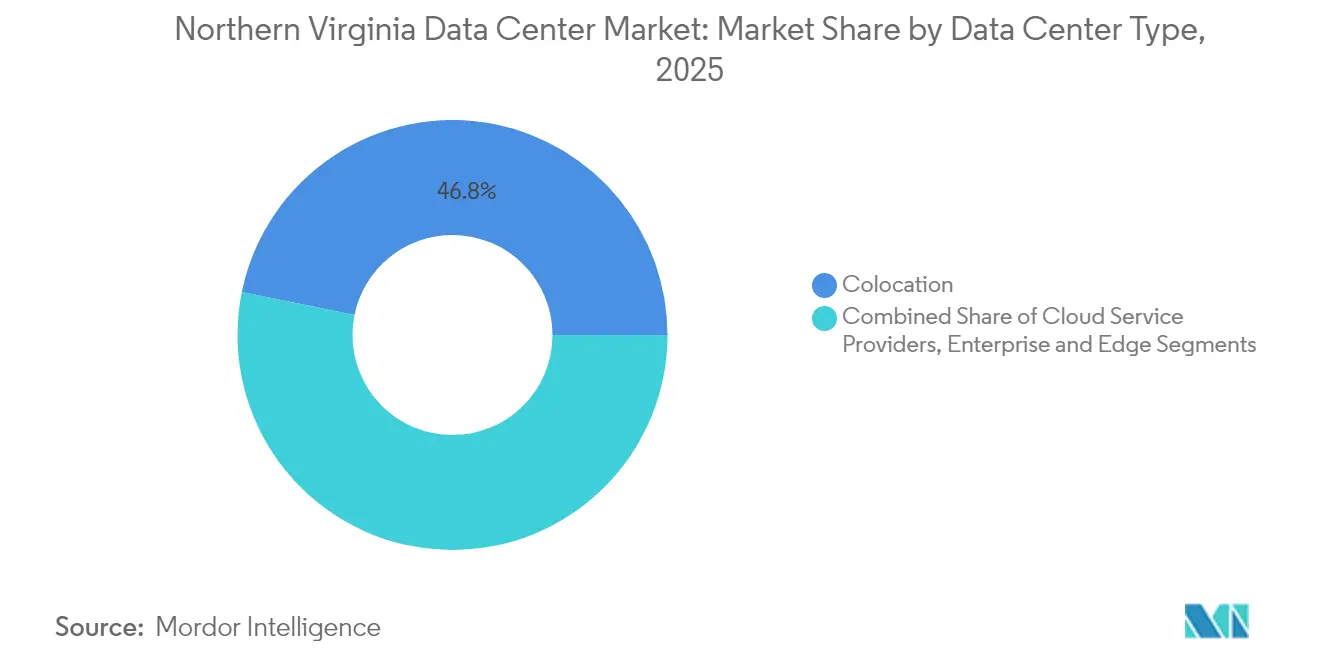
- By data center type, colocation facilities accounted for 46.80% of the Northern Virginia data center market size in 2025; cloud service providers will advance at a 6.55% CAGR through 2031.
- Amazon Web Services, Microsoft, and Google collectively controlled 38% of active IT load in 2024, illustrating the scale at which hyperscalers shape regional build cycles
Note: Market size and forecast figures in this report are generated using Mordor Intelligence’s proprietary estimation framework, updated with the latest available data and insights as of 2026.
Northern Virginia Data Center Market Trends and Insights
Drivers Impact Analysis*
| Driver | (~) % Impact on CAGR Forecast | Geographic Relevance | Impact Timeline |
|---|---|---|---|
| Rapid hyperscale cloud expansion | +1.2% | Northern Virginia core, spillover to Stafford and Caroline counties | Medium term (2-4 years) |
| Record-high fiber density and interconnection | +0.8% | Ashburn epicenter, extending along Dulles corridor | Long term (≥ 4 years) |
| Tax incentives and sales-and-use-tax exemptions | +0.6% | Statewide Virginia, concentrated benefits in Northern Virginia | Long term (≥ 4 years) |
| Surge in AI/ML and GPU clusters | +1.1% | Northern Virginia, with emerging clusters in Richmond area | Short term (≤ 2 years) |
| Corporate demand for 24×7 uptime (edge and latency) | +0.4% | Metro Washington D.C. area, federal agency proximity zones | Medium term (2-4 years) |
| Shift to sustainable/renewable power PPAs | +0.3% | Northern Virginia, with renewable sourcing from statewide projects | Long term (≥ 4 years) |
| Source: Mordor Intelligence | |||
Rapid Hyperscale Cloud Expansion
Amazon Web Services operated more than 50 facilities in Northern Virginia by 2024, and Microsoft has underway projects totaling nearly 4 million ft² in Manassas, underscoring the scale at which hyperscalers prefer to concentrate capacity.[1]Data Center Dynamics Editorial Team, “AWS expands Northern Virginia footprint,” datacenterdynamics.com Concentration supports low-latency interconnection and economies of scale but magnifies regional reliance on Dominion Energy’s grid. Traditional colocation providers are redesigning campuses; Digital Realty’s Ashburn platform alone now supports 632 MW of IT load capacity. Heightened inter-campus cabling and dedicated substations have become routine project features, and power reservations for 100 MW blocks are no longer exceptional. However, Dominion’s 2024 moratorium on new connections spotlighted how transmission congestion can slow even the deepest corporate wallets.
Record-High Fiber Density and Interconnection
The MAE-East legacy places Ashburn at the center of 337 active peering points across 16 Equinix sites, creating latency metrics few global metros can match.This dense network forces any cloud or AI provider needing sub-millisecond round-trip times to locate inside the same fiber catchment, reinforcing land price escalation. Proposals such as Active Infrastructure’s 362-acre Leesburg campus couple behind-the-meter renewables with local fiber loops, illustrating a combined approach to grid risk and connectivity value. The combination of dark fiber loops, meet-me rooms, and subsea cable backhaul continues to elevate the region’s indispensability for global backbone traffic.
Tax Incentives and Sales-and-Use-Tax Exemptions
Virginia’s exemption program catalyzed USD 24 billion in qualified investments during fiscal 2023.[3] JLARC, “Data Centers in Virginia,” coopercenter.org The mechanism grants operators full relief on servers, networking gear, and power-conditioning equipment in exchange for USD 150 million capital commitments plus 50 jobs, thresholds that hyperscalers easily surpass. Legislative renewal through 2035 provides coveted policy certainty during campus planning cycles that can span a decade. Nevertheless, Prince William County lifted the local data-center levy from USD 2.15 to USD 3.70 per USD 100 of assessed value in 2024, signaling that tax policy may tighten if community benefits lag perceived externalities.
Surge in AI/ML and GPU Clusters
GPU training clusters require rack-level densities 10–20 times higher than legacy application stacks, forcing operators to retrofit for liquid cooling and chilled-water return loops. CyrusOne’s direct-to-chip cooling trims energy use by up to 25% while supporting >100 kW per rack loads. Cerebras Systems plans six U.S. data centers by end-2025, with 85% of deployed capacity committed to Northern Virginia AI inference workloads. The AI surge is also accelerating Tier 4 adoption, as continuous training cycles cannot tolerate planned downtime. While advanced designs lift facility utilization, each deployment piles extra load on Dominion Energy’s constrained transmission lines, making local battery farms and microgrids a defining design element in the next build wave.
Restraints Impact Analysis*
| Restraint | (~) % Impact on CAGR Forecast | Geographic Relevance | Impact Timeline |
|---|---|---|---|
| Dominion Energy grid constraints | -1.8% | Northern Virginia core, affecting Loudoun and Prince William counties | Short term (≤ 2 years) |
| Land-use and zoning moratoria in Loudoun/Prince William | -0.9% | Loudoun County primarily, with spillover effects in Prince William | Medium term (2-4 years) |
| Escalating construction and power-equipment costs | -0.7% | Regional impact across Northern Virginia | Short term (≤ 2 years) |
| Water-use restrictions for advanced cooling | -0.4% | Fairfax and Loudoun counties, areas with water authority oversight | Medium term (2-4 years) |
| Source: Mordor Intelligence | |||
Dominion Energy Grid Constraints
Dominion’s 2024 Integrated Resource Plan projects an 85% rise in load over 15 years, necessitating 3.4 GW offshore wind, 12 GW solar, and 4.5 GW storage just to maintain supply adequacy. Temporary connection pauses through January 2026 created a bifurcated market where power-entitled projects trade at premiums, while greenfield sites wait in the queue. PJM Interconnection fielded 92 bids for transmission upgrades that could reach USD 51 billion, highlighting the scale of remediation. Developers increasingly request on-site gas turbines, battery storage, or renewable PPAs bundled with dedicated feeders to mitigate connection uncertainty. Yet such work-arounds add construction complexity and may face additional permitting scrutiny.
Land-Use and Zoning Moratoria in Loudoun/Prince William
Loudoun County ended by-right data center approvals in March 2025, pushing every new project into public hearings and special-exception reviews.[2]Holland & Knight, “Zoning changes in Loudoun County,” hklaw.com Prince William County tabled Amazon’s proposal near Gainesville High School in late 2024, while Fairfax County introduced 200-foot residential setbacks and banned data centers within a mile of Metro stations. These shifts slow entitlement timelines by 12–24 months and boost carrying costs for land banks. They are prompting capacity-hungry operators to scout Stafford, Caroline, and Culpeper counties, where zoning codes remain permissive and industrial land is abundant. As a result, the Northern Virginia data center market is sprawling southward along I-95, increasing transmission line mileage and adding to Dominion’s capital burden.
*Our forecasts treat driver/restraint impacts as directional, not additive. The impact forecasts reflect baseline growth, mix effects, and variable interactions.
Segment Analysis
By Data Center Size: Hyperscale Facilities Drive Market Consolidation
Hyperscale facilities held 53.20% of the Northern Virginia data center market share in 2025 and will expand at a 3.85% CAGR through 2031. The Grove at Gainesville stretches a quarter-mile and needs power for 150,000 homes, illustrating the economies operators achieve when scaling HVAC plants, generators, and security operations. Large and medium footprints still secure lease wins from enterprises that value geographic diversity, yet the capital gravity of multi-gigawatt campuses is drawing investment toward the top end of the scale curve.
Hyperscale design also shifts construction toward multi-story steel superstructures that optimize scarce land but elevate mechanical complexity. STACK Infrastructure’s 1 GW Stafford Technology Campus underscores this trend, covering 500 acres while accommodating 19 buildings engineered for liquid cooling and 300 MW battery reserves. Given its forecast capacity, the campus alone accounts for 7% of the Northern Virginia data center market in 2030. Rising community scrutiny may temper the pace, but the economic logic of aggregating capacity near fiber crossroads ensures that mega facilities will remain the defining form factor.


By Tier Type: Tier 3 Dominance with Tier 4 Acceleration
Tier 3 sites accounted for 77.90% of the Northern Virginia data center market size in 2025, balancing uptime and cost for most enterprise workloads. AI clusters and regulated workloads are lifting demand for Tier 4, which will outpace the overall market at a 5.05% CAGR to 2031. Continuous training jobs lasting weeks or months tolerate no interruptions, pushing designers toward N+2 mechanical redundancy and concurrently maintainable power pathways.
CyrusOne leads Tier 4 retrofits, combining direct-to-chip cooling with heat-rejection systems that cut water use while sustaining 100 kW rack densities. Investment case studies reveal that Tier 4 rents command 25% premiums over Tier 3, yet operators still accrue savings through reduced downtime penalties. As reliability expectations widen the capability gap, Tier 1 and Tier 2 footprints will retreat to niche roles like DR sites where capital efficiency outweighs five-nines availability.
By Data Center Type: Cloud Service Providers Lead Growth
Colocation retained 46.80% of Northern Virginia data center market size in 2025, but the cloud service provider (CSP) segment is on track for the strongest 6.55% CAGR through 2031. Hyperscalers such as Amazon’s USD 11 billion Louisa County build program illustrate the preference for full ownership and design control. Wholesale and retail colocation continue to attract mid-tier clouds and enterprises requiring interconnection variety without the capex burden of a dedicated building.
The Northern Virginia data center industry is adapting by offering flexible powered-shell leases, pre-positioned ducts for immersion cooling, and granular metering as tenants chase sustainability targets. Retail colocation remains sticky for compliance-bound workloads that need on-demand capacity, while wholesale corridors anchor 20-50 MW halls sought by regional content providers. Operators that integrate on-site solar arrays and recycled-water cooling will secure differentiation as ESG scorecards join latency and price in procurement decisions.
Geography Analysis
Loudoun County hosts more than 160 active facilities across 31 million ft², making it the densest digital infrastructure cluster on the planet. The concentration gives the Northern Virginia data center market unmatched interconnection and labor efficiencies, yet it also magnifies local zoning disputes and power congestion risk. Prince William County could surpass Loudoun in square footage once entitlements clear, with planned projects exceeding 80 million ft². Fairfax County supports government-centric workloads that benefit from proximity to federal campuses and Capitol Hill agencies.
The regional footprint equaled 13% of global live capacity in 2025, highlighting the systemic importance of its fiber spines and carrier hotels. Amazon’s acquisition of 100 acres in Leesburg and STACK’s 500-acre Stafford initiative demonstrate a pivot toward outer counties where land prices and community sentiment are more favorable. Such sprawl pushes utilities like the Northern Virginia Electric Cooperative to reconfigure rural substation topologies as data-center customers will represent 95% of NOVEC energy sales by 2032.
Grid limitations still center on the Dominion transmission backbone, so operators increasingly request private feeders from new solar farms in southern Virginia. The Northern Virginia data center market size attributable to Stafford, Caroline, and Culpeper counties could exceed 2.14 GW by 2031, absorbing demand that Ashburn and Manassas cannot accommodate within zoning envelopes. While shifting workloads away from the urban core reduces immediate land friction, it lengthens backhaul paths and adds complexity to synchronous replication strategies.
Regulatory Landscape
Northern Virginia data center development is shaped by state utility regulation, state tax policy, and county-level land use controls. The Virginia State Corporation Commission (SCC) has been a key reference point as Dominion Energy manages grid reliability amid large-load growth, including the connection batching process introduced in May 2025 that limits approvals to roughly 2-3 GW per year. On the land-use side, Loudoun County ended by-right data center approvals in March 2025, shifting new projects into special-exception reviews and public hearings that can extend entitlement timelines.
New rules aimed at allocating cost and risk for very large electric loads are also taking shape. SCC Case PUR-2025-00058 established Dominion Energy's GS-5 rate class for large energy users (25 MW+ with high load factors), effective January 1, 2027, and legislative changes such as the Virginia Code 56-234(D) amendment (effective January 1, 2027) and HB 1151 (2026) provide additional tools for utilities to manage service obligations and reliability for large new customers. Together, these actions increase the value of early utility coordination, power reservation strategy, and site selection across Loudoun, Prince William, and secondary counties as operators plan multi-year build programs.
Value Chain Analysis
The Northern Virginia data center value chain begins with site identification and entitlement (county zoning, special exceptions, and community conditions), then moves into utility interconnection planning, which increasingly drives project critical paths. Dominion Energy's multi-year transmission and generation planning, including its USD 50 billion capital plan for 2025-2029 with major 500 kV and 230 kV upgrades, is a pivotal upstream dependency for campus delivery. Permitting complexity also extends beyond local approvals, with environmental and civil works processes, including U.S. Army Corps of Engineers oversight where wetland or stream impacts arise for expansions.
On the delivery and operations side, developers and operators coordinate construction and equipment procurement (electrical gear, power-conditioning systems, cooling plants, and controls), then commission facilities for hyperscale, wholesale, or retail colocation tenants. As connection uncertainty remains a constraint, the value chain increasingly incorporates on-site generation, substantial permitted backup capacity, battery storage, and dedicated feeders to improve schedule certainty and operational resilience. Over time, facility management shifts to power-management optimization, liquid-cooling readiness for high-density AI racks, and interconnection services tied to Ashburn's carrier-rich footprint.
Competitive Landscape
A handful of incumbent campus operators—Equinix, Digital Realty, CoreSite, CyrusOne, STACK Infrastructure, and Vantage—control the bulk of primary interconnection nodes, yet the field remains open for innovators able to secure land and power. Hyperscalers skew demand concentration: in 2024 Amazon, Microsoft, and Google accounted for 38% of commissioned IT load in the Northern Virginia data center market. Equinix partnered with GIC and CPP Investments in a USD 15 billion venture to boost hyperscale capacity, underscoring the weight of sovereign and pension capital in campus financing.
STACK’s USD 900 million green loan signals growing preference for sustainability-linked instruments, and Vantage’s USD 13 billion debt raise in early 2025 further illustrates appetite for scale-oriented portfolios vantage-dc.com. Land supply tightness encourages build-to-suit contracts that transfer design risk to developers in exchange for long-term revenue certainty. Secondary-market specialists like Iron Mountain have spent USD 113 million for a 40-acre Prince William parcel that already carries a 300 MW power right, aiming to capture value from constrained interconnect routing insidenova.com.
Technological differentiation now comes from liquid-cooling patents, immersion tanks, and power-management software that orchestrates battery storage during grid curtailments. Active Infrastructure’s hydrogen-ready blueprint reflects the urgency to detach campus expansion from Dominion’s quota windows. As innovation cycles shorten, operators with in-house engineering teams that can iterate power chain designs win leases faster than those depending on third-party EPC firms.
Northern Virginia Data Center Industry Leaders
Digital Realty Trust, Inc.
Equinix, Inc.
Amazon Web Services, Inc.
Vantage Data Centers, LLC
CyrusOne LLC
- *Disclaimer: Major Players sorted in no particular order

Market Opportunities and Future Outlook
The most visible whitespace in Northern Virginia is power-entitled capacity, faster-to-entitle land outside the tightest Ashburn corridor, and fit-for-purpose designs for AI/GPU density. Market evidence continues to point to tight absorption dynamics, with 1,102 MW recorded in 2025 and 96% of 2026 scheduled supply reported as pre-leased by end of 2025, which supports opportunities for developers that can secure interconnection and deliver powered shells on predictable timelines. County policy shifts, including Loudoun's March 2025 move away from by-right approvals, also create room for secondary counties and for projects that package community benefits, setbacks, and design mitigations into entitlement strategies.
Recent capital deployment and consolidation activity reinforces where operators are placing near-term emphasis. In June 2026, Digital Realty agreed to acquire Blackstone-managed funds' interests in three Northern Virginia data centers for USD 3.5 billion (288 MW), highlighting an approach for investors and operators to pursue scale through recapitalizations and ownership consolidation in existing, leased assets. At the same time, hyperscalers continue to secure large sites, including a reported June 2026 purchase by Amazon of a 270-acre Prince William County site for about USD 700 million, which supports the case for land banking paired with utility-ready power plans. As Dominion's batching and new large-load rate structures progress toward 2027, solutions that combine dedicated feeders, on-site generation or storage, and high-efficiency cooling retrofits provide a practical route for capacity additions under tighter grid and permitting conditions.
Recent Industry Developments
- July 2026: Equinix acquired 34.5 acres in Loudoun County for potential future expansion of IBX facilities. The expansion of hyperscale capacity in NoVA reinforces Equinix's footprint and access to interconnection dense ecosystem. The land banking supports large-scale interconnection and future capacity growth.
- June 2026: Digital Realty agreed to purchase Blackstone-managed funds ownership interests in three Northern Virginia data centers for $3.5 billion. Consolidation of hyperscale assets in key NoVA sites strengthens Digital Realty's control over capacity and leverage. The move secures long-term revenue control and scale advantages across Manassas and Sterling assets.
- May 2026: Equinix opened the DC12 data center at its Ashburn campus, with plans to expand to 3,000 cabinets. The near-term capacity addition expands interconnection density in the Ashburn hub. This strengthens competitive position and reinforces presence in the NoVA ecosystem.


Research Methodology Framework and Report Scope
Market Definition and Coverage
This market is defined as the operational and committed data center capacity located in Northern Virginia, expressed as installed IT load, which reflects the power capacity available to run IT equipment inside facilities.
Scope exclusions: We exclude general telecom networks, end-user IT hardware spending outside data centers, and electricity generation and transmission buildouts that sit outside the data center fence line.
Segmentation Overview
- By Data Center Size
- Small
- Medium
- Large
- Hyperscale
- By Tier Type
- Tier 1 and 2
- Tier 3
- Tier 4
- By Data Center Type
- Cloud Service Providers (CSPs)
- Enterprise, Modular and Edge
- Colocation
- Non-Utilized
- Utilized
- Colocation Type
- Retail
- Wholesale
- End User
- Cloud and IT
- Telecom
- Media and Entertainment
- Government
- BFSI
- Manufacturing
- E-Commerce
- Other End User
- Colocation Type
Data Sources, Market Sizing, and Validation
Desk Research
Desk research is used to map Northern Virginia data center supply, demand, and constraints into a consistent capacity view before we finalize the market model. We pull public and official data points that can be checked, such as US Energy Information Administration (EIA) electricity statistics, US Census construction and economic series, Virginia State Corporation Commission (VIRGINIA SCC) dockets, and county planning and permitting portals across Northern Virginia.
To ground market activity, we also review non-paywalled industry and technical references, such as Northern Virginia Technology Council publications, US Environmental Protection Agency (EPA) energy and emissions resources, and peer-reviewed papers on data center power and cooling. Company filings, press releases, and investor presentations help confirm timelines and commissioning triggers, and we selectively use paid subscriptions for company financials and intelligence, news and financials, and global contracts and tenders when they improve project tracking. These desk sources are illustrative only, and additional references are used to collect data, cross-check numbers, and clarify open questions.
Primary Interviews and Surveys
Primary work is used to pressure test the capacity pipeline and the assumptions behind installed IT load, especially where public announcements do not specify power, delivery timing, or utilization. We interview and survey a mix of operators, engineering and construction participants, leasing and brokerage specialists, and large buyers, covering the full Northern Virginia cluster so our assumptions stay consistent across counties and submarkets.
Distribution of primary research fieldwork respondents
| Company type | Respondent position | Region |
|---|---|---|
| Top tier: 36% | CXOs: 16% | APAC: 43% |
| Mid tier: 44% | Functional/Unit leaders: 36% | EMEA: 33% |
| Smaller Players: 20% | Managers: 48% | Americas: 24% |
Market-Sizing & Forecasting
The model starts with a top-down reconstruction of installed IT load for Northern Virginia using the active inventory and the known committed pipeline, which are then translated into comparable GW terms. To keep the totals realistic, we corroborate them with selective bottom-up checks such as sampled site level power disclosures, channel checks on delivered MW by year, and triangulated absorption signals from leasing conversations.
Key inputs used in the sizing and forecast include: reported total inventory and available capacity, net absorption and preleasing intensity, utility power availability and connection lead times, typical rack density shifts that change MW per square foot, and the pace of new builds and expansions captured through permits and public project milestones. Where a project has incomplete details, we fill gaps using conservative IT load ranges based on facility type and expected density, and then we re-test the impact during validation.
For forecasting, we rely on scenario analysis supported by primary feedback, because power delivery timing and land availability can change the near-term ramp even when demand is strong. Assumptions are updated for year-by-year deliveries and stabilization patterns so growth does not have to follow a smooth curve when real commissioning schedules are lumpy.
Data Validation & Update Cycle
Outputs are checked through multiple passes, starting with unit consistency tests (MW to GW), time alignment checks on delivery years, and reasonableness checks against independent signals like vacancy tightness and announced build pace. When a variance is large, we revisit the underlying drivers, re-open the project list, and then re-contact selected experts to confirm whether the shift is structural or temporary.
Before sign-off, the model and assumptions are reviewed by another analyst so calculation logic, conversions, and sources are consistent. Reports are refreshed annually, and interim updates are made when material events occur, such as major utility rule changes, large project delays, or new county level restrictions. Right before delivery, we perform a final refresh pass so clients receive the latest updated view.
Mordor Intelligence's Northern Virginia Data Center Market Sizing Compared With Other Published Estimates
Published estimates for Northern Virginia can still look far apart because some sources mix up what is being measured, and they also bundle different parts of the ecosystem into one number. Differences usually come from whether a figure reflects installed IT load versus leased capacity, whether planned projects are counted as committed, and how the timeline is treated when power delivery is delayed.
Some external figures convert leasing activity, square footage, or even broader Virginia economic impact into a single USD market value. For Mordor Intelligence, the headline market sizing is reported as installed IT load in GW for Northern Virginia only, and project timing is kept current through re-contacts when large utility queue shifts or major commissioning delays show up.
Benchmark comparison
| Source | Market Size | Gaps in Research Methodology |
|---|---|---|
| Mordor Intelligence | USD 20.32 B (2026) | |
| Industry Data Provider A | USD 4.04 B (2025) | Uses total inventory in MW as a proxy and often reflects delivered supply for a point in time, which can understate the committed pipeline and does not normalize for IT load reporting differences. |
| Industry Report B | USD 13.90 B (2032) | Expresses a broader USD market value over a longer horizon, and the scope may include related spending beyond installed IT load, which makes the figure not directly comparable to capacity based sizing. |
The spread is mainly explained by unit choice and scope, since MW inventory snapshots and USD ecosystem values answer different questions than installed IT load growth. By keeping the model tied to capacity additions, commissioning timing, and locally validated constraints, the estimate stays traceable to repeatable steps that a buyer can reconcile year to year.


Key Questions Answered in the Report
What is the projected capacity of the Northern Virginia data center market by 2031?
The market is forecast to reach 9.28 GW of installed IT load by 2031, growing at a 3.38% CAGR.
Why do mega data centers dominate new construction?
Mega campuses lower unit costs for power, cooling, and security, and they align with hyperscale leasing blocks that often require 100 MW or more of contiguous capacity.
How are power constraints being addressed?
Dominion Energy plans to raise contracted data-center capacity to 40 GW while operators deploy on-site generation and battery storage to bridge transmission bottlenecks.
Which segment grows fastest within the market?
Cloud service providers show the highest projected CAGR at 6.55% through 2031 as hyperscalers favor owned facilities over third-party colocation.
What regulatory changes affect new builds?
Loudoun County now requires special-exception permits for every data center, while nearby counties have introduced noise setbacks and zoning caps, extending project timelines.
How has artificial intelligence altered facility design?
GPU-driven AI workloads require liquid cooling and higher rack densities, prompting retrofits and Tier 4 upgrades to maintain continuous training operations.
Page last updated on:






