
Northern California Data Center Market Size and Share
Market Overview
| Study Period | 2020 - 2031 |
|---|---|
| Forecast Data Period | 2026 - 2031 |
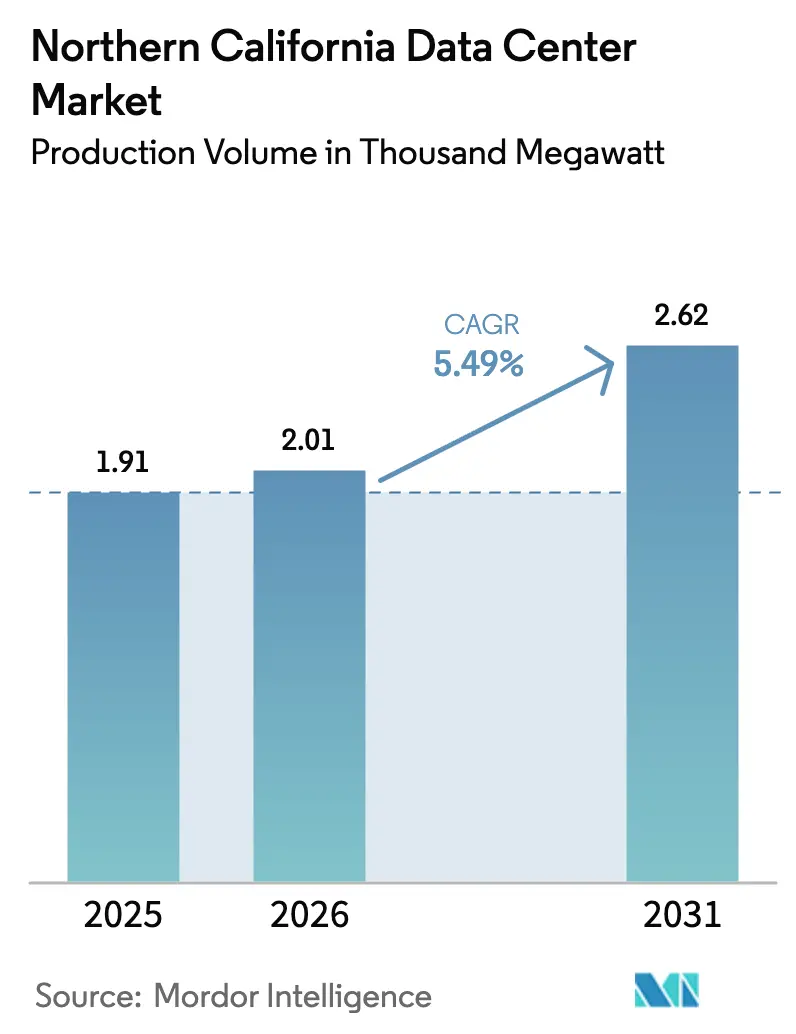
| Base Year Market Size (2025) | 1.91 Thousand megawatt |
| Market Volume (2026) | 2.01 Thousand megawatt |
| Market Volume (2031) | 2.62 Thousand megawatt |
| Growth Rate (2026 - 2031) | 5.49% CAGR |
| Market Concentration | Medium |
Major Players *Disclaimer: Major Players sorted in no particular order Image © Mordor Intelligence. Reuse requires attribution under CC BY 4.0. | |
Northern California Data Center Market Analysis by Mordor Intelligence
The Northern California data center market size in terms of production volume was valued at 1.91 thousand megawatt in 2025 and is estimated to grow from 2.01 thousand megawatt in 2026 to reach 2.62 thousand megawatt by 2031, at a CAGR of 5.49% during the forecast period (2026-2031). Continuing demand from hyperscale operators anchors growth as cloud, artificial intelligence, and high-density graphics workloads converge on the Bay Area. Operators race to lock long-term power contracts because 230 kV interconnects remain scarce and delivery queues stretch four to five years. Multistory construction offsets land that routinely tops USD 4.4 million per acre, while liquid-cooling adoption accelerates as GPU rack densities exceed 100 kW. Net-zero procurement targets from major hyperscalers also amplify interest in grid-connected solar-plus-battery energy storage systems.
Key Report Takeaways
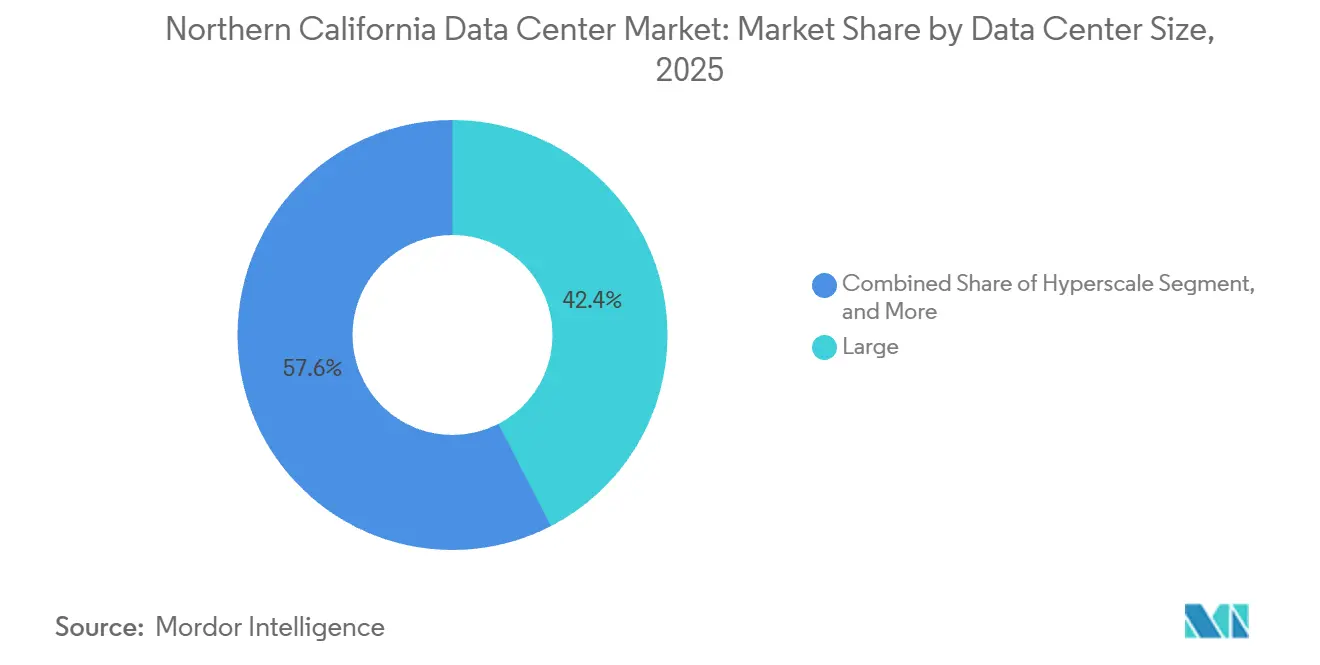
- By data center size, large facilities commanded 42.42% of Northern California data center market share in 2025 and hyperscale campuses are projected to register the fastest 6.12% CAGR through 2031.
- By tier type, Tier 3 configurations held 48.38% share in 2025 while Tier 4 builds are expected to grow at a leading 6.32% CAGR over the same period.
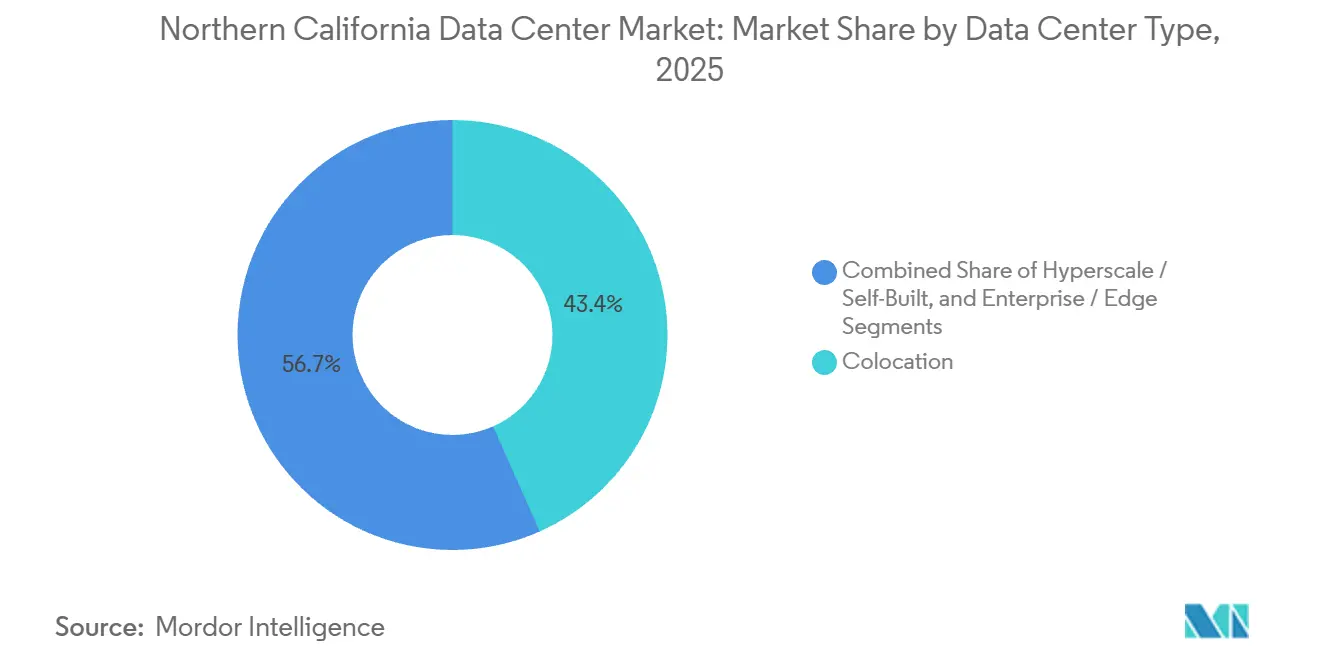
- By data center type, colocation sites accounted for 43.35% of 2025 capacity, yet self-built hyperscale facilities are forecast to deliver the highest 6.63% CAGR through 2031.
- By end user, IT and ITES accounted for a 49.61% share in 2025, and BFSI workloads are set to expand at a top-ranked 6.51% CAGR through 2031.
Note: Market size and forecast figures in this report are generated using Mordor Intelligence’s proprietary estimation framework, updated with the latest available data and insights as of 2026.
Northern California Data Center Market Trends and Insights
Drivers Impact Analysis*
| DRIVER | (~) % IMPACT ON CAGR FORECAST | GEOGRAPHIC RELEVANCE | IMPACT TIMELINE |
|---|---|---|---|
| AI-Centric Hyperscale Tranche Demand | +1.8% | Santa Clara, San Jose, Milpitas, spillover to Sacramento County | Short term (≤ 2 years) |
| Surging Film-Render and Streaming Workloads | +0.6% | Bay Area with backhaul to Southern California studios | Medium term (2-4 years) |
| West-Coast Subsea-Cable Landings | +0.9% | Eureka and Grover Beach landings that feed Bay Area interconnection hubs | Medium term (2-4 years) |
| 400 MW Solar plus BESS Power-Purchase Deals | +0.5% | Sacramento County, Daly City, Kern County sites that firm renewable supply | Long term (≥ 4 years) |
| Revitalisation of Hollywood Sound Stages | +0.2% | Primarily Los Angeles, limited direct benefit to Northern California | Long term (≥ 4 years) |
| LA Clean Grid 2045 Nuclear Micro-SMR Policy | +0.3% | Southern California regulatory template not yet adopted in Northern California | Long term (≥ 4 years) |
| Source: Mordor Intelligence | |||
AI-Centric Hyperscale Tranche Demand
Capital expenditure from Microsoft, Meta, and other hyperscalers exceeded USD 145 billion in fiscal 2025, and a significant portion funds new Northern California data centers that host latency-sensitive inference clusters. Operators book power slots four or more years ahead under PG&E Rule 30 to guarantee tariff certainty, which swells utility interconnection queues even before ground breaks. New campuses feature 200-500 MW single-tenant blocks that consolidate AI training, model tuning, and vector database workloads in one location. Rack-level densities regularly top 100 kW, driving widespread adoption of direct-to-chip and immersion cooling. Because such installations cannot be accommodated in legacy multi-tenant halls, developers increasingly pursue greenfield sites near existing substations to shorten cable runs and tensile losses.[1]Pacific Gas and Electric Company, “Data Center Interconnection Pipeline and Grid Upgrades,” PG&E.
Surging Film-Render and Streaming Workloads
Raw footage for modern features can exceed 2 petabytes, and converting 4K to 8K formats multiplies compute intensity more than fourfold. Cloud-based render workloads thus migrate north from Los Angeles to tap lower latency interconnect hubs in Santa Clara. Netflix, Apple, and Amazon maintain Bay Area edge nodes to pre-position high-resolution masters before global distribution, shielding studios from trans-Pacific congestion. Rising demand for 8K and volumetric video also boosts the Northern California data center market as equipment vendors colocate content delivery networks next to hyperscale fabrics. Although Hollywood redevelopment focuses on Southern California, Bay Area carriers benefit from the backhaul traffic that terminates at San Jose carrier hotels.
West-Coast Subsea-Cable Landings
The Echo, Hawaiki Nui, CAP-1, and Bifrost cables add more than 850 Tbps of potential capacity to California’s shoreline. Eureka’s new landing facility bypasses Los Angeles and trims up to 12 milliseconds of round-trip delay on Asia-Pacific routes, a difference that matters for synchronous model training jobs. Large tenants insist on diverse fiber paths to mitigate single points of failure created by seismic events, hence cable multiplicity ranks high in site-selection scoring matrices. Coastal landing diversity also shields operators from tranche-based price spikes on trans-Pacific bandwidth. Combined, these cables expand international reach and underpin the Northern California data center market growth trajectory.
400 MW Southern-CA Solar plus BESS PPAs
Utilities approved multiple long-duration battery energy storage projects, including SMUD’s 160 MW-640 MWh Dry Creek system and Marin Clean Energy’s 1 GWh Daly City project. Hyperscale buyers contract 10-year indexed rate agreements to match hourly consumption with carbon-free supply, satisfying 24 x 7 sustainability pledges. Battery-backed solar smooths the evening peak when photovoltaic output craters, thereby adding resilience to grids already strained by incremental data center load. Participation in energy-capacity markets provides an ancillary revenue stream that offsets higher Tier 4 construction costs. Long term, firm renewable procurement will remain integral to securing planning approvals in power-constrained counties.[2]Sacramento Municipal Utility District, “Dry Creek Battery Energy Storage System,” smud.org
Restraints Impact Analysis*
| Restraint | (~) % Impact on CAGR Forecast | Geographic Relevance | Impact Timeline |
|---|---|---|---|
| Scarce 230 kV Interconnects on PG&E Grid | -1.2% | Santa Clara, San Jose, Milpitas, Sacramento | Short term (≤ 2 years) |
| Lengthy Power-Delivery Queue (48-60 Months) | -0.9% | PG&E and Silicon Valley Power service territories | Medium term (2-4 years) |
| Rising Seismic-Design CAPEX Premiums | -0.4% | Bay Area, near Hayward and San Andreas faults | Long term (≥ 4 years) |
| Shortage of Tier IV-Certified Workforce | -0.6% | Bay Area and wider U.S. West Coast labor markets | Medium term (2-4 years) |
| Source: Mordor Intelligence | |||
Scarce 230 kV Interconnects on PG&E Grid
PG&E recorded 9.6 GW of pending data center load as of October 2025, yet only 1.4 GW advanced to detailed engineering. Smart Wires FlexNet devices unlocked 100 MW at Los Esteros substation, but operators still face multi-year delays for new loop additions. Silicon Valley Power offers more attractive tariffs, though its 18-square-mile service territory constrains capacity. Many developers now negotiate split feeds from both utilities to de-risk schedule slippage, albeit at higher upfront cost. Continued scarcity caps near-term expansion of the Northern California data center market, nudging some hyperscalers to scout inland or Pacific Northwest alternatives.
Lengthy Power-Delivery Queue (48-60 Months)
Developers typically take 4 to 5 years from interconnection request to energization, delaying interest accrual and tying up scarce acreage. PG&E requires customers to fund grid impact studies and network equipment that can add USD 50 million per 100 MW, squeezing project returns when construction materials already trend upward. Capacity Commitment proposals under review at CAISO would formalize queuing, but further elongate timelines for projects lacking firm power contracts. Some operators circumvent utility backlogs by pairing on-site generation with behind-the-meter renewables, yet financing such hybrid systems proves complicated under current market structures. Persistent delays temper expansion plans and moderate the longer-term Northern California data center market CAGR.[3]California Independent System Operator, “Capacity Commitment Framework Recommendations,” caiso.com
*Our forecasts treat driver/restraint impacts as directional, not additive. The impact forecasts reflect baseline growth, mix effects, and variable interactions.
Segment Analysis
By Data Center Size: Hyperscale Campuses Outpace Legacy Footprints
Hyperscale sites led the Northern California data center market's expansion, posting a 6.12% CAGR through 2031 as single-tenant campuses balloon beyond 300 MW. This form factor thrives because GPU training clusters become more efficient when network hops are minimized, and power management is centralized. Large facilities accounted for 42.42% of the Northern California data center market share in 2025. Large facilities between 50 MW and 150 MW retain relevance for mixed-tenant clouds that still handle enterprise lift-and-shift workloads. Medium-scale builds of 10-50 MW increasingly serve regional edge on-ramps for streaming and SaaS gateways. Small installations under 10 MW persist for disaster-recovery, IoT aggregation, and latency-critical financial trading. The Northern California data center market continues to tilt toward vertical designs that stack multiple 4 MW halls on scarce parcels, optimizing land costs while maintaining clear paths for power and chilled water retrofits.
Second-generation hyperscale campuses in Santa Clara incorporate 30-foot clear heights and reinforced floor slabs to accommodate immersion tanks without structural upgrades. Developers site step-down substations within property lines to avoid meter-fee markups, and redundant 230 kV feeders branch into radial 34.5 kV loops. Modular block construction shortens build schedules from 24 to 18 months, an increasingly significant differentiator as customer pipelines advance. With such dynamics, hyperscale capacity now represents the most contested slice of the Northern California data center market, drawing joint ventures between infrastructure funds and cloud providers to pool land, capital, and staffing.


By Tier Type: Tier 4 Gains as Inference Demands Five-Nines Uptime
Tier 3 remained dominant in 2025 with 48.38% Northern California data center market share, a legacy of enterprise hosting norms that tolerated brief maintenance windows. Tier 4 capacity, however, accelerates at 6.32% CAGR because GPU inference workloads crash when milliseconds of interruption occur. Financial market regulators and hyperscalers alike insist on 99.995% uptime, steering new builds toward 2N+1 electrical topologies, concurrently maintainable switchgear, and dual active chillers. Construction premiums of roughly 40% are offset by lower service-level-agreement penalties and reduced unplanned outage costs.
Seismic engineering further pushes designs to Tier 4 thanks to Zone 4b requirements that mandate base isolation or moment-frame structures capable of absorbing 0.5 g peak ground acceleration. Operators adopt triple redundant fuel systems and automated load-shedding controls that prioritize AI inference workloads over batch analytics. Skills scarcity remains an obstacle because Tier IV-certified technicians command premium wages; nevertheless, owners now fund apprenticeship programs to sustain pipelines of electrical and mechanical specialists who can keep fault-tolerant environments online.
By Data Center Type: Self-Built Hyperscale Surges Past Colocation
Colocation represented 43.35% of 2025 installed capacity, yet self-built hyperscale campuses post the strongest 6.63% CAGR, reflecting tenants’ preference to control land, power, and cooling. Direct ownership lowers lifetime cost of capital and allows proprietary innovations such as rear-door heat exchangers or coolant distribution units pre-integrated at rack scale. Retail colocation cabinets give way to wholesale suites where tenants lease entire halls and customize inter-hall network fabrics.
Cloud providers increasingly treat the Northern California data center market as a strategic asset, leveraging direct utility agreements and merchant-tail PPAs to hedge energy cost volatility. CoreSite and Digital Realty respond by certifying NVIDIA DGX readiness and offering chilled glycol loops that support liquid cooling retrofits, blurring the line between retail and hyperscale. Enterprises that retain on-premises footprints often choose hybrid models that mix private cage space with public cloud APIs, but their share drifts sideways as new AI projects default to hyperscale builds.
By End User: BFSI Leads Growth Amid Regulatory Mandates
IT and ITES players still dominate overall capacity, with 49.61% market share in 2025, but BFSI exhibits the most rapid gains, expanding at a 6.51% CAGR as resilience mandates tighten. Federal Reserve SR 13-19 and SEC Regulation SCI oblige brokers and alternative trading systems to prove redundancy across physical infrastructure, network connectivity, and staffing. Consequently, banks migrate their tier-zero trading and clearing platforms to Tier 4-certified facilities that offer real-time audit trails and dual utility feeds.
E-commerce groups maintain consistent edge cache demand to support one-day fulfillment promises, yet many consolidate into hyperscale footprints shared with cloud divisions of their parent companies. Defense agencies, highlighted by the 100 MW CyrusOne-U.S. Navy project at NAS Lemoore, bring classified workloads that require distance from urban blast radii yet proximity to Bay Area fiber nodes. Media firms escalate GPU render workloads but still prefer Southern California for primary staging, utilizing Bay Area interconnects mainly for Pacific Rim distribution. Overall, regulatory rigor continues to shape workload placement across the Northern California data center market.
Geography Analysis
Santa Clara County houses more than 60% of Northern California data center market size because it combines dense metro fiber, multiple carrier hotels, and municipal incentives that offset elevated land valuations. Interconnection ecosystems clustered at Great Oaks Boulevard and Walsh Avenue foster network effects, while proximity to San Jose Mineta International Airport expedites parts logistics. Limited substation headroom drives taller buildings rather than wider ones, and many parcels now feature six-story, 360-foot-deep pile foundations that address both seismic and height ordinances.
The East Bay, encompassing Fremont and Hayward, provides relatively lower land costs but faces longer permitting cycles and weaker subsea cable adjacency. Nevertheless, enterprises with moderate latency requirements select these locations to balance cost and proximity to workforce hubs. Sacramento County emerges as an ancillary destination where SMUD’s renewable mix and lower tariffs lure hyperscale overflow, albeit at the expense of slightly higher round-trip latency to San Francisco endpoints.
Farther south, NAS Lemoore represents a strategic infill submarket that leverages Department of Defense infrastructure and air-gap security mandates. Although 150 miles from Silicon Valley, the base connects via dark fiber trunks that deliver sub-3-millisecond latency, acceptable for many backup or defense workloads. Together, these geographies create a multi-node fabric that sustains the Northern California data center market expansion even as core Santa Clara acreage tightens.
Regulatory Landscape
Northern California data center development sits under California energy-efficiency and disclosure requirements, alongside county and city entitlement processes that frequently turn on power and water impacts. The California Energy Commission (CEC) administers Building Energy Efficiency Standards (Title 24, Part 6), which shape mechanical system design for computer rooms, and the CEC Building Energy Benchmarking program requires standalone data centers over 50,000 square feet to report energy-use data annually.
Policy attention increased during the 2025-2026 legislative session as multiple bills targeted data center siting and operating impacts. Senate Bill 57 directs the California Public Utilities Commission (CPUC) to study and report by January 1, 2027 on the effect of data center electricity consumption on retail ratepayers, while proposals such as SB 887 and AB 1577/AB 2619 address environmental review and energy and water reporting, reinforcing compliance as a gating item for Bay Area projects facing long power-delivery queues.
Value Chain Analysis
The Northern California data center value chain begins with site origination and entitlement in land-constrained submarkets such as Santa Clara, then shifts to power procurement and interconnection planning with utilities (notably PG&E and Silicon Valley Power) as a critical path input. Developers and owners coordinate early for transmission-level or substation-adjacent capacity because 230 kV access is scarce and energization can take 48-60 months, which pulls electrical design, switchgear lead times, and network upgrade funding forward in the project schedule.
On the demand and services side, hyperscalers and colocation operators drive the ecosystem through cloud on-ramps and dense connectivity, supported by network exchanges and carrier hotels across Silicon Valley. Operators such as CoreSite, Cyxtera, and Aligned combine high-density buildouts with interconnection fabrics and AI-ready infrastructure, including liquid-cooling capable halls, while downstream layers include managed services and security and compliance (for example, ISO-aligned controls and auditability demanded by regulated end users), plus ongoing energy-performance reporting under California programs.
Competitive Landscape
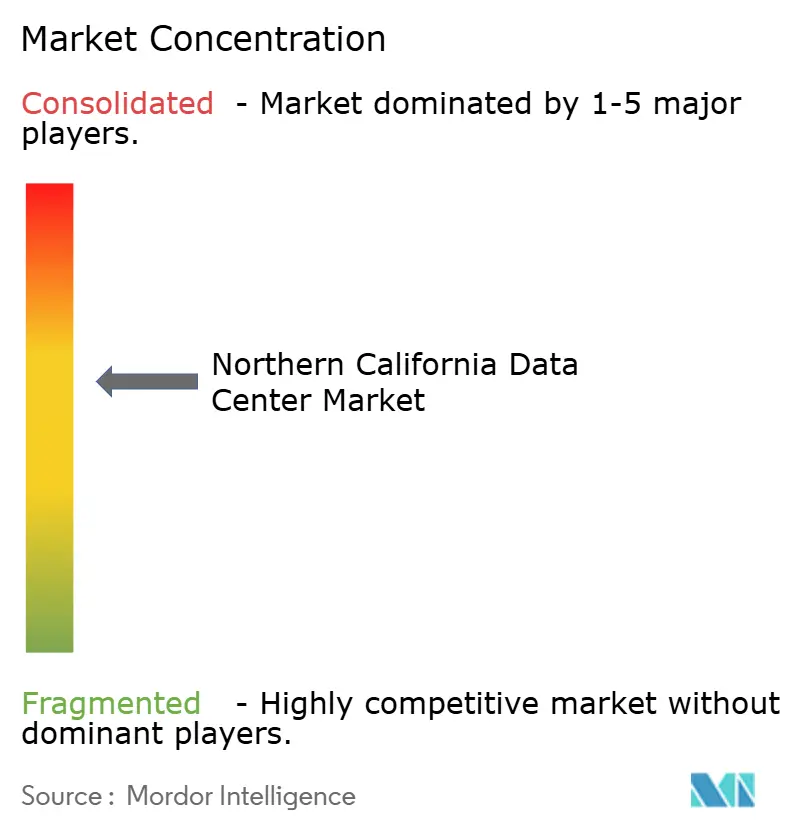
The Northern California data center market has a moderate concentration profile. Digital Realty extends existing campuses rather than green-fielding new plots, leveraging grandfathered power agreements to shorten energization timelines. Equinix prefers network-dense infill builds that capture interconnect revenue streams alongside colocation rents. Vantage employs high-density designs and recently partnered with Liberty Energy to explore on-site micro-grids that could bypass PG&E queues.
Emerging players differentiate via green finance and purpose-built AI capacity. EdgeCore secured a USD 440 million green loan and applies energy-usage-intensity covenants to attract ESG-focused tenants. Lambda offers Nvidia GB200 NVL72 racks as a managed service, appealing to start-ups that cannot sign 80 MW anchor leases. Flexential finances growth through asset-backed securities, channeling proceeds into connectivity that supports its stake in the Bifrost cable, thereby improving Pacific Rim latency.
Technology roadmaps pivot on liquid immersion cooling, silicon photonics, and DC busway architectures that lower line losses under 48 V power distribution. Operators also deploy hydrogen-ready fuel cells and trial modular reactors under early environmental permitting. Compliance overlays such as ISO 27001 and ASCE 7 increasingly influence tenant sourcing, rewarding providers that can package uptime guarantees with auditable sustainability metrics. Overall, competition centers on speed-to-power and the ability to secure multi-decade utility agreements ahead of rivals.
Northern California Data Center Industry Leaders
CoreSite Realty Corporation
Cyxtera Technologies, Inc.
Aligned Data Centers, LLC
Vantage Data Centers, LLC
NTT Global Data Centers Americas, Inc.
- *Disclaimer: Major Players sorted in no particular order

Market Opportunities and Future Outlook
Near-term whitespace centers on projects that can secure utility-aligned power and move entitlements forward in Santa Clara and adjacent nodes, where interconnection scarcity is the binding constraint. April 2026 permitting for a 72 MW, four-story CoreSite facility at 2805 Bowers Avenue in Santa Clara, paired with a planned 72 MVA substation on the Silicon Valley Power network, highlights the premium for developments that connect real estate expansion directly to deliverable electrical infrastructure.
Opportunities also extend to compliance-led, measurable efficiency and reporting solutions as California agencies and legislators increase scrutiny of data center grid, water, and ratepayer impacts. With the CEC already requiring annual reporting for standalone data centers over 50,000 square feet and the CPUC directed under SB 57 to deliver a retail-ratepayer impact study by January 1, 2027, operators and vendors that package auditable energy and water data pipelines, high-density cooling retrofits, and renewable-matched procurement structures have a clearer pathway through permitting, tenant sourcing, and utility engagement in Northern California.
Recent Industry Developments
- April 2026: CoreSite Realty Corporation permitted a 72 MW, four-story data center at 2805 Bowers Avenue in Santa Clara, supported by a planned 72 MVA substation on the Silicon Valley Power network. The Santa Clara campus expansion aligns with power-infrastructure development near the grid. The expansion increases NC California capacity and strengthens grid-coupled data-center development near-term.
- February 2026: CoreSite Realty Corporation purchased three Santa Clara buildings for $100 million on a site designated for a 244,000 sq ft data center development. The move signals capex commitment and expands the Santa Clara footprint. It increases near-term pipeline and anchor-point for Bay Area data-center growth.
- January 2026: Vantage Data Centers with Liberty Energy partnered to evaluate utility-scale power solutions and on-site microgrids for Northern California campuses. The collaboration emphasizes power resilience and grid integration in NC California market. It could accelerate on-site power and sustainability-enabled capacity, impacting energization timelines.


Research Methodology Framework and Report Scope
Market Definition and Coverage
For this report, the market covers revenue linked to data center capacity in Northern California, including colocation and hyperscale facilities, as measured through sellable power and related space that is contracted and built in the region.
Scope exclusions: We exclude enterprise server rooms inside non data center buildings, and we do not count telecom central offices unless they are run as commercial data center capacity.
Segmentation Overview
- By Data Center Size
- Small
- Medium
- Large
- Hyperscale
- By Tier Type
- Tier 1 and 2
- Tier 3
- Tier 4
- By Data Center Type
- Hyperscale / Self-Built
- Enterprise / Edge
- Colocation
- Non-Utilized
- Utilized
- Retail Colocation
- Wholesale Colocation
- By End User
- BFSI
- IT and ITES
- E-Commerce
- Government
- Manufacturing
- Media and Entertainment
- Telecom
- Other End Users
Data Sources, Market Sizing, and Validation
Desk Research
Desk research is used to map the real, physical supply pipeline and the constraints that control it in Northern California, before any numbers are modeled. We rely on public power and permitting signals and then connect them back to data center capacity additions, because this market can be limited by interconnection and substation availability.
Common inputs include public utility and energy planning material such as the California Energy Commission, U.S. Energy Information Administration, and local air quality and building permit portals, along with publications from groups such as Uptime Institute and AFCOM. We also review company filings, project announcements, and credible local business press, and we use paid subscriptions for company financials and intelligence, news and financials, patent databases, and import export shipment level checks when equipment constraints become a key assumption. This list is illustrative only, and many other sources were also used for collection, validation, and clarification.
Primary Interviews and Surveys
Primary work focuses on validating what is actually deliverable in the next 5 to 7 years, and what portion of planned MW can reach commissioning on time. We speak with operators, engineering and construction stakeholders, power and cooling ecosystem participants, and large buyers, which helps us correct for announced pipelines that are delayed by power, land, or permitting.
Inputs were checked across major demand pockets in the Bay Area and surrounding Northern California submarkets so that assumptions on absorption timing, pricing direction, and pre leasing reflect what is happening on the ground.
Distribution of primary research fieldwork respondents
| Company type | Respondent position | Region |
|---|---|---|
| Top tier: 30% | CXOs: 16% | APAC: 46% |
| Mid tier: 54% | Functional/Unit leaders: 32% | EMEA: 29% |
| Smaller Players: 16% | Managers: 52% | Americas: 25% |
Market-Sizing & Forecasting
Sizing is built from a top down view where regional supply, power availability, and active capacity pipeline are reconstructed, and then translated into market value using typical pricing for contracted capacity. To keep the model realistic, results are cross checked with selective bottom up approximations, such as sampled MW additions by facility type, channel checks on leased versus available capacity, and a sanity check of implied pricing per kW month against what interviews suggest.
Key inputs include installed IT load (MW), capacity under construction and planned, commissioning timelines, vacancy and absorption direction, and typical rack density shifts that influence space needs per MW. Where gaps appear, like projects that disclose space but not power, conversions are applied using observed densities from interviews, and the sensitivity is reviewed before finalizing.
Forecasts use scenario analysis supported by simple regression style relationships between new MW delivery, power queue timing, and demand indicators such as cloud and AI workload intensity (as described by respondents). This helps keep the forecast grounded when one bottleneck, like utility lead times, changes faster than pricing.
Data Validation & Update Cycle
Outputs are validated through triangulation across supply side pipeline tracking, power and permitting signals, and primary feedback on what is likely to be commissioned versus pushed out. If a submarket shows unusual jumps in MW or pricing, the underlying assumptions are rechecked and the related sources are revisited, and follow up calls are triggered when the variance is material.
Before sign off, the model and logic go through multi step analyst review so calculation errors, unit mismatches, and timing overlaps are removed. Reports are refreshed annually, and interim updates are made when major events occur, such as a large capacity announcement, a utility constraint update, or a notable commissioning delay. Right before delivery, a final pass is done so clients receive the most current view available.
Mordor Intelligence's Northern California Data Center Market Size Versus Other Published Estimates
Published estimates for Northern California data centers can look far apart because the market can be expressed in MW, in square feet, or in USD, and each choice needs a different conversion and timing assumption. Differences also come from whether planned capacity is counted as supply today, how pricing is treated for contracted versus available capacity, and how fast high density deployments are assumed to change sellable capacity.
The biggest gap drivers usually sit in the treatment of IT load versus total facility power, the inclusion of build to suit and owner occupied capacity, and how pipelines are adjusted for power delivery queues. Currency timing is also a factor when sources mix current dollars and constant dollars, and refresh cadence matters because a single utility update can shift commissioning timing by multiple quarters.
Benchmark comparison
| Source | Market Size | Gaps in Research Methodology |
|---|---|---|
| Mordor Intelligence | USD 1.91 B (2025) | |
| Trade Journal A | USD 2.45 B (2025) | Often converts from space to value using broad $/SF assumptions, which can overstate totals in Northern California when higher rack densities reduce square feet per MW. |
| Regional Consultancy B | USD 1.55 B (2025) | Tends to count only commissioned colocation supply and may exclude hyperscale capacity that is contracted but not yet delivered, which lowers the near term market value. |
The table shows a noticeable spread, and in Mordor Intelligence's model the value is tied to IT load capacity (MW) and commissioning and absorption timing, which reduces double counting between planned, under construction, and live supply. When those same steps are not followed, the result is usually either an inflated total from optimistic pipeline adds, or a lower number that misses contracted capacity still moving through power and permitting.


Key Questions Answered in the Report
How fast is hyperscale capacity growing in Northern California?
Hyperscale campuses are projected to register a 6.12% CAGR between 2026 and 2031, making them the fastest-growing size category.
Which tier design will dominate new Northern California builds?
Tier 4 is expected to gain share quickest, rising at a 6.32% CAGR as AI inference workloads require 99.995% uptime.
What are the major power constraints facing new entrants?
Scarcity of 230 kV interconnects and a 48-60-month utility queue remain the primary obstacles to swift energization.
Why are BFSI workloads shifting to Northern California data centers?
Federal Reserve SR 13-19 and SEC Regulation SCI push banks toward Tier 4 sites that provide higher resilience and auditable controls.
How does subsea cable expansion influence the region?
New systems such as Echo, Hawaiki Nui, CAP-1, and Bifrost deliver more than 850 Tbps of aggregate capacity, reducing latency to Asia-Pacific destinations.
What cooling technologies are operators adopting for GPU racks?
Direct-to-chip, rear-door heat exchangers, and immersion cooling solutions are now standard for racks exceeding 100 kW densities.
Page last updated on:






