
North America Outdoor Lighting Market Size and Share
Market Overview
| Study Period | 2020 - 2031 |
|---|---|
| Forecast Data Period | 2026 - 2031 |
| Base Year Market Size (2025) | USD 5.93 Billion |
| Market Size (2026) | USD 6.28 Billion |
| Market Size (2031) | USD 8.36 Billion |
| Growth Rate (2026 - 2031) | 5.91 % |
| Market Concentration | Medium |
Major Players *Disclaimer: Major Players sorted in no particular order Image © Mordor Intelligence. Reuse requires attribution under CC BY 4.0. | |
North America Outdoor Lighting Market Analysis by Mordor Intelligence
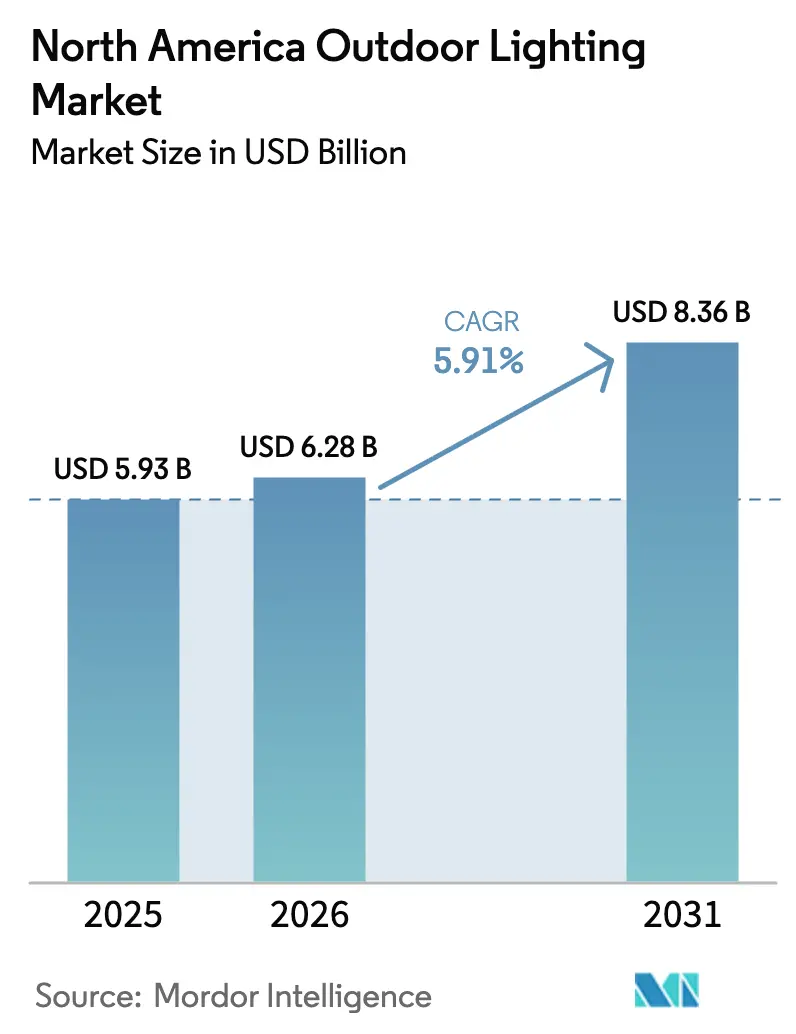
The North America outdoor lighting market size is expected to grow from USD 5.93 billion in 2025 to USD 6.28 billion in 2026 and is forecast to reach USD 8.36 billion by 2031 at 5.91% CAGR over 2026-2031. This solid expansion rests on municipal streetlight retrofits, rising federal energy-efficiency incentives, and the roll-out of smart-city programs that embed connected luminaires into broader IoT networks. As high-pressure sodium fixtures give way to LED and connected-ready systems, cities capture double-digit energy savings, while commercial property owners adopt landscape and security lighting to elevate brand experiences and site safety. Competitive intensity sharpens as incumbents add AI-driven controls and cybersecurity features, yet supply-chain swings in LED driver integrated circuits and community concerns about light pollution temper near-term momentum. Opportunities remain significant in solar-powered solutions for resilience projects, connected lighting in electric-vehicle charging hubs, and dark-sky-compliant fixtures demanded by suburban communities.
Key Report Takeaways
- By application, the residential outdoor segment held 35.12% revenue share in 2025, while commercial outdoor lighting is projected to expand at a 7.32% CAGR to 2031.
- By lighting type, LEDs commanded 79.45% of the North America outdoor lighting market share in 2025, whereas connected-ready LEDs are forecast to rise at an 7.62% CAGR through 2031.
- By installation mode, conventional stand-alone systems accounted for 60.95% of the North America outdoor lighting market size in 2025; however, connected and smart installations are advancing at a 7.54% CAGR through 2031.
- By geography, the United States captured 45.35% of the regional value in 2025 and is expected to register the highest CAGR of 7.78% during the forecast period.
Note: Market size and forecast figures in this report are generated using Mordor Intelligence’s proprietary estimation framework, updated with the latest available data and insights as of 2026.
North America Outdoor Lighting Market Trends and Insights
Drivers Impact Analysis*
| DRIVER | (~) % IMPACT ON CAGR FORECAST | GEOGRAPHIC RELEVANCE | IMPACT TIMELINE |
|---|---|---|---|
| Energy-efficient retrofits in municipal streetlighting | +1.8% | United States, Canada, Mexico | Medium term (2-4 years) |
| Federal and state rebates accelerating LED adoption | +1.2% | United States primarily, limited Canada | Short term (≤ 2 years) |
| Smart-city mandates and IIoT integration of luminaires | +1.5% | Major metropolitan areas across North America | Long term (≥ 4 years) |
| Surge in outdoor e-mobility charging-infrastructure lighting | +0.9% | Urban centers in the United States and Canada | Medium term (2-4 years) |
| Micro-grid and resilience projects in climate-vulnerable zones | +0.6% | Coastal regions, wildfire-prone areas | Long term (≥ 4 years) |
| AI-enabled adaptive dimming for dark-sky compliance | +0.4% | North America, focus on rural and suburban areas | Long term (≥ 4 years) |
| Source: Mordor Intelligence | |||
Energy-efficient retrofits in municipal streetlighting
Large-scale LED conversions deliver 50-70% energy savings and swift paybacks for cities across the region. The City of Placentia saves USD 158,120 each year from a 3,400-fixture project and expects USD 3.1 million in lifetime benefits.[1] Edmonton completed 46,000 LED retrofits that cut greenhouse-gas emissions by 5,500 tonnes and reduced annual operating costs by USD 1.2 million. The American Council for an Energy-Efficient Economy estimates that nationwide conversion of U.S. streetlights could save 20,200 GWh annually and reduce municipal spending by USD 1 billion.[2]Energy-service contracts and volume-purchase alliances shorten payback windows for smaller jurisdictions, while advanced dimming pilots in Colorado Springs reveal incremental energy reductions of 1–51% through adaptive scheduling. These robust outcomes reinforce LED retrofits as the market’s strongest growth engine through mid-decade.
Federal and state rebates accelerating LED adoption
Utility and state rebate programs offset upfront capital, enabling municipalities to deploy LED projects within constrained budget cycles. Roughly 77% of U.S. zip codes qualify for some form of lighting rebate, which lowers effective project costs and compresses payback periods to below five years in many cases.[3] Maryland directed USD 1 million in FY 2024 grants to its Streetlight and Outdoor Lighting Efficiency initiative, while New York and Massachusetts offer tiered incentives for Clean-Energy-Community participants. National Grid finances conversions through on-bill repayment mechanisms that align debt service with realized energy savings. Oregon updated its incentive schedules in 2025, underscoring the state's continued policy support. These financial levers expedite procurement decisions, particularly in small and mid-sized cities that struggle with capital budget constraints.
Smart-city mandates and IIoT integration of luminaires
Connected luminaires form the digital backbone of emerging smart-city ecosystems. Washington, D.C. has contracted 75,000 smart streetlamps equipped with remote management and environmental sensing functions.[4] Itron manages over 4 million smart fixtures worldwide, achieving 50% energy savings and 20% lower operational costs for its municipal clients. Los Angeles utilizes multi-functional poles that host Wi-Fi gateways, public safety beacons, and weather stations, transforming its lighting infrastructure into a revenue-generating urban platform. Spokane is piloting AI algorithms that predict dimming schedules based on traffic density to optimize luminaire performance. These deployments validate connected lighting as a resilient, data-rich asset class that municipalities can monetize over the long life of their assets.
Surge in outdoor e-mobility charging-infrastructure lighting
Rapid roll-outs of EV chargers generate demand for purpose-built luminaires that meet accessibility and safety criteria. The U.S. Access Board specifies illumination requirements for charging stations to ensure that all users have safe and navigable access to these spaces.[5] NECA 413 prescribes installation practices that integrate lighting with Level 1, Level 2, and DC fast-charging equipment for consistent performance. SAE J1772 electrical and safety standards guide luminaire specification for charger canopies positioned in retail parking lots and highway corridors. As federal infrastructure funding accelerates charger deployment, lighting suppliers are enjoying a new channel whose growth parallels the broader electrification of transportation.
Restraints Impact Analysis*
| RESTRAINTS | (~) % IMPACT ON CAGR FORECAST | GEOGRAPHIC RELEVANCE | IMPACT TIMELINE |
|---|---|---|---|
| High upfront CAPEX versus budget cycles | -1.4% | North America, particularly smaller municipalities | Short term (≤ 2 years) |
| Persistent supply-chain volatility in driver ICs | -0.8% | North America, dependent on Asian semiconductor supply | Medium term (2-4 years) |
| Community opposition on light-pollution grounds | -0.6% | Rural and suburban North America | Medium term (2-4 years) |
| Cyber-security risks in connected street-lights | -0.3% | Urban areas with smart-city deployments | Long term (≥ 4 years) |
| Source: Mordor Intelligence | |||
High upfront CAPEX versus budget cycles
Despite favorable total-cost-of-ownership metrics, LED streetlight projects can stall when annual municipal budgets are unable to absorb large capital outlays. The U.S. Department of Energy identifies financing gaps as the top hurdle to comprehensive conversions, especially in towns with populations under 25,000. Performance contracts and vendor-backed leases align payments with energy savings, yet council approvals often prolong deal closures. Public-power utilities offer low-interest loans, though fiscal-year timing may still delay project mobilization. Volume-purchase alliances reduce fixture prices by as much as 15%, but procurement rules vary by state, adding complexity to already stretched administrative staff. These headwinds slow short-term uptake even when life-cycle economics remain compelling.
Persistent supply-chain volatility in driver ICs
The post-pandemic semiconductor landscape presents ongoing challenges for luminaire manufacturers that source driver chips from Asia. Lead times doubled in early 2025, forcing suppliers to carry elevated inventories that tie up working capital. Dialight’s USD 7.8 million judgment in a 2024 supply-agreement dispute underscores the financial risks of component shortages. Some vendors respond by dual-sourcing and redesigning drivers to accept alternative chipsets, yet qualification cycles can stretch beyond customer bid deadlines. Delays ripple through municipal retrofit schedules and create spot shortages that inflate fixture prices. Although the broader semiconductor market is normalizing, driver IC volatility remains a medium-term drag on deployment velocity.
*Our forecasts treat driver/restraint impacts as directional, not additive. The impact forecasts reflect baseline growth, mix effects, and variable interactions.
Segment Analysis
By Type of Application: Commercial growth outpaces entrenched residential demand
The residential segment led the North America outdoor lighting market with 35.12% revenue share in 2025 as homeowners invested in motion-sensing security lights, landscape accents, and architectural uplighting. Commercial venues, however, are scaling fastest and are projected to register a 7.32% CAGR through 2031, as retailers, hotels, and mixed-use developers utilize dynamic façade lighting to enhance brand appeal and customer safety. Retail chains are installing connected luminaires in parking lots to integrate surveillance cameras and license-plate readers, while hospitality operators are upgrading pool-deck and pathway fixtures to meet evolving guest-experience standards. Industrial facilities embrace high-output LEDs that resist vibration and extreme temperatures, reducing maintenance downtime in continuous-operation environments. Stadiums and large arenas are adopting tunable-white floodlights that meet broadcasting requirements and enable color-themed spectacles for concerts and special events.
Demand diversification underpins the North America outdoor lighting market, encouraging suppliers to tailor photometric distributions and control protocols for specific verticals. Landscape designers favor low-voltage LED bollards to accent native flora, whereas logistics campuses require high-mast poles with glare shields to comply with local ordinances. As commercial property owners pursue sustainability certifications, networked controls that provide energy dashboards become procurement differentiators. The interoperable D4i standard enables asset managers to mix and match drivers and nodes across multi-site portfolios, thereby simplifying spare parts logistics. By 2030, commercial adoption of adaptive dimming and occupancy sensing is expected to set new benchmarks that spill over into the still-dominant residential category.


By Type of Lighting: Connected LEDs redefine value proposition
LED fixtures captured 79.45% of the North America outdoor lighting market in 2025, reflecting the near-complete displacement of high-pressure sodium and metal-halide incumbents. Connected-ready LEDs represent the fastest-growing slice with an 7.62% CAGR, fueled by municipal mandates for asset-level data and predictive maintenance. Current projects demonstrate connected systems reducing truck rolls by more than 30% through remote fault detection, thereby shrinking operating budgets for public works departments. In the commercial realm, mall owners adopt Bluetooth-mesh luminaires that double as wayfinding beacons, while campuses layer Wi-Fi and environmental sensors onto existing poles to expand digital services without trenching new conduit.
The integration of AI-driven adaptive dimming can achieve energy savings of up to 80% compared to legacy systems, highlighting the widening performance gap between smart and static fixtures. Interoperability remains a top concern, and the D4i certification process gains momentum as cities insist on future-proof deployments. Vendors are rushing to integrate edge-based cybersecurity features to meet procurement clauses that reference ioXt Alliance standards.
By Installation Mode: Smart systems gain speed against conventional incumbents
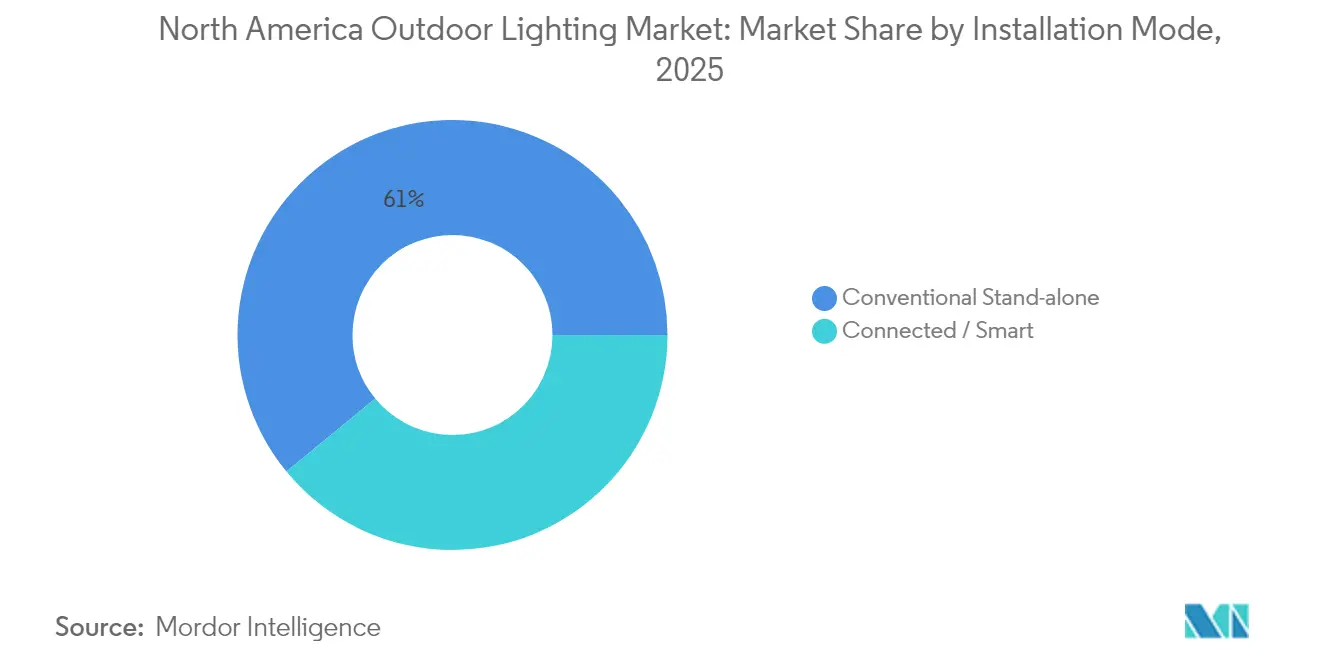
Conventional stand-alone installations still account for 60.95% of the North America outdoor lighting market size, reflecting the immense installed base of fixtures that operate via photocells and fixed schedules. Yet connected and smart installations are increasing at a 7.54% CAGR, aided by the falling price of wireless nodes and cloud-based management platforms. Pacific Northwest National Laboratory has cataloged 57 distinct cybersecurity threats to networked lighting, prompting manufacturers to harden firmware and implement certificate-based authentication. Solutions like Ubicquia’s UbiCell stream 32 telemetry points, enabling utilities to verify voltage levels and detect pole knock-downs in real time, while demonstrating up to 40% energy savings.
Municipal procurement guidelines now require bidders to disclose their cybersecurity certifications, positioning the ioXt “NLC” profile at the forefront of tender requirements. These specifications help cities avoid expensive rip-and-replace scenarios if vulnerabilities surface. For rural networks where fiber is scarce, cellular-enabled photocontrols tested in Acuity Brands’ Cell Connect pilot show strong throughput even at pole-top heights, thereby bringing smart-city functionality to suburban corridors. As depreciation schedules align with fixture lifespans, many agencies plan to convert the remaining conventional stock at end-of-life, accelerating connected penetration in the outer years of the forecast.
Geography Analysis
The United States dominated the North America outdoor lighting market with a 45.35% share in 2025 and is projected to grow at an 7.78% CAGR to 2031. Chicago retrofitted more than 280,000 streetlights, forecasting savings exceeding USD 100 million over ten years. Federal grants tied to the Bipartisan Infrastructure Law, along with extensive utility rebate coverage that spans 77% of zip codes, underpin the continued momentum. Strict outdoor lighting codes in jurisdictions such as Maine drive demand for compliant fixtures that cap correlated color temperatures at 3000 K and restrict upward light output. California agencies complement those efforts with dark-sky audits that encourage adaptive dimming during low-traffic hours.
Canada ranks second in regional revenue, thanks in part to provincial programs and municipal climate goals. Edmonton’s LED conversion demonstrates tangible gains, while Hamilton, Ontario, leverages solar-powered Illumient poles to avoid costly trenching on rocky terrain. Ontario’s Save on Energy rebates cover a percentage of project costs for commercial customers, accelerating uptake in retail and industrial parks. Canadian cities are also testing hybrid smart-solar systems that maintain illumination during grid outages, thereby enhancing resilience against severe winter storms.
Mexico trails in absolute value but shows steady growth tied to industrial parks, maquiladora zones, and new suburban housing. U.S. suppliers maintain production plants south of the border, hedging tariff risks while shortening lead times for domestic orders. Mexican municipalities are experimenting with energy-as-a-service contracts structured in U.S. dollars to mitigate currency volatility. Although national incentive programs are less robust, cross-border technology transfer and competitive fixture pricing support a healthy pipeline of retrofit bids, especially in northern states with strong manufacturing clusters.
Regulatory Landscape
Outdoor lighting in North America is shaped by energy-efficiency requirements, utility-administered program rules, and light-pollution ordinances that increasingly affect fixture-level specification. In the United States, California Energy Commission requirements under the California Code of Regulations, Title 24, Part 6 (Energy Code, 2025) set nonresidential outdoor lighting control provisions, cap allowable lighting power, and reference backlight-uplight-glare (BUG) zonal lumen limits, which is pushing wider adoption of controllable LEDs and compliant optics for projects in California jurisdictions.
At the same time, light-trespass and sky-glow controls are spreading through local ordinances across the United States and Canada, as tracked by DesignLights Consortium (DLC) ordinance mapping as of March 20, 2026. DarkSky International also standardizes how communities write and enforce these rules through policy templates and its Five Principles of Responsible Outdoor Lighting at Night, reinforcing procurement language around shielding, limits on uplight, and appropriate color temperature in residential, street, and area-lighting tenders.
Value Chain Analysis
The outdoor lighting value chain spans LED package and driver IC suppliers, optics and thermal-component vendors, luminaire OEMs, contract manufacturers, and controls-software and connectivity partners, with distribution carried out through agents, electrical wholesalers, and project channels such as municipal bidding, ESCOs, and design-build contractors. A key constraint in recent cycles has been electronics and driver availability, which has translated into longer qualification cycles and higher inventory buffering for manufacturers. This, in turn, affects delivery risk and pricing within municipal retrofit schedules.
Recent ownership changes and asset transfers also show how supply continuity and service coverage can shift within the chain. In May 2026, Beta LED Lighting, LLC and Lumen LED Lighting, LLC acquired substantially all assets of Cree Lighting USA, CLNA Holdings, E-Conolight, and Cree Lighting Canada via a secured-party sale under Article 9 of the Uniform Commercial Code, highlighting how legacy brands and installed-base support can move to new entities. At the same time, leading manufacturers increasingly operate with separate front-end sales structures and agent networks while sharing back-end infrastructure to manage costs, and the value chain is extending downstream into connected controls, cybersecurity assurances, and data services that attach recurring value to installed luminaires.
Competitive Landscape
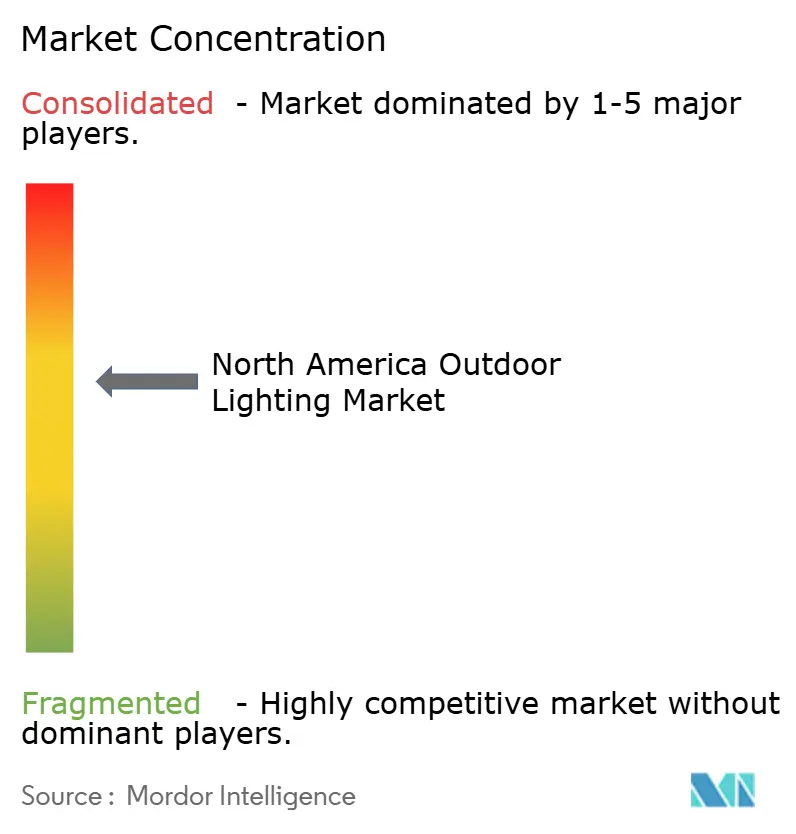
The North America outdoor lighting market is moderately fragmented. Acuity Brands led the revenue league after posting USD 951.6 million in net sales for Q1 FY 2025, and the firm further broadened its portfolio by acquiring QSC for USD 1.2 billion to integrate advanced audio and control systems with smart luminaires. Kingswood Capital’s roll-up strategy led to the creation of Coleto Brands, which merged Kichler and Progress Lighting to form a sizable residential platform with a combined deal value of USD 256 million. Dialight’s manufacturing-supply dispute with Sanmina highlights the operational risk associated with contract electronics manufacturing.
Innovation awards reflect the competition for technological leadership. The 2024 IES Progress Report accepted 14 products each from Signify and RAB Lighting, while Acuity Brands and Green Creative earned seven selections, underscoring a focus on connected controls and bio-adaptive LEDs. Cooper Lighting Solutions garnered attention for its BioUp melanopic system, which supports circadian-friendly outdoor environments. Smaller firms are carving niches in solar-powered fixtures and dark-sky-certified optics as municipalities tighten their light-pollution rules.
Strategic moves center on partnerships with telecoms, sensor firms, and EV-charger providers to bundle services. Ubicquia collaborates with Acuity Brands on cellular photocontrols, while Clear Blue Technologies expands solar-hybrid deployments across Canadian provinces. Havells Lighting launched U.S. operations via a joint venture that includes a vertically integrated plant in South Carolina, signaling renewed competition from international entrants. With connected-ready platforms converging on common standards, differentiation increasingly hinges on integration services and cybersecurity assurances rather than core fixture performance.
North America Outdoor Lighting Industry Leaders
-
Signify N.V.
-
Acuity Brands Lighting Inc.
-
Eaton Intelligent Lighting (Cooper)
-
Cree LED Lighting
-
OSRAM GmbH
- *Disclaimer: Major Players sorted in no particular order
Market Opportunities and Future Outlook
White space is expanding where outdoor luminaires are procured as multi-function infrastructure rather than standalone lighting, especially in projects that combine roadway or area lighting with connectivity nodes, cameras, and EV charging-site requirements. The U.S. Access Board guidance on illumination for EV charging stations, along with field adoption of integrated control standards (including D4i in photocontrol-enabled roadway products), is pushing site owners to specify canopy and parking-area lighting that is controllable, monitorable, and compliant. This supports suppliers that bundle luminaires with network lighting controls and commissioning services.
A second opportunity cluster is tied to dark-sky compliance and product differentiation, where municipalities and suburban communities are tightening ordinances and seeking warmer-CCT, low-blue, well-shielded optics alongside adaptive dimming. Product and portfolio decisions by major vendors reinforce this direction: Acuity Brands has emphasized capital allocation toward Intelligent Spaces, which it reported as growing 14.9% in Q3 fiscal 2026, supporting further integration of controls, sensing, and software into outdoor deployments. Signify has also highlighted operating leverage focus within its North American Cooper Lighting Solutions business, alongside medium-term free-cash-flow objectives of 7% to 8% of sales, encouraging portfolio rationalization and higher-value professional offerings aligned to connected and specification-grade outdoor projects.
Recent Industry Developments
- June 2026: Signify announced an initiative to move multiple professional outdoor specification luminaire ranges (including road, solar, tunnel, and floodlighting categories) under the Signify brand as part of a broader portfolio strengthening effort. The move supports clearer product architecture and channel messaging for specification sales, while improving consistency for contractors and public-sector buyers managing multi-site standardization.
- May 2025: Acuity Brands acquired M3 Innovation, LLC, a sports lighting startup, to bring its technology into Acuity Brands Lighting offerings. Folding specialized sports-lighting capabilities into established brands supports higher-performance outdoor venue projects where controllability, uniformity, and upgrade paths are central to bid outcomes.
- July 2024: Acuity Brands introduced the Cell Connect solution for outdoor lighting, developed with Ubicquia, integrating D4i-certified photocontrols into American Electric Lighting AutoConnect roadway luminaires. Integrated connectivity at the luminaire level simplifies smart-infrastructure deployments for utilities and municipalities by reducing add-on components and accelerating remote monitoring and control readiness.
Research Methodology Framework and Report Scope
Market Definition and Coverage
This market covers revenue earned from outdoor lighting products and systems used to illuminate exterior areas across North America, including fixtures, luminaires, and control-ready solutions used in residential, commercial, and public outdoor spaces.
Scope exclusions: We exclude indoor lighting products, automotive lighting, and decorative items that are sold mainly as non-lighting accessories.
Segmentation Overview
- By Type of Application
- Residential Outdoor
- Commercial Outdoor
- Retail and Hospitality
- Offices and Business Parks
- Industrial and Logistics
- Parking Spaces
- Public and Street Lighting
- Sports and Large Area Lighting
- Other Type of Applications (Architectural and Landscape, Events, Galleries)
- By Type of Lighting
- Traditional
- LED
- By Installation Mode
- Conventional Stand-alone
- Connected / Smart
- By Country
- United States
- Canada
- Mexico
Data Sources, Market Sizing, and Validation
Desk Research
Desk research was used to map the addressable demand pool and the rules that shape what gets installed outdoors. We relied on public sources such as the U.S. Energy Information Administration (electricity prices and consumption context), the U.S. Census Bureau (construction and housing indicators), Statistics Canada (construction and infrastructure context), and trade and tariff data published by the U.S. International Trade Commission and U.S. Customs channels to sense supply flows for lighting-related products.
To connect demand with realistic pricing, we also reviewed manufacturer and distributor public materials, product catalogs, and investor disclosures, along with codes and efficiency programs that affect outdoor lighting upgrades. Where specific company-level financial splits were needed, we used paid subscriptions focused on company financials and intelligence, news and financials, patent databases, and shipment-level import export datasets to cross-check directional trends. The sources listed here are illustrative only, and we used additional public and paid references for data capture, clarification, and validation.
Primary Interviews and Surveys
We consult manufacturers, distributors, contractors, utility program staff, municipal buyers, and design professionals across North America. Interviews and surveys test replacement timing, LED and connected-control adoption, channel markups, project backlogs, and ASP movement. These checks validate secondary inputs, fill gaps, and triangulate assumptions before final analysis.
Distribution of primary research fieldwork respondents
| Company type | Respondent position |
|---|---|
| Top tier: 30% | CXOs: 20% |
| Mid tier: 45% | Functional/Unit leaders: 30% |
| Smaller Players: 25% | Managers: 50% |
Market-Sizing & Forecasting
Sizing starts from a top-down build where construction activity, public lighting upgrade pipelines, and outdoor retrofit intensity are translated into an addressable demand pool by country, then converted to value using realistic price ranges by product and application. To keep results grounded, we also checked selective bottom-up approximations, such as sampled average selling price multiplied by shipped or installed volumes from channel checks, along with supplier roll-ups for a short list of widely used outdoor categories.
Key inputs tracked in the model include the share of LED in outdoor installs, the replacement cycle for street and area lighting, the portion of projects that include controls or connected features, country-level construction and infrastructure spending indicators, and electricity price signals that influence payback periods for retrofit decisions. When data gaps appeared, especially for smaller project types and fragmented distribution, we used ranges validated through interviews and applied conservative penetration logic before totals were finalized.
Forecasting uses scenario analysis with a base case shaped by expert expectations on municipal retrofit timing, nonresidential construction momentum, and pricing movement for LEDs and drivers. Growth rates were adjusted by country after cross-checking leading indicators, then blended back into a regional outlook to keep the trajectory aligned with observable adoption patterns and procurement cycles.
Data Validation & Update Cycle
Outputs are validated through multiple passes that compare the model against independent signals, such as construction indicators, trade flow direction, and observed pricing bands from the channel. Large variances trigger a re-check of assumptions first, followed by selective re-contact with respondents when variance cannot be explained by timing, mix, or currency effects.
Before sign-off, the work is reviewed step-by-step by another analyst to confirm the math flow, the reasonableness of each driver, and the consistency of country totals with the regional sum. Reports are refreshed annually, with interim updates made when material events can shift demand or pricing, followed by a final pre-delivery check so clients receive the most current view.
Mordor Intelligence's Northamerica Outdoor Lighting Market Estimate Compared With Other Published Estimates
Published market sizes for North America outdoor lighting can differ by a wide margin because studies do not always use the same product boundary, pricing point, or revenue level. Some sources focus only on fixtures, while others include controls, services, or adjacent electrical categories, which changes the value even when the installed base is similar.
Key gaps usually come from what gets counted as outdoor lighting revenue and how pricing is handled across retrofit-heavy years. By tracking price bands, LED share shifts, and connected feature attachment rates, Mordor Intelligence keeps the estimate tied to outdoor lighting system value instead of mixing in broader electrical spend or applying a single flat price assumption across countries.
Benchmark comparison
| Source | Market Size | Gaps in Research Methodology |
|---|---|---|
| Mordor Intelligence | USD 5.93 B (2025) | |
| Industry Study A | USD 5.50 B (2024) | Often measured as United States outdoor lighting fixture demand at the manufacturer level, which can exclude control-ready systems and may not represent full North America revenue coverage. |
| Industry Digest B | USD 18.70 B (2022) | May use a broader definition of outdoor lighting that can blend fixtures with adjacent lighting and electrical categories, and the value can be influenced by differing channel markups and revenue recognition points. |
The spread across the table is mainly explained by boundary and revenue-level choices, followed by how pricing and geography are handled. When scope is kept consistent across the same countries and linked to observable adoption drivers, the resulting market size becomes easier to reproduce and to update as project timing and mix shift year to year.
Key Questions Answered in the Report
What is the current value of the North America outdoor lighting market?
The market was valued at USD 6.28 billion in 2026 and is projected to reach USD 8.36 billion by 2031.
Which country leads regional demand for outdoor lighting solutions?
The United States holds 45.35% of regional revenue and is expanding at 7.78% CAGR.
Which application segment is growing fastest?
Commercial outdoor lighting, driven by retail and hospitality upgrades, is rising at 7.32% CAGR through 2031.
How much energy can municipalities save by switching to LEDs?
Full LED conversion of U.S. streetlights could save 20,200 GWh annually and reduce municipal costs by USD 1 billion.