| Study Period | 2018 - 2030 |
| Base Year For Estimation | 2024 |
| Forecast Data Period | 2025 - 2030 |
| Market Size (2025) | USD 5.91 Billion |
| Market Size (2030) | USD 7.52 Billion |
| CAGR (2025 - 2030) | 4.91 % |
| Market Concentration | High |
Major Players*Disclaimer: Major Players sorted in no particular order |

North America Ready to Drink Coffee Market Analysis
The North America Ready to Drink Coffee Market size is estimated at 5.91 billion USD in 2025, and is expected to reach 7.52 billion USD by 2030, growing at a CAGR of 4.91% during the forecast period (2025-2030).
The North American ready-to-drink (RTD) coffee market is experiencing significant transformation driven by changing consumer demographics and preferences. Generation Z has emerged as a crucial consumer segment, with this demographic representing 20.88% of the US population, 22% of Canadians, and 27% of Mexicans as of 2022. This demographic shift has prompted manufacturers to innovate their product offerings, focusing on convenience and portability. The industry has witnessed a notable evolution in consumer behavior, with approximately 65% of consumers in 2022 reporting RTD coffee consumption during their daily commute, highlighting the growing importance of on-the-go beverage options.
Health consciousness and wellness trends are reshaping the RTD coffee landscape, with manufacturers responding to evolving consumer preferences. In 2023, approximately 35% of North American consumers expressed a preference for low-sugar RTD coffee options, driving manufacturers to reformulate their products. This health-oriented shift has led to the introduction of functional ingredients that not only provide caffeine benefits but also offer additional health properties. Major brands are increasingly incorporating proteins, collagen, electrolytes, and adaptogens into their RTD coffee recipes, creating a new category of functional beverages that cater to health-conscious consumers.
Digital transformation and social media influence are playing pivotal roles in shaping consumer engagement and product discovery. Approximately 70% of Mexican consumers utilize social media platforms to research and learn about new products, demonstrating the growing importance of digital marketing channels. Major brands are leveraging these platforms for product launches and consumer engagement, with companies like Nescafe Mexico utilizing Facebook for educational content about RTD coffee benefits, while others implement interactive social media campaigns to build brand loyalty and drive consumer awareness.
The market is witnessing significant urbanization trends and lifestyle changes that are driving consumption patterns. Mexico's urbanization rate reached 82.6% in 2023, substantially higher than the global average of 56.6%, indicating a growing urban consumer base seeking convenient beverage options. The United States maintains its position as a major coffee market, consuming approximately 1.4 billion pounds of coffee, representing roughly 20% of global consumption. This substantial consumption base has attracted significant investment in product innovation, with major brands like Starbucks, Dunkin', Califia Farms, and La Colombe launching new RTD coffee variants throughout 2022-2023 to meet diverse consumer preferences and capitalize on the growing demand for premium and innovative coffee beverages.
North America Ready to Drink Coffee Market Trends
Consumers are increasingly seeking convenient and portable beverage options to fit their busy lifestyles, thereby driving segment sales
- RTD coffee consumption is particularly high the age group of 18 to 39-year consumers. It was observed that in 2022, an average of american worker has a tendency to spent over USD 14.15 per week.
- n the North American region, Gen Z and Millennial consumers professed the highest brand loyalty among other age groups. 73% of United States consumers consider themselves “loyal” to certain retailers, brands, and stores.
- Inflation has affected every aspect of coffee businesses, including green coffee prices and transportation costs. Pandemic-related supply chain challenges have contributed to inflation and increased wholesale coffee prices. However, the market stood steady with players maintaining the prices to an economical level.
- In the US, there is a wide variety of RTD coffee available, ranging from commercial brands to artisan and gourmet options, allowing consumers to choose from a variety of flavors. It is important to note that RTD coffee has a significant place in the United States market, particularly as a substitute for hot coffee.
Understand The Key Trends Shaping This Market
Download PDF
OTHER KEY INDUSTRY TRENDS COVERED IN THE REPORT
- Packaging innovation is a driving factor aimed at reducing environmental impact and improving the sustainability of the coffee supply chain
- Brands are focusing on sourcing high-quality coffee beans combined with maintaining consistency by employing rigorous standards and practices
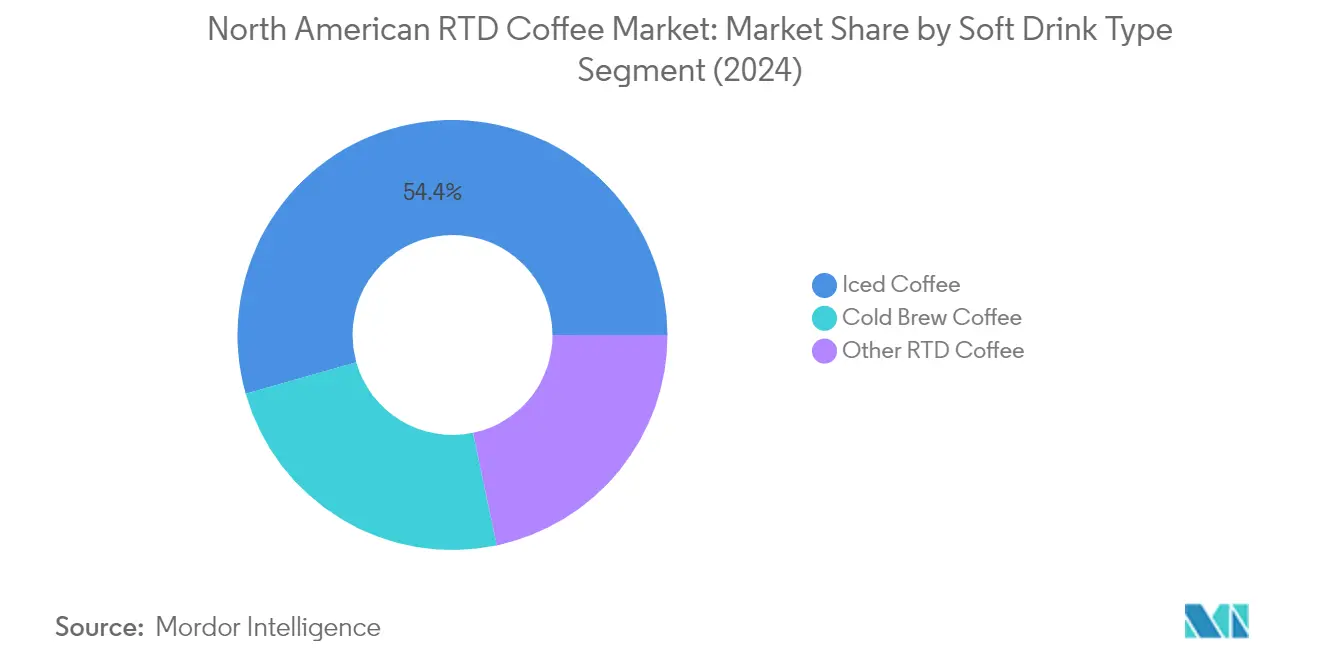
Segment Analysis: Soft Drink Type
Iced Coffee Segment in North American RTD Coffee Market
Iced coffee maintains its dominant position in the North American RTD coffee market, commanding approximately 54% of the total market share in 2024. This substantial market presence can be attributed to its widespread appeal across diverse consumer demographics, particularly among younger consumers, with nearly 30% of Gen Z exhibiting a strong preference for iced coffee variants. The segment's success is further bolstered by the extensive availability of various flavors and formulations, ranging from classic options to premium and specialty offerings that cater to evolving consumer preferences. Major players in the market frequently introduce innovative flavors and seasonal offerings to maintain market dynamism and consumer engagement. The segment's growth is also supported by the increasing consumer willingness to pay premium prices for high-quality, artisanal iced coffee options that offer unique coffee experiences.
Cold Brew Coffee Segment in North American RTD Coffee Market
Cold brew coffee emerges as the fastest-growing segment in the North American RTD coffee market, projected to experience robust growth of approximately 6% during 2024-2029. This remarkable growth trajectory is driven by several factors, including the rising popularity of cold brew coffee among on-the-go consumers like commuters and students. The segment's appeal lies in its unique brewing process, which results in a naturally sweeter taste profile without added sugars. Manufacturers are actively responding to growing health consciousness by introducing low-sugar, dairy-free, and plant-based cold brew variants. The segment's innovation extends to premium offerings that provide sophisticated coffee experiences, with some brands enhancing texture through nitrogen-infused cans for a creamy and frothy experience. The cold brew segment's growth is further supported by its versatility in packaging options, including glass bottles, PET bottles, and metal cans.
Remaining Segments in Soft Drink Type
The other RTD coffee segment encompasses a diverse range of coffee beverages, including cappuccinos, espressos, café mochas, and various flavored and dairy-free variants. This segment plays a crucial role in market diversification by offering unique coffee experiences through innovative formulations and flavor combinations. The segment's offerings often include premium products with sophisticated flavor profiles and functional ingredients, catering to specific consumer preferences and dietary requirements. Many manufacturers in this segment focus on developing products with added health benefits, including protein-enriched varieties and sugar-free options, contributing to the overall market's depth and variety.
Segment Analysis: Packaging Type
Glass Bottles Segment in North American RTD Coffee Market
Glass bottles dominate the North American ready-to-drink coffee packaging market, commanding approximately 42% market share in 2024. This significant market position can be attributed to glass packaging's superior ability to preserve coffee flavor and freshness through its impermeability to oxygen. Glass bottles are particularly favored for premium RTD coffee products as they create an upscale image and maintain product integrity. The material's transparency allows consumers to visually assess the coffee's quality before purchase, while its ability to withstand high temperatures makes it ideal for various RTD coffee processing methods, including pasteurization and hot filling. Many glass bottles feature resealable caps, enhancing convenience for on-the-go consumption, while their infinite recyclability appeals to environmentally conscious consumers.
Aseptic Packaging Segment in North American RTD Coffee Market
The aseptic packaging segment is experiencing robust growth in the North American RTD coffee market, projected to grow at approximately 5% CAGR from 2024 to 2029. This growth is driven by several key advantages, including the ability to preserve coffee quality without refrigeration and the elimination of preservatives, aligning with the growing consumer demand for clean labels. Aseptic packaging's sterilization process ensures product safety while maintaining flavor integrity, making it increasingly popular among manufacturers. The lightweight nature of aseptic packages contributes to reduced transportation costs and environmental impact, while their space-efficient design optimizes storage and distribution. The segment's growth is further supported by consumer appreciation for its environmental attributes, with a significant portion of buyers valuing recyclability and compostability features.
Remaining Segments in RTD Coffee Packaging Market
Metal cans and PET bottles complete the packaging landscape in the North American RTD coffee market, each offering unique benefits to manufacturers and consumers. Metal cans excel in rapid cooling capabilities and provide superior protection against light and external factors, making them particularly suitable for cold brew and nitro coffee variants. Their tamper-evident seals ensure product safety and integrity. PET bottles, meanwhile, offer cost advantages and lightweight properties, making them ideal for on-the-go consumption. Both packaging types support various customization options for branding and design, while their recyclability aligns with growing sustainability trends in the beverage industry.
Segment Analysis: Distribution Channel
Supermarket/Hypermarket Segment in North American RTD Coffee Market
Supermarkets and hypermarkets continue to dominate the North American ready-to-drink coffee market, commanding approximately 47% share of the off-trade distribution channel in 2024. These retail giants leverage their extensive shelf space and strategic product placement to showcase a comprehensive range of RTD coffee products. The segment's dominance is attributed to several factors, including the ability to offer competitive pricing through bulk purchasing, convenient one-stop shopping experiences, and the implementation of effective loyalty programs. Major retail chains like Walmart, Kroger, and Target have strengthened their position by offering both national and private label RTD coffee brands, while also providing consumers with multiple options in terms of packaging sizes, flavors, and price points. The success of this channel is further enhanced by their ability to maintain consistent product availability and implement sophisticated inventory management systems.
On-Trade Segment in North American RTD Coffee Market
The on-trade segment is emerging as the most dynamic channel in the North American RTD coffee market, projected to grow at approximately 6% CAGR from 2024 to 2029. This growth is primarily driven by the increasing trend of out-of-home consumption and the rising popularity of specialty coffee establishments. On-trade retailers are actively diversifying their RTD coffee offerings, focusing on innovative flavors and eye-catching packaging to maintain their competitive edge. The segment's growth is further supported by strategic partnerships between prominent RTD coffee brands and foodservice establishments, enabling wider distribution and enhanced consumer reach. The customization options offered by on-trade channels, allowing customers to personalize their beverages by choosing specific ingredients and packaging types, have become a key differentiator in the market.
Remaining Segments in Distribution Channel
The North American RTD coffee market is further segmented into convenience stores, online retail, specialty stores, and other off-trade channels. Convenience stores serve as crucial points of sale for on-the-go consumption, particularly in urban areas and along transportation routes. The online retail channel has gained significant traction, driven by the increasing adoption of e-commerce platforms and the convenience of doorstep delivery. Specialty stores have carved out a niche by focusing on premium and artisanal RTD coffee products, catering to discerning consumers seeking unique coffee experiences. The remaining off-trade channels, including vending machines and drug stores, continue to play a supplementary role in the market by providing additional accessibility points for consumers.
North America Ready to Drink Coffee Market Geography Segment Analysis
Ready to Drink Coffee Market in the United States
The United States dominates the North American ready-to-drink coffee market, commanding approximately 97% of the total market value in 2024. The market's robust performance can be attributed to the strong presence of major coffee chains and innovative product launches. Young consumers, particularly Gen Z and millennials, exhibit a marked preference for ready-to-drink coffee options, with cold brew and iced variants being particularly popular. The U.S. RTD coffee market is witnessing a significant shift toward healthier and premium offerings, with consumers increasingly seeking products crafted with natural ingredients while avoiding artificial flavors and sweeteners. This preference for quality is evident as consumers demonstrate a willingness to pay premium prices for products featuring unique flavors and high-quality ingredients. The market is further strengthened by diverse distribution channels, including supermarkets, convenience stores, and online platforms, ensuring widespread product accessibility. Additionally, the trend toward customization in RTD coffee products allows customers to tailor their beverages by choosing specific ingredients and packaging types, further driving market growth.
Ready to Drink Coffee Market in Mexico
Mexico stands out as the most dynamic market in the North American region, projected to grow at approximately 6% CAGR from 2024 to 2029. The country's RTD coffee market is experiencing significant transformation driven by changing consumer preferences and lifestyle patterns. Social media plays a crucial role in shaping consumer behavior, with a majority of Mexican consumers utilizing these platforms to discover and learn about new products. The market is witnessing a notable surge in cold brew coffee consumption, particularly among urban consumers who appreciate its smooth taste profile and perceived health benefits. The growing workforce population has significantly contributed to market expansion, as RTD coffee serves as a convenient beverage option for busy professionals. The market is also benefiting from the increasing presence of international brands and local players who are introducing innovative flavors and formats. Furthermore, the rising café culture in urban areas has helped familiarize consumers with various coffee beverages, creating a spillover effect on RTD coffee consumption.
Ready to Drink Coffee Market in Canada
Canada's RTD coffee market demonstrates strong potential, driven by increasing consumer awareness and evolving preferences for convenient beverage options. The market is characterized by a growing emphasis on sustainable packaging and environmentally conscious production methods, reflecting Canadian consumers' strong environmental awareness. Premium and specialty RTD coffee products have gained significant traction, particularly in urban centers where consumers seek high-quality, artisanal offerings. The market has witnessed a notable shift toward plant-based and dairy-free alternatives, catering to the growing vegetarian and vegan consumer base. Canadian retailers are increasingly dedicating more shelf space to RTD coffee products, offering a diverse range of flavors and formats to meet varying consumer preferences. The country's robust cold chain infrastructure and well-established distribution networks have facilitated market expansion, ensuring product freshness and availability. Additionally, the market benefits from innovative product launches that cater to seasonal preferences, with specialized offerings for both summer and winter consumption patterns.
Ready to Drink Coffee Market in Other Countries
The RTD coffee market in other North American countries, including Cuba, Greenland, Jamaica, Costa Rica, Panama, and Guatemala, exhibits unique characteristics shaped by local preferences and consumption patterns. These markets are witnessing growing interest in RTD coffee products, particularly among urban consumers seeking convenient beverage options. The retail landscape in these countries is evolving, with supermarkets and convenience stores expanding their RTD coffee offerings to meet increasing demand. Local taste preferences play a crucial role in product development, with manufacturers introducing flavors that resonate with regional palates. The tourism industry in these countries has also influenced RTD coffee consumption, exposing local consumers to international brands and varieties. The market is characterized by a mix of international brands and local players, creating a diverse product landscape. Additionally, the growing café culture in these regions has helped familiarize consumers with various coffee beverages, creating opportunities for RTD coffee products.
Get Analysis on Important Geographic Markets
Download PDF
North America Ready to Drink Coffee Industry Overview
Top Companies in North America Ready to Drink Coffee Market
The North American ready-to-drink coffee market is characterized by continuous product innovation and strategic expansion initiatives by major players. Companies are focusing on developing unique flavor profiles, incorporating functional ingredients like protein and collagen, and introducing plant-based alternatives to meet evolving consumer preferences. Operational agility is demonstrated through rapid responses to market trends, with companies frequently launching seasonal and limited-edition variants while optimizing their distribution networks. Strategic moves include partnerships between beverage giants and coffee chains, allowing for enhanced market penetration and brand leverage. Companies are also expanding their production capabilities through facility investments and adopting sustainable practices in packaging and sourcing, reflecting a commitment to environmental stewardship and quality assurance.
Consolidated Market Led By Global Players
The North American RTD coffee market exhibits a highly consolidated structure dominated by global beverage conglomerates and specialized coffee companies. These major players leverage their extensive distribution networks, established brand equity, and significant research and development capabilities to maintain their market positions. The presence of both multinational corporations and specialized coffee brands creates a dynamic competitive environment, where large companies benefit from economies of scale while specialty players capitalize on their coffee expertise and craft positioning.
The market has witnessed significant merger and acquisition activity, particularly involving large beverage companies acquiring smaller, innovative RTD coffee brands to expand their portfolios and capture emerging market segments. This consolidation trend reflects the industry's maturation and the strategic importance of building comprehensive product offerings. Companies are also forming strategic alliances with coffee chains and foodservice operators to enhance their market presence and distribution capabilities, while simultaneously investing in direct-to-consumer channels to maintain a competitive advantage.
Innovation and Sustainability Drive Future Success
Success in the RTD coffee market increasingly depends on companies' ability to innovate while maintaining sustainable practices. Incumbents must focus on developing premium products with functional benefits, investing in sustainable packaging solutions, and strengthening their distribution networks to maintain market share. The ability to quickly respond to changing consumer preferences, particularly among younger demographics, while maintaining product quality and brand authenticity, will be crucial for market leaders to defend their positions.
For contenders looking to gain ground, differentiation through unique product offerings, targeted marketing strategies, and strategic partnerships will be essential. Companies must navigate potential regulatory changes regarding packaging sustainability and ingredient transparency, while addressing the growing demand for healthier beverage options. The market's future will be shaped by companies' ability to balance premium positioning with accessibility, while maintaining strong relationships with retailers and adapting to evolving distribution channels, particularly in the e-commerce space.
North America Ready to Drink Coffee Market Leaders
-
Califia Farms, LLC
-
Danone S.A.
-
Keurig Dr Pepper, Inc.
-
PepsiCo, Inc.
-
The Coca-Cola Company
- *Disclaimer: Major Players sorted in no particular order

Need More Details on Market Players and Competitors?
Download PDF
North America Ready to Drink Coffee Market News
- July 2023: Keurig Dr. Pepper Inc. announced a strategic partnership with La Colombe, including a long-term sales and distribution agreement for La Colombe's ready-to-drink coffee. Keurig Dr Pepper will also make an equity investment in La Colombe, enabling KDP to participate in the value creation upside expected from the partnership.
- April 2023: Chamberlain Coffee, in collaboration with Walmart, rolled out a new line of plant-based cold brew lattes, ready to drink (RTD) and conveniently available at Walmart stores.
- February 2023: Danone North America planned to invest up to USD 65 million over the next two years to increase ready-to-drink (RTD) coffee and creamer and oat milk production in the US. The investment will cover several of Danone's coffee brands, including coffee creamer International Delight, oat milk brand Silk, and cold brew range SToK.
Free With This Report
We provide a comprehensive and exhaustive set of data pointers for global, regional, and country-level metrics that illustrate the fundamentals of the soft drinks industry. With the help of 45+ free charts, clients can access in-depth market analysis based on price trend analysis of per capita spending on various soft drinks, through granular-level segmental information supported by a repository of market data, trends, and expert analysis. Data and analysis on soft drink category, packaging type, distribution channel insights into consumer preferences and purchasing patterns, an overview of key market players, etc., are available in the form of comprehensive reports as well as excel-based data worksheets.


North America Ready to Drink Coffee Market Report - Table of Contents
1. EXECUTIVE SUMMARY & KEY FINDINGS
2. REPORT OFFERS
3. INTRODUCTION
- 3.1 Study Assumptions & Market Definition
- 3.2 Scope of the Study
- 3.3 Research Methodology
4. KEY INDUSTRY TRENDS
- 4.1 Consumer Buying Behaviour
- 4.2 Innovations
- 4.3 Brand Share Analysis
- 4.4 Regulatory Framework
5. MARKET SEGMENTATION (includes market size in Value in USD and Volume, Forecasts up to 2030 and analysis of growth prospects)
-
5.1 Soft Drink Type
- 5.1.1 Cold Brew Coffee
- 5.1.2 Iced coffee
- 5.1.3 Other RTD Coffee
-
5.2 Packaging Type
- 5.2.1 Aseptic packages
- 5.2.2 Glass Bottles
- 5.2.3 Metal Can
- 5.2.4 PET Bottles
-
5.3 Distribution Channel
- 5.3.1 Off-trade
- 5.3.1.1 Convenience Stores
- 5.3.1.2 Online Retail
- 5.3.1.3 Specialty Stores
- 5.3.1.4 Supermarket/Hypermarket
- 5.3.1.5 Others
- 5.3.2 On-trade
-
5.4 Country
- 5.4.1 Canada
- 5.4.2 Mexico
- 5.4.3 United States
- 5.4.4 Rest of North America
6. COMPETITIVE LANDSCAPE
- 6.1 Key Strategic Moves
- 6.2 Market Share Analysis
- 6.3 Company Landscape
-
6.4 Company Profiles
- 6.4.1 BRC Inc.
- 6.4.2 Califia Farms, LLC
- 6.4.3 Chamberlain Coffee Inc.
- 6.4.4 Costco Wholesale Corporation
- 6.4.5 Danone S.A.
- 6.4.6 Keurig Dr Pepper, Inc.
- 6.4.7 La Colombe Holdings, Inc.
- 6.4.8 Luigi Lavazza S.p.A.
- 6.4.9 Nestle S.A.
- 6.4.10 PepsiCo, Inc.
- 6.4.11 The Central America Bottling Corporation
- 6.4.12 The Coca-Cola Company
- *List Not Exhaustive
7. KEY STRATEGIC QUESTIONS FOR SOFT DRINK CEOS
8. APPENDIX
-
8.1 Global Overview
- 8.1.1 Overview
- 8.1.2 Porter’s Five Forces Framework
- 8.1.3 Market Dynamics (DROs)
- 8.2 Sources & References
- 8.3 List of Tables & Figures
- 8.4 Primary Insights
- 8.5 Data Pack
- 8.6 Glossary of Terms
You Can Purchase Parts Of This Report. Check Out Prices For Specific Sections
Get Price Break-up Now
List of Tables & Figures
- Figure 1:
- CONSUMER BUYING BEHAVIOUR
- Figure 2:
- INNOVATIONS
- Figure 3:
- VOLUME OF READY TO DRINK COFFEE MARKET, LITRES, NORTH AMERICA, 2018 - 2030
- Figure 4:
- VALUE OF READY TO DRINK COFFEE MARKET, USD, NORTH AMERICA, 2018 - 2030
- Figure 5:
- VOLUME OF READY TO DRINK COFFEE MARKET BY SOFT DRINK TYPE, LITRES, NORTH AMERICA, 2018 - 2030
- Figure 6:
- VALUE OF READY TO DRINK COFFEE MARKET BY SOFT DRINK TYPE, USD, NORTH AMERICA, 2018 - 2030
- Figure 7:
- VALUE SHARE OF READY TO DRINK COFFEE MARKET SPLIT BY SOFT DRINK TYPE, %, NORTH AMERICA, 2018 VS 2024 VS 2030
- Figure 8:
- VOLUME SHARE OF READY TO DRINK COFFEE MARKET SPLIT BY SOFT DRINK TYPE, %, NORTH AMERICA, 2018 VS 2024 VS 2030
- Figure 9:
- VOLUME OF COLD BREW COFFEE MARKET, LITRES, NORTH AMERICA, 2018 - 2030
- Figure 10:
- VALUE OF COLD BREW COFFEE MARKET, USD, NORTH AMERICA, 2018 - 2030
- Figure 11:
- VALUE SHARE OF COLD BREW COFFEE MARKET SPLIT BY PACKAGING TYPE, %, NORTH AMERICA, 2023 VS 2030
- Figure 12:
- VOLUME OF ICED COFFEE MARKET, LITRES, NORTH AMERICA, 2018 - 2030
- Figure 13:
- VALUE OF ICED COFFEE MARKET, USD, NORTH AMERICA, 2018 - 2030
- Figure 14:
- VALUE SHARE OF ICED COFFEE MARKET SPLIT BY PACKAGING TYPE, %, NORTH AMERICA, 2023 VS 2030
- Figure 15:
- VOLUME OF OTHER RTD COFFEE MARKET, LITRES, NORTH AMERICA, 2018 - 2030
- Figure 16:
- VALUE OF OTHER RTD COFFEE MARKET, USD, NORTH AMERICA, 2018 - 2030
- Figure 17:
- VALUE SHARE OF OTHER RTD COFFEE MARKET SPLIT BY PACKAGING TYPE, %, NORTH AMERICA, 2023 VS 2030
- Figure 18:
- VOLUME OF READY TO DRINK COFFEE MARKET BY PACKAGING TYPE, LITRES, NORTH AMERICA, 2018 - 2030
- Figure 19:
- VALUE OF READY TO DRINK COFFEE MARKET BY PACKAGING TYPE, USD, NORTH AMERICA, 2018 - 2030
- Figure 20:
- VALUE SHARE OF READY TO DRINK COFFEE MARKET SPLIT BY PACKAGING TYPE, %, NORTH AMERICA, 2018 VS 2024 VS 2030
- Figure 21:
- VOLUME SHARE OF READY TO DRINK COFFEE MARKET SPLIT BY PACKAGING TYPE, %, NORTH AMERICA, 2018 VS 2024 VS 2030
- Figure 22:
- VOLUME OF READY TO DRINK COFFEE MARKET SOLD VIA ASEPTIC PACKAGES, LITRES, NORTH AMERICA, 2018 - 2030
- Figure 23:
- VALUE OF READY TO DRINK COFFEE MARKET SOLD VIA ASEPTIC PACKAGES, USD, NORTH AMERICA, 2018 - 2030
- Figure 24:
- VALUE SHARE OF READY TO DRINK COFFEE MARKET SOLD VIA ASEPTIC PACKAGES, SPLIT BY SOFT DRINK TYPE %, NORTH AMERICA, 2023 VS 2030
- Figure 25:
- VOLUME OF READY TO DRINK COFFEE MARKET SOLD VIA GLASS BOTTLES, LITRES, NORTH AMERICA, 2018 - 2030
- Figure 26:
- VALUE OF READY TO DRINK COFFEE MARKET SOLD VIA GLASS BOTTLES, USD, NORTH AMERICA, 2018 - 2030
- Figure 27:
- VALUE SHARE OF READY TO DRINK COFFEE MARKET SOLD VIA GLASS BOTTLES, SPLIT BY SOFT DRINK TYPE %, NORTH AMERICA, 2023 VS 2030
- Figure 28:
- VOLUME OF READY TO DRINK COFFEE MARKET SOLD VIA METAL CAN, LITRES, NORTH AMERICA, 2018 - 2030
- Figure 29:
- VALUE OF READY TO DRINK COFFEE MARKET SOLD VIA METAL CAN, USD, NORTH AMERICA, 2018 - 2030
- Figure 30:
- VALUE SHARE OF READY TO DRINK COFFEE MARKET SOLD VIA METAL CAN, SPLIT BY SOFT DRINK TYPE %, NORTH AMERICA, 2023 VS 2030
- Figure 31:
- VOLUME OF READY TO DRINK COFFEE MARKET SOLD VIA PET BOTTLES, LITRES, NORTH AMERICA, 2018 - 2030
- Figure 32:
- VALUE OF READY TO DRINK COFFEE MARKET SOLD VIA PET BOTTLES, USD, NORTH AMERICA, 2018 - 2030
- Figure 33:
- VALUE SHARE OF READY TO DRINK COFFEE MARKET SOLD VIA PET BOTTLES, SPLIT BY SOFT DRINK TYPE %, NORTH AMERICA, 2023 VS 2030
- Figure 34:
- VOLUME OF READY TO DRINK COFFEE MARKET BY DISTRIBUTION CHANNEL, LITRES, NORTH AMERICA, 2018 - 2030
- Figure 35:
- VALUE OF READY TO DRINK COFFEE MARKET BY DISTRIBUTION CHANNEL, USD, NORTH AMERICA, 2018 - 2030
- Figure 36:
- VALUE SHARE OF READY TO DRINK COFFEE MARKET SPLIT BY DISTRIBUTION CHANNEL, %, NORTH AMERICA, 2018 VS 2024 VS 2030
- Figure 37:
- VOLUME SHARE OF READY TO DRINK COFFEE MARKET SPLIT BY DISTRIBUTION CHANNEL, %, NORTH AMERICA, 2018 VS 2024 VS 2030
- Figure 38:
- VOLUME OF READY TO DRINK COFFEE MARKET SOLD VIA OFF-TRADE CHANNELS, LITRES, NORTH AMERICA, 2018 - 2030
- Figure 39:
- VALUE OF READY TO DRINK COFFEE MARKET SOLD VIA OFF-TRADE CHANNELS, USD, NORTH AMERICA, 2018 - 2030
- Figure 40:
- VALUE SHARE OF READY TO DRINK COFFEE MARKET SOLD VIA OFF-TRADE CHANNELS, %, NORTH AMERICA, 2018 VS 2024 VS 2030
- Figure 41:
- VOLUME SHARE OF READY TO DRINK COFFEE MARKET SOLD VIA OFF-TRADE CHANNELS, %, NORTH AMERICA, 2018 VS 2024 VS 2030
- Figure 42:
- VOLUME OF READY TO DRINK COFFEE MARKET SOLD VIA CONVENIENCE STORES, LITRES, NORTH AMERICA, 2018 - 2030
- Figure 43:
- VALUE OF READY TO DRINK COFFEE MARKET SOLD VIA CONVENIENCE STORES, USD, NORTH AMERICA, 2018 - 2030
- Figure 44:
- VALUE SHARE OF READY TO DRINK COFFEE MARKET SOLD VIA CONVENIENCE STORES SPLIT BY SOFT DRINK TYPE, %, NORTH AMERICA, 2023 VS 2030
- Figure 45:
- VOLUME OF READY TO DRINK COFFEE MARKET SOLD VIA ONLINE RETAIL, LITRES, NORTH AMERICA, 2018 - 2030
- Figure 46:
- VALUE OF READY TO DRINK COFFEE MARKET SOLD VIA ONLINE RETAIL, USD, NORTH AMERICA, 2018 - 2030
- Figure 47:
- VALUE SHARE OF READY TO DRINK COFFEE MARKET SOLD VIA ONLINE RETAIL SPLIT BY SOFT DRINK TYPE, %, NORTH AMERICA, 2023 VS 2030
- Figure 48:
- VOLUME OF READY TO DRINK COFFEE MARKET SOLD VIA SPECIALTY STORES, LITRES, NORTH AMERICA, 2018 - 2030
- Figure 49:
- VALUE OF READY TO DRINK COFFEE MARKET SOLD VIA SPECIALTY STORES, USD, NORTH AMERICA, 2018 - 2030
- Figure 50:
- VALUE SHARE OF READY TO DRINK COFFEE MARKET SOLD VIA SPECIALTY STORES SPLIT BY SOFT DRINK TYPE, %, NORTH AMERICA, 2023 VS 2030
- Figure 51:
- VOLUME OF READY TO DRINK COFFEE MARKET SOLD VIA SUPERMARKET/HYPERMARKET, LITRES, NORTH AMERICA, 2018 - 2030
- Figure 52:
- VALUE OF READY TO DRINK COFFEE MARKET SOLD VIA SUPERMARKET/HYPERMARKET, USD, NORTH AMERICA, 2018 - 2030
- Figure 53:
- VALUE SHARE OF READY TO DRINK COFFEE MARKET SOLD VIA SUPERMARKET/HYPERMARKET SPLIT BY SOFT DRINK TYPE, %, NORTH AMERICA, 2023 VS 2030
- Figure 54:
- VOLUME OF READY TO DRINK COFFEE MARKET SOLD VIA OTHER DISTRIBUTION CHANNEL, LITRES, NORTH AMERICA, 2018 - 2030
- Figure 55:
- VALUE OF READY TO DRINK COFFEE MARKET SOLD VIA OTHER DISTRIBUTION CHANNEL, USD, NORTH AMERICA, 2018 - 2030
- Figure 56:
- VALUE SHARE OF READY TO DRINK COFFEE MARKET SOLD VIA OTHERS SPLIT BY SOFT DRINK TYPE, %, NORTH AMERICA, 2023 VS 2030
- Figure 57:
- VOLUME OF READY TO DRINK COFFEE MARKET SOLD VIA ON-TRADE CHANNEL, LITRES, NORTH AMERICA, 2018 - 2030
- Figure 58:
- VALUE OF READY TO DRINK COFFEE MARKET SOLD VIA ON-TRADE CHANNEL, USD, NORTH AMERICA, 2018 - 2030
- Figure 59:
- VALUE SHARE OF READY TO DRINK COFFEE MARKET SOLD VIA ON-TRADE CHANNEL, SPLIT BY SOFT DRINK TYPE, %, NORTH AMERICA, 2023 VS 2030
- Figure 60:
- VOLUME OF READY TO DRINK COFFEE MARKET BY COUNTRY, LITRES, NORTH AMERICA, 2018 - 2030
- Figure 61:
- VALUE OF READY TO DRINK COFFEE MARKET BY COUNTRY, USD, NORTH AMERICA, 2018 - 2030
- Figure 62:
- VALUE SHARE OF READY TO DRINK COFFEE MARKET SPLIT BY COUNTRY, %, NORTH AMERICA, 2018 VS 2024 VS 2030
- Figure 63:
- VOLUME SHARE OF READY TO DRINK COFFEE MARKET SPLIT BY COUNTRY, %, NORTH AMERICA, 2018 VS 2024 VS 2030
- Figure 64:
- VOLUME OF RTD COFFEE MARKET, LITRES, CANADA, 2018 - 2030
- Figure 65:
- VALUE OF RTD COFFEE MARKET, USD, CANADA, 2018 - 2030
- Figure 66:
- VALUE SHARE OF READY TO DRINK COFFEE MARKET SPLIT BY SUB DISTRIBUTION CHANNEL, %, CANADA, 2023 VS 2030
- Figure 67:
- VOLUME OF RTD COFFEE MARKET, LITRES, MEXICO, 2018 - 2030
- Figure 68:
- VALUE OF RTD COFFEE MARKET, USD, MEXICO, 2018 - 2030
- Figure 69:
- VALUE SHARE OF READY TO DRINK COFFEE MARKET SPLIT BY SUB DISTRIBUTION CHANNEL, %, MEXICO, 2023 VS 2030
- Figure 70:
- VOLUME OF RTD COFFEE MARKET, LITRES, UNITED STATES, 2018 - 2030
- Figure 71:
- VALUE OF RTD COFFEE MARKET, USD, UNITED STATES, 2018 - 2030
- Figure 72:
- VALUE SHARE OF READY TO DRINK COFFEE MARKET SPLIT BY SUB DISTRIBUTION CHANNEL, %, UNITED STATES, 2023 VS 2030
- Figure 73:
- VOLUME OF RTD COFFEE MARKET, LITRES, REST OF NORTH AMERICA, 2018 - 2030
- Figure 74:
- VALUE OF RTD COFFEE MARKET, USD, REST OF NORTH AMERICA, 2018 - 2030
- Figure 75:
- VALUE SHARE OF READY TO DRINK COFFEE MARKET SPLIT BY SUB DISTRIBUTION CHANNEL, %, REST OF NORTH AMERICA, 2023 VS 2030
- Figure 76:
- MOST ACTIVE COMPANIES BY NUMBER OF STRATEGIC MOVES, COUNT, NORTH AMERICA, 2020 - 2023
- Figure 77:
- MOST ADOPTED STRATEGIES, COUNT, NORTH AMERICA, 2020 - 2023
- Figure 78:
- VALUE SHARE OF MAJOR PLAYERS, %, NORTH AMERICA
North America Ready to Drink Coffee Industry Segmentation
Cold Brew Coffee, Iced coffee are covered as segments by Soft Drink Type. Aseptic packages, Glass Bottles, Metal Can, PET Bottles are covered as segments by Packaging Type. Off-trade, On-trade are covered as segments by Distribution Channel. Canada, Mexico, United States are covered as segments by Country.| Soft Drink Type | Cold Brew Coffee | ||
| Iced coffee | |||
| Other RTD Coffee | |||
| Packaging Type | Aseptic packages | ||
| Glass Bottles | |||
| Metal Can | |||
| PET Bottles | |||
| Distribution Channel | Off-trade | Convenience Stores | |
| Online Retail | |||
| Specialty Stores | |||
| Supermarket/Hypermarket | |||
| Others | |||
| On-trade | |||
| Country | Canada | ||
| Mexico | |||
| United States | |||
| Rest of North America | |||
Need A Different Region or Segment?
Customize Now
Market Definition
- Carbonated Soft Drinks (CSDs) - Carbonated soft drinks (CSDs) refer to non-alcoholic beverages that are carbonated and typically flavored, containing dissolved carbon dioxide to create effervescence. These beverages commonly include cola, lemon-lime, orange, and various fruit-flavored sodas. Marketed in cans, bottles, or fountain dispense.
- Juices - We have considered packaged juices which encompass non-alcoholic beverages derived from fruits, vegetables, or a combination thereof, processed and sealed in various packaging formats such as bottles, cartons, or pouches. Excluding fresh juices, this market segment involves commercially prepared and preserved juices, often with added preservatives and flavors.
- Ready-to-Drink (RTD) Tea and RTD Coffee - Ready-to-Drink (RTD) tea and RTD coffee are pre-packaged, non-alcoholic beverages that are brewed and prepared for consumption without further dilution. RTD tea typically includes various tea varieties, infused with flavors and sweeteners, and comes in bottles, cans, or cartons. Similarly, RTD coffee involves pre-brewed coffee formulations, often mixed with milk, sugar, or flavorings, and is conveniently packaged for on-the-go consumption.
- Energy Drinks - Energy drinks are non-alcoholic beverages formulated to provide a quick boost of energy and alertness. Whereas, sports drinks are beverages designed to hydrate and replenish electrolytes, particularly after physical exertion, exercise, or intense activity
| Keyword | Definition |
|---|---|
| Carbonated Soft Drinks | Carbonated soft drinks (CSDs) are a combination of carbonated water and flavouring, sweetened by sugar or a non-sugar sweeteners. |
| Standard Cola | Standard Cola is defined as the original flavor of cola soda. |
| Diet Cola | A cola-based soft drink containing no or low amounts of sugar |
| Fruit Flavored Carbonates | A carbonated beverage prepared from fruit juice/fruit flavor with carbonated water and containing sugar, dextrose, invert sugar or liquid glucose either singly or in combination. It may contain peel oil and fruit essences. |
| Juice | Juice is a drink made from the extraction or pressing of the natural liquid contained in fruit and vegetables. |
| 100% Juice | Fruit/vegetable juice made from fruit in the form of its juice with no water added to make up the volume. It is not permitted to add sugars, sweeteners, preservatives, flavourings or colourings to fruit juice. |
| Juice Drinks (up to 24% Juice) | Fruit/vegetable juice drinks with up to 24% fruits/vegetable extract. |
| Nectars (25-99% Juice) | Juices that can have between 25 and 99% of fruit, with the minimum legal limits defined depending on the type of fruit |
| Juice concentrates | Juice Concentrates are those form of juices when most of this liquid is removed resulting in a thick, syrupy product known as juice concentrate. |
| RTD Coffee | Packaged coffee beverages that are sold in a prepared form and are ready for consumption at the time of purchase. |
| Iced Coffee | An iced coffee is a cold version of coffee, usually a combination of hot espresso and milk with ice added to it. |
| Cold Brew Coffee | Cold brew also called cold water extraction or cold pressing is made by steeping ground coffee in room-temperature water for several hours. |
| RTD Tea | Ready-to-drink (RTD) tea is a packaged tea product ready for immediate consumption without brewing or preparation |
| Iced Tea | Ice tea or iced tea is a drink made from tea without milk but with sugar and sometimes fruit flavourings, drunk cold. |
| Green Tea | Green tea is a tea beverage which promotes mental alertness, relieving digestive symptoms and promoting weight loss. |
| Herbal Tea | Herbal tea beverages are made from the infusion or decoction of herbs, spices, or other plant material in hot water. |
| Energy Drink | A type of drink containing stimulant compounds, usually caffeine, which is marketed as providing mental and physical stimulation. They may or may not be carbonated and may also contain sugar, other sweeteners, or herbal extracts, among numerous possible ingredients. |
| Sugar-free or Low-calories Energy Drinks | Sugar-free or Low-calories Energy Drinks are sugar-free, artificially sweetened energy drinks with few or no calories. |
| Traditional Energy Drink | Traditional Energy Drinks are functional soft drinks containing ingredients designed to boost the consumer's energy. |
| Natural/Oraganic Energy Drinks | Natural/Organic energy drinks are energy drinks free of artificial sweeteners and synthetic colorings. Instead, they contain naturally derived ingredients such as green tea, yerba mate, and botanical extracts. |
| Energy Shots | A small but highly concentrated energy drink that contains large amounts of caffeine and/or other stimulants. The quantity is comparatively smaller compared to energy drinks. |
| Sports Drink | Sports drinks are beverages designed specifically for the rapid supply of fluid, carbohydrates, and electrolytes before, during or after exercise. |
| Isotonic | Isotonic drinks contain similar concentrations of salt and sugar as in the human body, and are designed to quickly replace fluids lost during exercise but with an increase of carbohydrate. |
| Hypertonic | Hypertonic drinks have a higher concentration of salt and sugar than the human body. They are best drunk after exercise as it is important to replace glycogen levels quickly after exercise. |
| Hypotonic | Hypotonic drinks are designed to quickly replace fluids lost during exercise. They have very low carbohydrate content and a lower concentration of salt and sugar than the human body. |
| Electrolyte-Enhanced Water | Electrolyte water is water infused with electrically-charged minerals, such as sodium, potassium, calcium, and magnesium. |
| Protein-based Sport Drinks | Protein-based sports drinks are those sports drinks which has added protein in it that will improve performance and reduce muscle protein breakdown. |
| On-Trade | The on-trade refers to places that sell beverages for immediate consumption on the premises like bars, restaurants, and pubs |
| Off-Trade | Off-trade usually means places like liquor stores, supermarkets and other places where you don't consume the beverage right away. |
| Convenience Store | A retail business that provides the public with a convenient location to quickly purchase a wide variety of consumable products and services, generally food and gasoline. |
| Specialty store | A specialty store is a shop/store that carries a deep assortment of brands, styles, or models within a relatively narrow category of goods |
| Online Retail | Online retail is a type of eCommerce whereby a business sells goods or services directly to consumers from a website. |
| Aseptic Packaging | Aseptic packaging refers to the filling of a cold, commercially sterile product under sterile conditions into a presterilized container and closure under sterile conditions to form a seal that effectively excludes microorganisms. These includes tetra packs, cartons, pouches etc. |
| PET Bottle | PET bottle means a bottle made of polyethylene terephthalate. |
| Metal Cans | Metal containers made of aluminum or tin- plated or zinc-plated steel, which are commonly used for packaging food, beverages or other products. |
| Disposable Cups | Disposable Cup means a cup or other container designed for single use to serve beverages, such as water, cold drinks, hot drinks and alcoholic beverages. |
| Gen Z | A way of referring to the group of people who were born in the late 1990s and early 2000s. |
| Millenial | Anyone born between 1981 and 1996 (ages 23 to 38 in 2019) is considered a Millennial |
| Taurine | Taurine is an amino acid that supports immune health and nervous system function. |
| Bars & Pubs | It is a drinking establishment licensed to serve alcoholic drinks for consumption on the premises. |
| Café | It is a foodservice establishment serving refreshments (mainly coffee) and light meals. |
| On the go | It means doing / dealing with while busily engaged with something and not diverting plans in order to accommodate. |
| Internet Penetration | The Internet Penetration Rate corresponds to the percentage of the total population of a given country or region that uses the Internet. |
| Vending Machine | A machine that dispenses small articles such as food, drinks, or cigarettes when a coin or token is inserted |
| Discount store | A discount store or discounter offers a retail format in which products are sold at prices that are in principle lower than an actual or supposed "full retail price". Discounters rely on bulk purchasing and efficient distribution to keep down costs. |
| Clean Label | Clean label on the beverage market are drinks that are made from few ingredients of natural origin and are not or only slightly processed. |
| Caffeine | An alkaloid compound which is a stimulant of the central nervous system. It is mainly used recreationally, as a mild cognitive enhancer to increase alertness and attentional performance. |
| Extreme sport | Action sports, adventure sports or extreme sports are activities perceived as involving a high degree of risk. |
| High-intensity interval training | It incorporates several rounds that alternate between several minutes of high intensity movements to significantly increase the heart rate to at least 80% of one's maximum heart rate, followed by short periods of lower intensity movements. |
| Shelf life | The length of time for which an item remains usable, fit for consumption, or saleable. |
| Cream Soda | Cream soda is a sweet soft drink. Generally flavored with vanilla and based on the taste of an ice cream float |
| Root Beer | Root beer is a sweet North American soft drink traditionally made using the root bark of the sassafras tree Sassafras albidum or the vine of Smilax ornata as the primary flavor. Root beer is typically, but not exclusively, non-alcoholic, caffeine-free, sweet, and carbonated. |
| Vanilla Soda | A carbonated soft drink flavoured with vanilla. |
| Dairy-Free | A product that does not contain any milk or milk products from cows, sheep or goats. |
| Caffeine-Free Energy Drinks | Caffeine-free energy drinks rely on other ingredients to boost the energy. Popular choices include amino acids, B vitamins, and electrolytes. |
Need More Details on Market Definition?
Ask a Question
Research Methodology
Mordor Intelligence follows a four-step methodology in all our reports.
- Step-1: IDENTIFY KEY VARIABLES: In order to build a robust forecasting methodology, the variables and factors identified in Step 1 are tested against available historical market numbers. Through an iterative process, the variables required for market forecast are set, and the model is built on the basis of these variables.
- Step-2: Build a Market Model: Market-size estimations for the forecast years are in nominal terms. Inflation is not a part of the pricing, and the average selling price (ASP) is kept constant throughout the forecast period for each country.
- Step-3: Validate and Finalize: In this important step, all market numbers, variables, and analyst calls are validated through an extensive network of primary research experts from the market studied. The respondents are selected across levels and functions to generate a holistic picture of the market studied.
- Step-4: Research Outputs: Syndicated reports, custom consulting assignments, databases & subscription platforms

Get More Details On Research Methodology
Download PDF


