Market Overview
| Study Period | 2020 - 2030 |
|---|---|
| Base Year For Estimation | 2024 |
| Forecast Data Period | 2025 - 2030 |
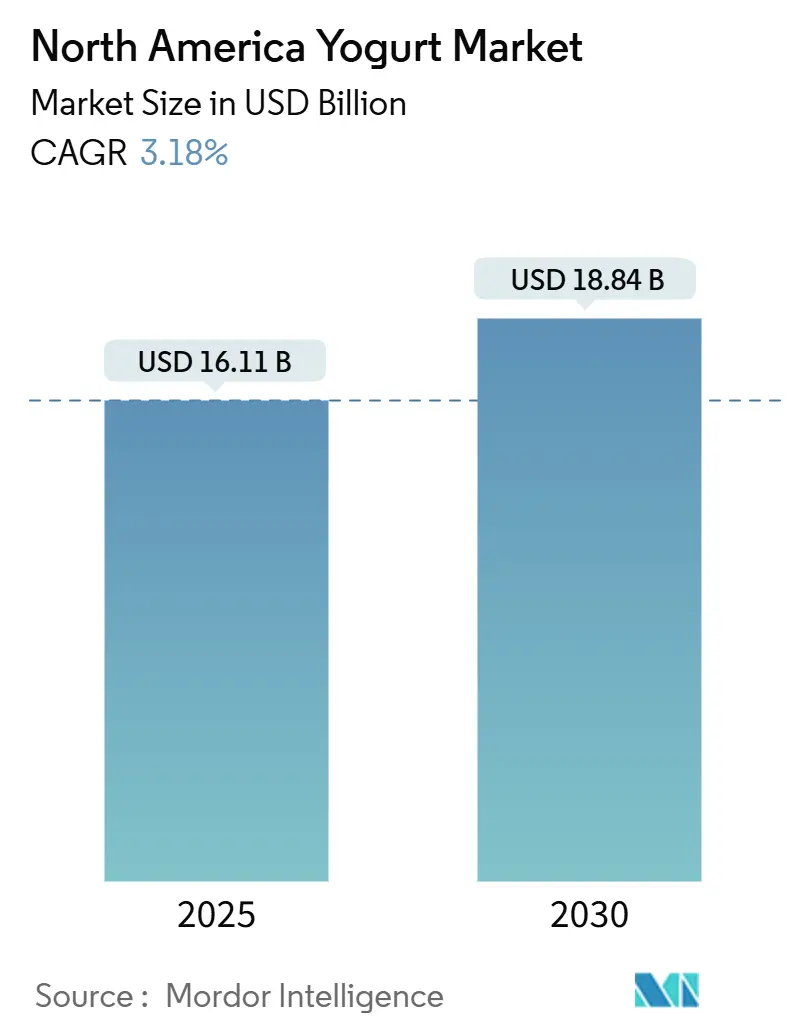
| Market Size (2025) | USD 16.11 Billion |
| Market Size (2030) | USD 18.84 Billion |
| Growth Rate (2025 - 2030) | 3.18% CAGR |
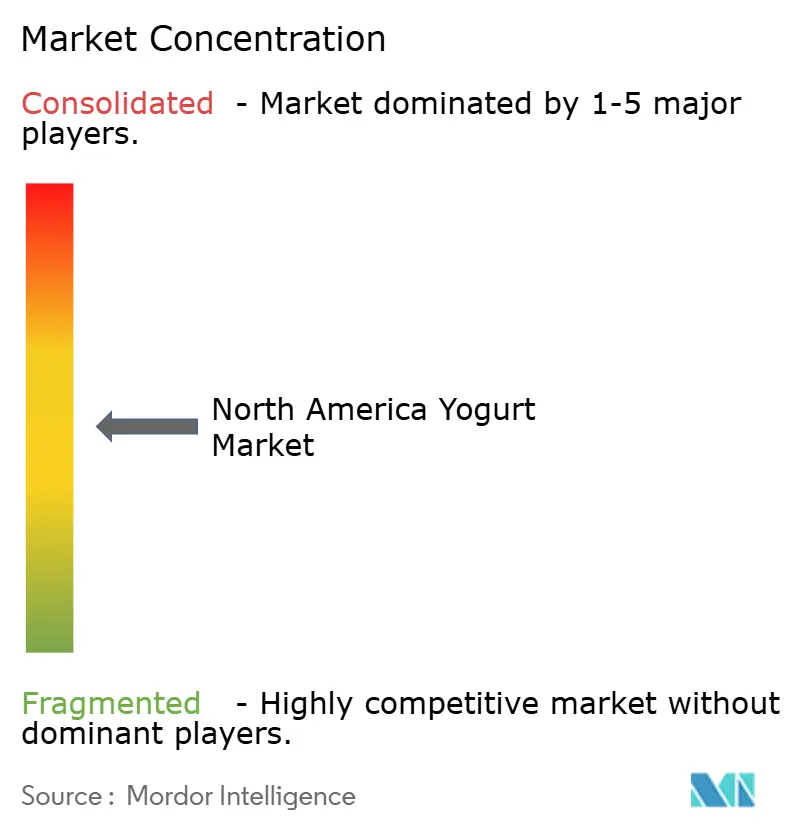
| Market Concentration | Medium |
Major Players
*Disclaimer: Major Players sorted in no particular order Image © Mordor Intelligence. Reuse requires attribution under CC BY 4.0. |
|
North America Yogurt Market Analysis by Mordor Intelligence
The North America yogurt market size stands at USD 16.11 billion in 2025 and is projected to advance to USD 18.84 billion by 2030, reflecting a 3.18% CAGR over the forecast period. This growth indicates that the North America yogurt market is shifting from volume-led expansion toward value-focused premiumization, where protein fortification, probiotic specificity, and functional claims carry greater weight than purely indulgent flavors. Manufacturers are leveraging the United States Food and Drug Administration’s May 2024 qualified health claim that links regular yogurt intake with reduced type 2 diabetes risk, allowing brands to frame yogurt as a preventive nutrition tool rather than only a breakfast or snack item. According to International Diabetes Federation, The North America and Caribbean (NAC) region, encompassing Canada, Mexico, the USA, and 22 Caribbean countries, reported 56.2 million adults (20-79 years) with diabetes in 2024, projected to rise 22% to 68.1 million by 2050[1]Source: International Diabetes Federation, “North America and Caribbean”, diabetesatlas.org. Clean-label reformulations, plant-based extensions, and convenient drinkable formats are broadening the North America yogurt market’s consumer base, especially among millennials and Gen Z buyers who expect minimal ingredients, transparent sourcing, and on-the-go packaging. Competitive intensity remains high as multinational incumbents guard shelf space through exclusive retailer partnerships.
Key Report Takeaways
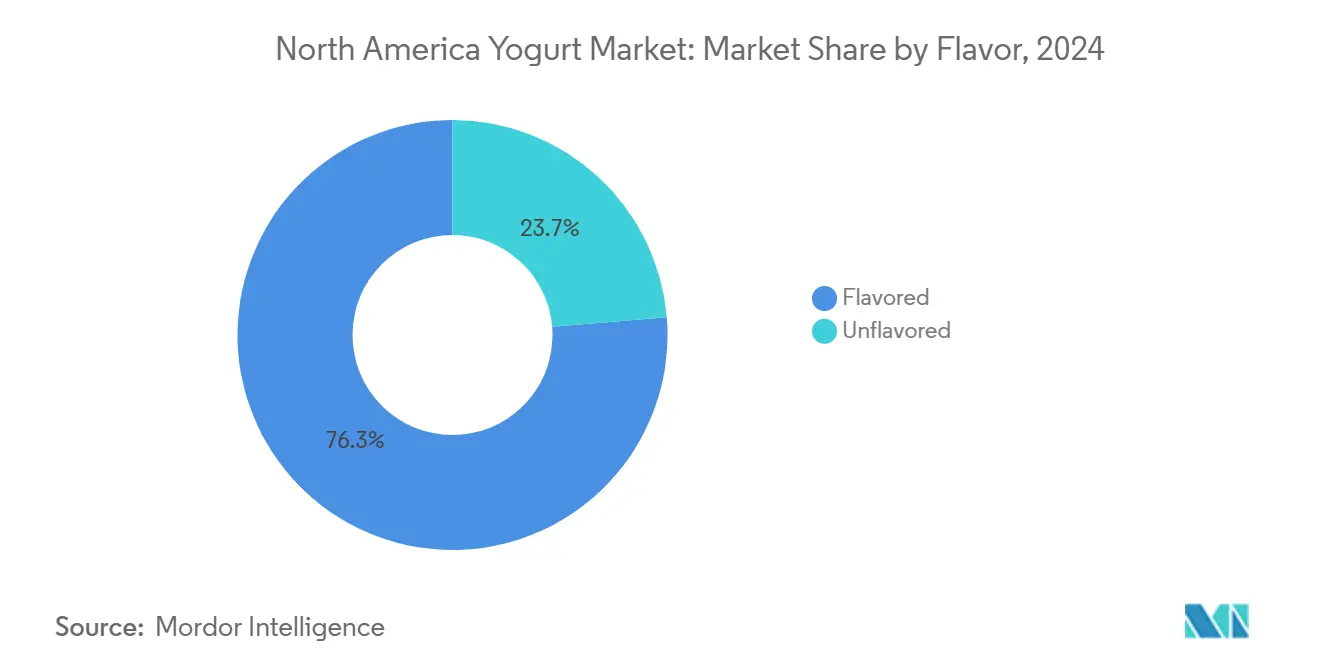
- By flavor, flavored yogurt led with 76.32% of the North America yogurt market share in 2024, while unflavored variants are forecast to post the fastest 3.87% CAGR through 2030.
- By category, spoonable yogurt held 82.07% of the North America yogurt market size in 2024, whereas drinkable yogurt is on track to expand at a 3.71% CAGR over 2025-2030.
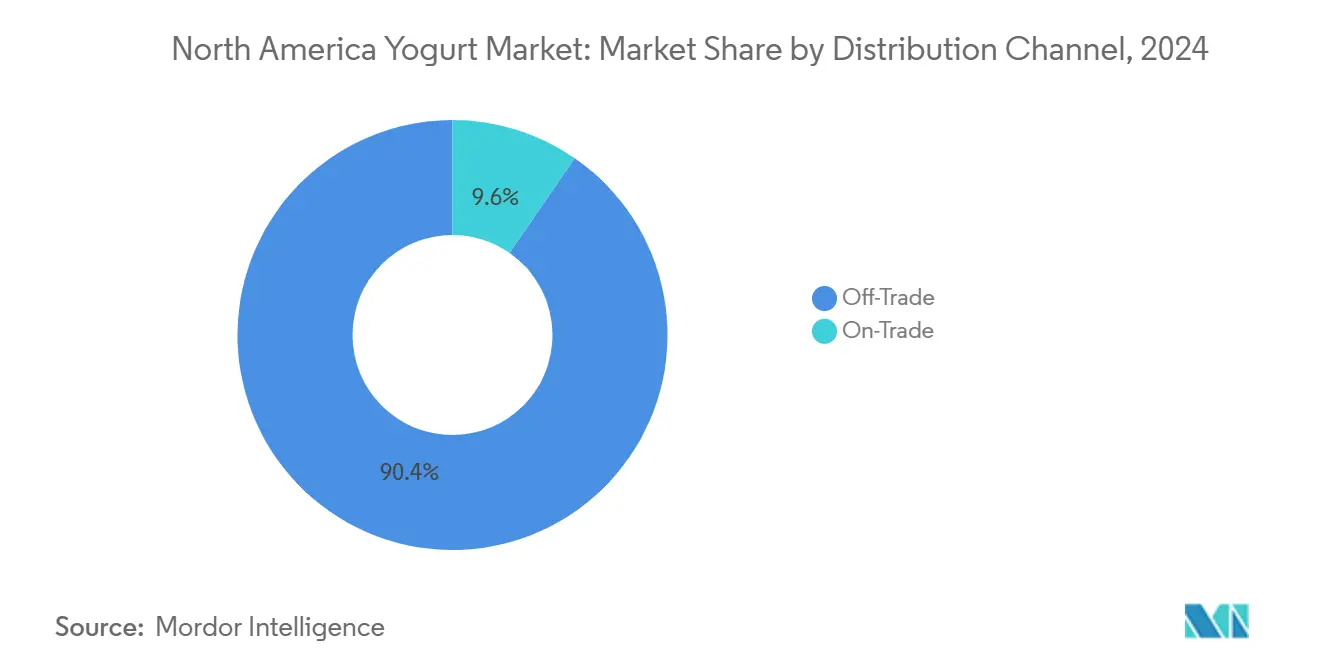
- By distribution channel, off-trade accounted for 90.37% of 2024 revenue, yet on-trade will grow the fastest at a 4.11% CAGR as foodservice demand rebounds.
- By geography, the United States commanded 73.37% of 2024 regional sales, while Mexico is projected to record a 3.36% CAGR, outpacing Canada’s mature trajectory.
North America Yogurt Market Trends and Insights
Drivers Impact Analysis
| Driver | (~) % Impact on CAGR Forecast | Geographic Relevance | Impact Timeline |
|---|---|---|---|
| Rising health awareness around probiotics, protein, and gut health | +0.6% | United States, Canada, with spillover to urban Mexico | Medium term (2-4 years) |
| Growing demand for plant-based and flavored yogurt options | +0.5% | United States and Canada, selective premium channels in Mexico | Short term (≤ 2 years) |
| Convenience of single-serve and drinkable yogurts | +0.4% | United States and Canada, emerging in Mexico City and Monterrey | Short term (≤ 2 years) |
| Product innovation with functional ingredients | +0.3% | United States and Canada, gradual adoption in Mexico | Medium term (2-4 years) |
| Preference for clean-label and organic products | +0.3% | United States and Canada, niche urban Mexico | Medium term (2-4 years) |
| Continued growth of Greek yogurt popularity | +0.2% | United States and Canada, stable mature demand | Long term (≥ 4 years) |
| Source: Mordor Intelligence | |||
Understand The Key Trends Shaping This Market
Download PDF
Rising health awareness around probiotics, protein, and gut health
Rising health awareness around probiotics, protein, and gut health serves as a primary market driver for the North America yogurt market, fueling demand for functional products like Greek and high-protein variants that support digestive wellness, immunity, muscle recovery, and overall nutrition. Consumers, particularly health-conscious Millennials and Gen Z, increasingly seek probiotic-rich yogurts with live cultures for gut microbiome benefits amid rising digestive disorder prevalence, while high-protein options align with keto, paleo, and fitness trends for satiety and weight management. Millennials, representing approximately 74.19 million people in the United States in 2024, according to the U.S. Census Bureau, constitute the largest generational demographic and drive yogurt consumption trends [2]Source: US Census Bureau, "National Population by Characteristics: 2020-2024", census.gov.This shift has boosted segments like traditional unflavored yogurt (retaining natural probiotics) and drinkable formats, with innovations in clean-label, fortified, and plant-based alternatives further accelerating market growth
Growing demand for plant-based and flavored yogurt options
In North America, the yogurt market is witnessing a surge, fueled by a growing appetite for plant-based and flavored options. This trend is largely driven by heightened awareness of lactose intolerance, a rise in veganism, and a quest for diverse, indulgent flavors, especially among health-conscious Millennials and Gen Z. Consumers are increasingly seeking yogurt products that align with their dietary preferences and ethical values, leading to a significant demand for plant-based alternatives. Options derived from almond, soy, coconut, and oat milk have gained significant traction in the market. These alternatives not only cater to vegans and individuals with dietary restrictions but also appeal to mainstream consumers who prioritize variety, cleaner ingredient profiles, and sustainability. Recognizing this shift, manufacturers like Danone and Chobani are broadening their portfolios by introducing innovative plant-based yogurt products. This strategic expansion aligns with a broader movement toward sustainable, non-dairy innovations, reflecting the evolving preferences of modern consumers and the growing emphasis on environmentally friendly food choices.
Convenience of single-serve and drinkable yogurts
In North America, the yogurt market thrives on the convenience of single-serve and drinkable options. These formats cater to the fast-paced lifestyles of busy consumers, including young professionals, parents, and students. They seek portable, nutrient-dense snacks that don't require refrigeration and are mess-free, making them ideal for on-the-go consumption. Single-serve cups, squeezable pouches, and drinkable formats like smoothies have surged in popularity, particularly in the United States. This rise aligns with increasing snacking trends and heightened health awareness, as consumers prioritize healthier alternatives to traditional snacks. Additionally, the growth of supermarkets, hypermarkets, and e-commerce platforms has played a significant role in ensuring easy access to these products, further driving their demand. The combination of convenience, health benefits, and accessibility continues to position single-serve and drinkable yogurts as a key segment within the yogurt market.
Product innovation with functional ingredients
Product innovation with functional ingredients propels the North America yogurt market by addressing consumer demands for enhanced health benefits, integrating probiotics, prebiotics, vitamins, minerals, fiber, omega-3s, and adaptogens into formulations that support gut health, immunity, digestion, and metabolic wellness amid rising wellness trends. Leading brands like Chobani and Danone leverage advanced fermentation technologies, precision nutrition via AI-driven personalization, and clean-label fortification to create probiotic-rich Greek yogurts, low-sugar variants, and nutrient-dense options that align with clean-label preferences, reduced additives, and non-genetically modified organism standards. This focus on functional dairy, including immunity-boosting and microbiome-targeted products, drives market expansion.
Restraints Impact Analysis
| Restraint | (~) % Impact on CAGR Forecast | Geographic Relevance | Impact Timeline |
|---|---|---|---|
| Intense competition and market saturation | -0.4% | United States and Canada, moderate in Mexico | Short term (≤ 2 years) |
| Supply chain disruptions affecting availability | -0.3% | United States and Canada, sporadic in Mexico | Short term (≤ 2 years) |
| Price sensitivity limiting uptake of premium products | -0.2% | United States and Canada, pronounced in Mexico | Medium term (2-4 years) |
| Shelf-life and cold chain logistics increase costs | -0.2% | United States, Canada, and Mexico | Medium term (2-4 years) |
| Source: Mordor Intelligence | |||
Intense competition and market saturation
In North America's yogurt market, intense competition and saturation dominate the landscape. This market is characterized by a fragmented structure, where multinational giants such as Danone, Chobani, Fage, and Lactalis compete aggressively with regional players. These companies are driving innovation in Greek, plant-based, and functional yogurt variants to capture consumer interest. However, this fierce competition has resulted in significant price pressures and shrinking profit margins, making profitability a challenge. The United States as a mature market, is experiencing slowed growth primarily due to oversupply. Furthermore, it faces increasing threats from substitutes such as plant-based alternatives and kefir, which are gaining popularity among consumers. Shifting consumer demands, influenced by fluctuating dairy costs and broader economic uncertainties, add to the complexity of the market dynamics. As rivalry intensifies, companies are increasingly pursuing consolidation strategies through mergers, acquisitions, and partnerships to strengthen their market positions. Despite these efforts, differentiation remains a significant challenge in a crowded retail environment that heavily relies on supermarket distribution channels. To address this, brands are investing heavily in marketing campaigns and developing novel formulations to appeal to health-conscious consumers.
Supply chain disruptions affecting availability
Supply chain disruptions are significantly restraining the North America yogurt market. These disruptions directly impact the availability of raw materials, increase production costs, and cause intermittent shortages of essential dairy inputs like milk. Factors such as climate events, feed shortages, geopolitical tensions, tariffs, and the lingering effects of the COVID-19 pandemic further exacerbate these issues. The fluctuating prices of milk products, combined with the perishable nature of yogurt, add to the challenges faced by cold-chain logistics. This is particularly evident in rural distribution and imports, where vulnerabilities are more pronounced. Consequently, major players like Danone and Chobani are experiencing strained profit margins, even as the market witnesses moderate marketing and advertising activity and ongoing consolidation efforts. These compounded challenges, along with economic uncertainties and increasing regulatory demands, continue to hinder the stability of supply in a United States dominated market.
Segment Analysis
By Flavor: Customization Drives Unflavored Surge
Flavored yogurt commands the dominant position in the North America yogurt market with 76.32% share in 2024. This leadership stems from strong consumer preference for diverse taste profiles like vanilla, strawberry, and peach, positioning it as a versatile option for breakfast, snacks, and desserts. Major supermarkets and hypermarkets bolster this dominance by allocating around 77% of shelf space to flavored variants and running frequent promotions. The segment benefits from its nutrient-dense appeal, attracting health-conscious buyers seeking indulgent yet functional foods. In the United States, flavored yogurt sees particularly robust demand due to high interest in innovative flavor blends.
Unflavored yogurt variants register the fastest growth in the North America yogurt market at a projected 3.87% CAGR through 2030. This acceleration reflects rising demand for natural, minimally processed dairy products amid health and wellness trends. In Canada, per capita consumption of unflavored yogurt reaches about 2.50 kg, underscoring regional affinity for plain options. Manufacturers respond with innovations like plain Greek yogurt to cater to diverse preferences for less sweetened formats. The segment gains traction as consumers prioritize cleaner labels and traditional dairy styles over heavily flavored alternatives.
Get Detailed Market Forecasts at the Most Granular Levels
Download PDF
By Category: Drinkable Gains on Portability
Spoonable yogurt dominated the North America yogurt market with 82.07% share in 2024. This commanding position reflects longstanding consumer preference for traditional formats suitable for breakfast bowls, parfaits, and snacks. The segment benefits from versatile culinary applications, including toppings and mixes that appeal to families and health-focused eaters. Major brands leverage established distribution in supermarkets, which account for significant off-trade sales volume. Spoonable variants also align with protein-rich trends through Greek and high-protein innovations that maintain loyalty among fitness enthusiasts. Overall, this category sustains market leadership amid steady demand for spoonable textures in urban and suburban households.
Drinkable yogurt projects the fastest expansion in the North America yogurt market at a 3.71% CAGR over 2025-2030. This growth trajectory responds to rising on-the-go consumption patterns among millennials and busy professionals seeking convenient breakfast options. Manufacturers innovate with portable formats like tetra packs and pouches to capture snacking occasions outside home settings. The segment gains momentum from flavor innovations, including fruit purees and low-sugar blends that target digestive health seekers. E-commerce and convenience store channels further accelerate accessibility for this dynamic category. Drinkable yogurt positions as a key growth driver, outpacing overall market rates through lifestyle-aligned product developments.
By Distribution Channel: On-Trade Awakens Post-Pandemic
Off-trade channels captured 90.37% of the North America yogurt market revenue in 2024. This overwhelming dominance arises from the extensive network of supermarkets, hypermarkets, convenience stores, and online platforms that provide consumers with broad product variety and competitive pricing. Supermarkets and hypermarkets alone drive significant off-trade sales through dedicated shelf space and promotional campaigns tailored to yogurt categories. The channel's strength lies in enabling bulk purchases and easy comparison shopping, appealing to families and regular buyers seeking everyday essentials. E-commerce growth within off-trade further solidifies this position by offering home delivery and digital catalogs for busy urban consumers.
On-trade channels project the fastest growth in the North America yogurt market at a 4.11% CAGR through the forecast period. This acceleration signals a strong rebound in foodservice demand as restaurants, cafes, and quick-service outlets incorporate yogurt into menus for smoothies, parfaits, and health-focused dishes. Post-pandemic recovery boosts on-trade volumes, with operators prioritizing probiotic-rich yogurt for wellness-oriented offerings. In the United States, 55% of consumers preferred dining at restaurants over ordering takeout or delivery in 2023, according to US Foods Inc. [3]Source: US Foods, Inc., "The Diner Dispatch: 2024 American Dining Habits", usfoods.com.The segment benefits from rising interest in experiential dining where yogurt serves as a versatile ingredient in breakfast and dessert applications. Cafeterias and full-service establishments expand yogurt usage to meet consumer demands for lighter, protein-packed options.
Get Detailed Market Forecasts at the Most Granular Levels
Download PDF
Geography Analysis
The United States dominates the North America yogurt market with 73.37% of revenue in 2024. This substantial lead stems from mature market infrastructure featuring extensive retail networks and advanced cold-chain logistics that ensure product freshness across urban and suburban areas. High per-capita consumption, averaging around 13 pounds annually, underscores strong consumer integration of yogurt into daily diets for breakfasts, snacks, and meal components. Diverse product offerings span conventional dairy, organic variants, Greek-style high-protein formats, and rapidly expanding plant-based alternatives to meet varied demographic preferences. Leading brands leverage innovation in flavors, textures, and functional benefits like probiotics to sustain loyalty among health-conscious millennials and families.
Mexico emerges as the fastest-growing geography in the North America yogurt market at a 3.36% CAGR from 2025 to 2030. This robust expansion reflects rising middle-class incomes that enable premium yogurt purchases beyond basic staples in household budgets. Urbanization accelerates demand as city dwellers adopt Western-style snacking habits incorporating yogurt parfaits and smoothies into fast-paced lifestyles. Increasing protein awareness drives shifts toward Greek and high-protein variants, positioning yogurt as a fitness-friendly alternative to traditional Mexican dairy like queso fresco. Manufacturers target this growth through localized flavors blending tropical fruits with probiotics to align with cultural tastes and health trends.
Canada's market, though smaller, remains stable. Bilingual labeling mandates and distribution intricacies across provinces tend to benefit larger national players. Consumers in Canada show a pronounced loyalty to homegrown brands like Ultima Foods and Saputo. These brands, by sourcing locally and catering to regional tastes, effectively challenge their multinational counterparts. In regions like British Columbia and Ontario, where there's a blend of environmental awareness and disposable income, sales of organic and grass-fed yogurts are on the rise, commanding premium prices. While the cold-chain infrastructure is well-established, the country's vast distances and the sparse population in its northern areas pose challenges, limiting distribution and driving up logistics costs.
Competitive Landscape
The North America yogurt market exhibits a moderately fragmented competitive landscape characterized by a blend of multinational corporations and regional specialists. Global dairy giants such as Danone, Chobani, and Lactalis command significant market shares through established brands, extensive distribution networks, and economies of scale that support nationwide availability. These leaders invest heavily in product innovation, including Greek-style, plant-based, and functional yogurts tailored to health-conscious consumers. Meanwhile, smaller regional players and artisanal producers capture niche segments with premium, locally sourced offerings that emphasize organic ingredients and unique flavors.
Competition intensifies through diverse strategies including aggressive pricing, promotional campaigns in supermarkets, and rapid innovation cycles to address shifting preferences for low-sugar and probiotic-enriched variants. Major players leverage superior supply chains and cold-chain infrastructure to ensure product freshness, while smaller firms differentiate via storytelling around sustainable sourcing and craft production methods. The market sees robust merger and acquisition activity, with large companies acquiring innovative startups to expand portfolios into high-growth areas like non-dairy and high-protein yogurts. Strategic partnerships between manufacturers and retailers enhance shelf space allocation and co-branded promotions, particularly in off-trade channels that dominate 90% of sales.
Fragmentation persists amid rising e-commerce penetration and private-label expansions by major retailers like Walmart and Kroger, which challenge branded leaders through value-oriented offerings. Companies increasingly pursue vertical integration to control raw milk supplies and production processes, ensuring quality amid volatile dairy prices. Technology alliances emerge for advanced fermentation techniques and packaging innovations that extend shelf life and appeal to convenience-driven consumers. Overall, the moderately fragmented nature supports consumer choice while pressuring all players to innovate continuously, with global firms likely consolidating further influence through targeted acquisitions. This environment positions the market for sustained dynamism through 2030.
North America Yogurt Industry Leaders
-
Danone S.A.
-
Chobani LLC
-
General Mills Inc.
-
Groupe Lactalis
-
FAGE International S.A.
- *Disclaimer: Major Players sorted in no particular order
Need More Details on Market Players and Competitors?
Download PDF
Recent Industry Developments
- November 2025: Lactalis USA has rolled out its latest yogurt offering, Pro-Fiber, touted as GLP-1-friendly, now gracing shelves nationwide. Each 5.3oz serving boasts 20g of protein and 10g of fiber, all without added sugars. The protein derives from ultrafiltration and whey protein concentrate, while the fiber is sourced from soluble corn and chicory root. Pro-Fiber tantalizes taste buds with four flavors: Vanilla, Blueberry, Lemon Meringue, and Piña Colada.
- August 2025: Danone is set to invest millions in expanding its yogurt factory in Minster, Ohio, in response to surging demand for high-protein, nutrient-rich foods boasting probiotic advantages. The expansion will see an addition of 48,000 square feet, the introduction of a new production line, and enhancements to the current lines.
- November 2024: LALA U.S., Inc. unveiled LALA Gold, its new line of high-protein yogurts targeting health-conscious consumers. Available in both drinkable (10 oz) and spoonable (5.3 oz) formats, the drinkable variant boasts 25g of protein, 6g of fiber, and is free from added sugars. Meanwhile, the spoonable cups deliver 20g of protein, 1g of fiber, active probiotics, and also contain no added sugars. Flavor offerings span from Raspberry Key Lime and Blueberry to Cookies & Cream, Vanilla, and Strawberry.
- October 2024: Chobani introduced a Greek yogurt product line comprising high-protein cups and beverages. The yogurt cups contain 20g of protein per serving, while the beverages provide 15g, 20g, or 30g of protein per serving. The products incorporate natural ingredients without added sugars.
North America Yogurt Market Report Scope
Flavored Yogurt, Unflavored Yogurt are covered as segments by Product Type. Off-Trade, On-Trade are covered as segments by Distribution Channel. Canada, Mexico, United States are covered as segments by Country.
Flavor
| Flavored |
| Unflavored |
Category
| Drinkable Yogurt |
| Spoonable Yogurt |
By Distribution Channel
| Off-Trade | Supermarkets and Hypermarkets |
| Convenience Stores | |
| Online Retail | |
| Specialist Retailers | |
| Others | |
| On-Trade |
By Country
| United States |
| Canada |
| Mexico |
| Rest of North America |
| Flavor | Flavored | |
| Unflavored | ||
| Category | Drinkable Yogurt | |
| Spoonable Yogurt | ||
| By Distribution Channel | Off-Trade | Supermarkets and Hypermarkets |
| Convenience Stores | ||
| Online Retail | ||
| Specialist Retailers | ||
| Others | ||
| On-Trade | ||
| By Country | United States | |
| Canada | ||
| Mexico | ||
| Rest of North America | ||
Need A Different Region or Segment?
Customize Now
Market Definition
- Butter - Butter is a yellow-to-white solid emulsion of fat globules, water, and inorganic salts produced by churning the cream from cows’ milk
- Dairy - Dairy product include milk and any of the foods made from milk, including butter, cheese, ice cream, yogurt, and condensed and dried milk.
- Frozen Desserts - Frozen dairy dessert means and includes products containing milk or cream and other ingredients which are frozen or semi-frozen prior to consumption, such as ice milk or sherbet, including frozen dairy desserts for special dietary purposes, and sorbet
- Sour Milk Drinks - Sour milk is thick, curdled milk, with a sour taste, obtained from the fermentation of milk. Sour milk drinks such as kefir, laban, buttermilk have been considered in the study
| Keyword | Definition |
|---|---|
| Cultured Butter | Cultured butter is prepared by having the raw butter go through chemical processing and has been added with certain emulsifiers and foreign ingredients. |
| Uncultured Butter | This type of butter is one which has not been processed in any way |
| Natural Cheese | The type of cheese in its most natural form. It is made from natural and simple products and ingredients, including fresh and natural salts, natural colors, enzymes, and high-quality milk. |
| Processed Cheese | Processed cheese undergoes the same processes as natural cheese; however, it requires more steps and many different forms of ingredients. Making processed cheese involves melting natural cheese, emulsifying it, and adding preservatives and other artificial ingredients or colorings. |
| Single Cream | Single cream contains around 18% fat. It’s a single layer of cream that appears over boiled milk. |
| Double Cream | Double cream contains 48% fat, more than double the amount of fat of single cream. It’s heavier and thicker than single cream |
| Whipping Cream | This has a much higher fat percentage than single cream (36%). Used to top cakes, pies, and puddings and as a thickener for sauces, soups, and fillings. |
| Frozen Desserts | Desserts that are meant to be eaten in frozen condition. E.g., sherbets, sorbets, frozen yogurts |
| UHT Milk (Ultra-high temperature milk) | Milk heated at a very high temperature. Ultra-high-temperature processing (UHT) of milk involves heating for 1–8 sec at 135–154°C. which kills the spore-forming pathogenic microorganism, resulting in a product with a shelf-life of several months. |
| Non-dairy butter/Plant-based butter | Butter made from plant-derived oil such as coconut, palm, etc. |
| Non-dairy Yogurt | Yogurt made from typically made from nuts, like almonds, cashews, coconuts, and even other foods like soybeans, plantains, oats, and peas |
| On-trade | It refers to restaurants, QSRs, and bars. |
| Off-trade | It refers to supermarkets, hypermarkets, on-line channels, etc. |
| Neufchatel cheese | One of the oldest kinds of cheese in France. It is a soft, slightly crumbly, mold-ripened, bloomy-rind cheese made in the Neufchâtel-en-Bray region of Normandy. |
| Flexitarian | It refers to a consumer preferring a semi-vegetarian diet, that is centered on plant foods with limited or occasional inclusion of meat. |
| Lactose Intolerance | Lactose intolerance is a reaction in digestive system to lactose, the sugar in milk. It causes uncomfortable symptoms in response to the consumption of dairy products. |
| Cream Cheese | Cream cheese is a soft and creamy fresh cheese with a tangy taste made from milk and cream. |
| Sorbets | Sorbet is a frozen dessert made using ice combined with fruit juice, fruit purée, or other ingredients, such as wine, liqueur, or honey. |
| Sherbet | Sherbet is a sweetened frozen dessert made with fruit and some sort of dairy product such as milk or cream. |
| Shelf stable | Foods that can be safely stored at room temperature, or "on the shelf," for at least one year and do not have to be cooked or refrigerated to eat safely. |
| DSD | Direct Store Delivery is the process in supply chain management wherein the product is delivered from manufacturing plant directly to the retailer. |
| OU Kosher | Orthodox Union Kosher is a kosher certification agency based in New York City. |
| Gelato | Gelato is a frozen creamy dessert made with milk, heavy cream and sugar. |
| Grass-fed Cows | Grass-fed cows are allowed to graze in pastures, where they eat a variety of grasses and clover. |
Need More Details on Market Definition?
Ask a Question
Research Methodology
Mordor Intelligence follows a four-step methodology in all our reports.
- Step-1: Identify Key Variables: In order to build a robust forecasting methodology, the variables and factors identified in Step 1 are tested against available historical market numbers. Through an iterative process, the variables required for market forecast are set, and the model is built on the basis of these variables.
- Step-2: Build a Market Model: Market-size estimations for the forecast years are in nominal terms. Inflation is not a part of the pricing, and the average selling price (ASP) is kept constant throughout the forecast period for each country.
- Step-3: Validate and Finalize: In this important step, all market numbers, variables, and analyst calls are validated through an extensive network of primary research experts from the market studied. The respondents are selected across levels and functions to generate a holistic picture of the market studied.
- Step-4: Research Outputs: Syndicated Reports, Custom Consulting Assignments, Databases & Subscription Platforms

Get More Details On Research Methodology
Download PDF


