
Market Overview
| Study Period | 2021 - 2031 |
|---|---|
| Forecast Data Period | 2026 - 2031 |
| Base Year Market Size (2025) | 188.75 gigawatt |
| Market Volume (2026) | 198.17 gigawatt |
| Market Volume (2031) | 252.83 gigawatt |
| Growth Rate (2026 - 2031) | 4.99 % |
| Market Concentration | Medium |
Major Players *Disclaimer: Major Players sorted in no particular order Image © Mordor Intelligence. Reuse requires attribution under CC BY 4.0. | |
North America Wind Power Market Analysis by Mordor Intelligence
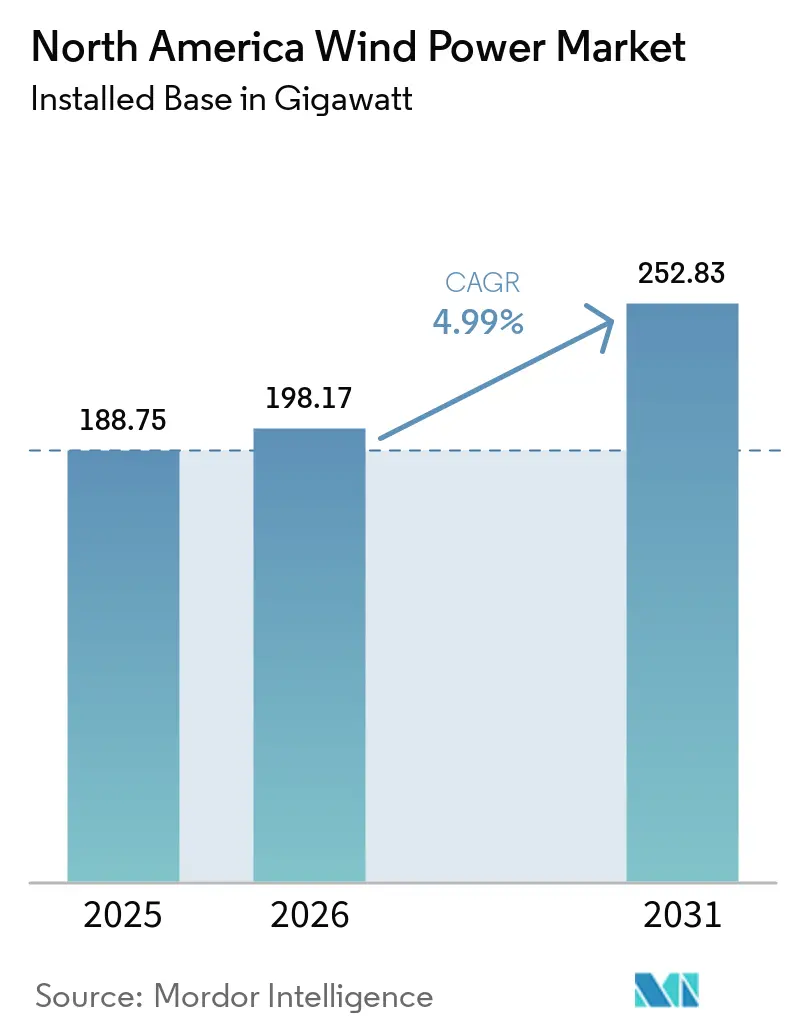
The North America Wind Power Market size is expected to grow from 188.75 gigawatt in 2025 to 198.17 gigawatt in 2026 and is forecast to reach 252.83 gigawatt by 2031 at 4.99% CAGR over 2026-2031.
The market size growth reflects a decisive regional shift toward renewables, enabled by supportive tax credits, rising corporate demand for clean electricity, and turbine technology gains that now place wind among the lowest-cost generation options.[1] Policy tailwinds offset regulatory uncertainty, while large-scale artificial-intelligence data-center buildouts and industrial electrification programs create unprecedented appetite for long-term wind power purchase agreements. Developers continue to navigate interconnection bottlenecks, yet the pipeline remains resilient as investors favor projects that qualify for Inflation Reduction Act (IRA) bonuses and domestic-content incentives. Combined, these forces position the North America wind power market as a core pillar of the region’s decarbonization roadmap.
Key Report Takeaways
- By location, onshore installations held 99.88% of the North America wind power market share in 2025, whereas offshore capacity is projected to advance at a 47.69% CAGR to 2031.
- By turbine capacity, the 3-6 MW class commanded 53.70% share of the North America wind power market size in 2025, while above-6 MW platforms are set to expand at a 9.98% CAGR through 2031.
- By application, utility-scale projects accounted for 91.10% of the North America wind power market size in 2025, and commercial-and-industrial sites are growing at a 8.65% CAGR to 2031.
- By geography, the United States led with 85.10% of the North America wind power market share in 2025; Mexico is poised for the fastest growth at 12.95% CAGR through 2031.
- NextEra Energy, Brookfield Renewable, and Ørsted collectively controlled 18% of regional installed capacity in 2024.
Note: Market size and forecast figures in this report are generated using Mordor Intelligence’s proprietary estimation framework, updated with the latest available data and insights as of 2026.
North America Wind Power Market Trends and Insights
Drivers Impact Analysis*
| Driver | (~) % Impact on CAGR Forecast | Geographic Relevance | Impact Timeline |
|---|---|---|---|
| Supportive government incentives & tax credits | +1.7% | North America-wide, strongest in US | Medium term (2-4 years) |
| Declining levelised cost of electricity (LCOE) | +1.1% | Global, with regional variations | Long term (≥ 4 years) |
| Corporate renewable-energy procurement mandates | +0.9% | US & Canada, concentrated in tech hubs | Medium term (2-4 years) |
| IRA domestic-content bonus & manufacturing build-out | +1.0% | United States primarily | Short term (≤ 2 years) |
| Surging AI/data-centre power demand driving long-term PPAs | +0.6% | US tech corridors, expanding to Canada | Long term (≥ 4 years) |
| Source: Mordor Intelligence | |||
IRA Domestic-Content Bonus & Manufacturing Build-Out
Hyperscale cloud providers now procure gigawatt-scale renewables to satisfy 24/7 carbon-free energy commitments. Microsoft’s 10.5 GW global framework with Brookfield Renewable sets a blueprint for virtual PPAs that guarantee revenue visibility for developers. Data-center clusters in Texas, Virginia, and Québec align wind output with consistent load profiles when paired with storage, improving project bankability within the North America wind power market. Willingness to sign 15- to 20-year contracts supports investment-grade financing, and the trend is spreading to semiconductor fabs and green-hydrogen producers.
Surging AI/Data-Center Power Demand Driving Long-Term PPAs
Hyperscale cloud providers now procure gigawatt-scale renewables to satisfy 24/7 carbon-free energy commitments. Microsoft’s 10.5 GW global framework with Brookfield Renewable sets a blueprint for virtual PPAs that guarantee revenue visibility for developers.[2] Data-center clusters in Texas, Virginia, and Québec align wind output with consistent load profiles when paired with storage, improving project bankability within the North America wind power market. Willingness to sign 15- to 20-year contracts supports investment-grade financing, and the trend is spreading to semiconductor fabs and green-hydrogen producers.
Corporate Renewable-Energy Procurement Mandates
Fortune 500 emissions targets have transformed renewable procurement from optional to essential. Renewable-energy-certificate prices jumped to nearly USD 8, prompting companies to pivot toward direct off-take agreements. Virtual PPAs now dominate transactions, allowing corporates to hedge electricity costs while claiming specific wind attributes. Expanded disclosure rules under the U.S. Securities and Exchange Commission intensify pressure to decarbonize scope 2 emissions, cementing wind as a primary solution within the North America wind power industry.
Declining Levelized Cost of Electricity (LCOE)
Advances in blade aerodynamics and taller hub heights have lifted capacity factors above 50% in premier wind corridors, delivering LCOEs that match or beat natural-gas combined-cycle plants.[3] Offshore fixed-bottom projects now post 40%-plus capacity factors, and floating prototypes confirm access to deeper resource zones. Economies of scale in 6-MW-plus turbines cut balance-of-plant costs, allowing the North America large wind turbine market to compete in merchant power markets without subsidies.
Restraints Impact Analysis*
| Restraint | (~) % Impact on CAGR Forecast | Geographic Relevance | Impact Timeline |
|---|---|---|---|
| Transmission queue bottlenecks & curtailment risk | -1.3% | MISO, SPP, ERCOT regions | Medium term (2-4 years) |
| Commodity & rare-earth supply-chain constraints | -0.7% | Global, affecting North America | Short term (≤ 2 years) |
| DoD radar & whale-migration litigation delaying projects | -0.6% | Coastal states, military installations | Short term (≤ 2 years) |
| Source: Mordor Intelligence | |||
Transmission Queue Bottlenecks & Curtailment Risk
More than 2,000 GW of renewables await grid studies, with MISO and SPP experiencing curtailment rates above 6% in 2024. FERC Order 1920 mandates 20-year planning horizons, yet reforms will not unblock capacity until the late 2020s. Developers must commit higher deposits earlier in the study process, straining small operators but reducing speculative filings. Cluster studies may expedite approvals, though congestion risks persist for the North America wind power market.[4]
DoD Radar & Whale-Migration Litigation Delaying Projects
Offshore leases face legal challenges linked to radar interference and marine-mammal protection. Seasonal construction pauses lengthen project schedules by 18 months or more, heightening carrying costs. The Department of Defense now collaborates with developers on radar-mitigation technologies, while environmental assessments incorporate adaptive management plans to reduce litigation exposure for the North America wind power market.[5]
*Our forecasts treat driver/restraint impacts as directional, not additive. The impact forecasts reflect baseline growth, mix effects, and variable interactions.
Segment Analysis
By Location: Offshore Acceleration Amid Onshore Maturity
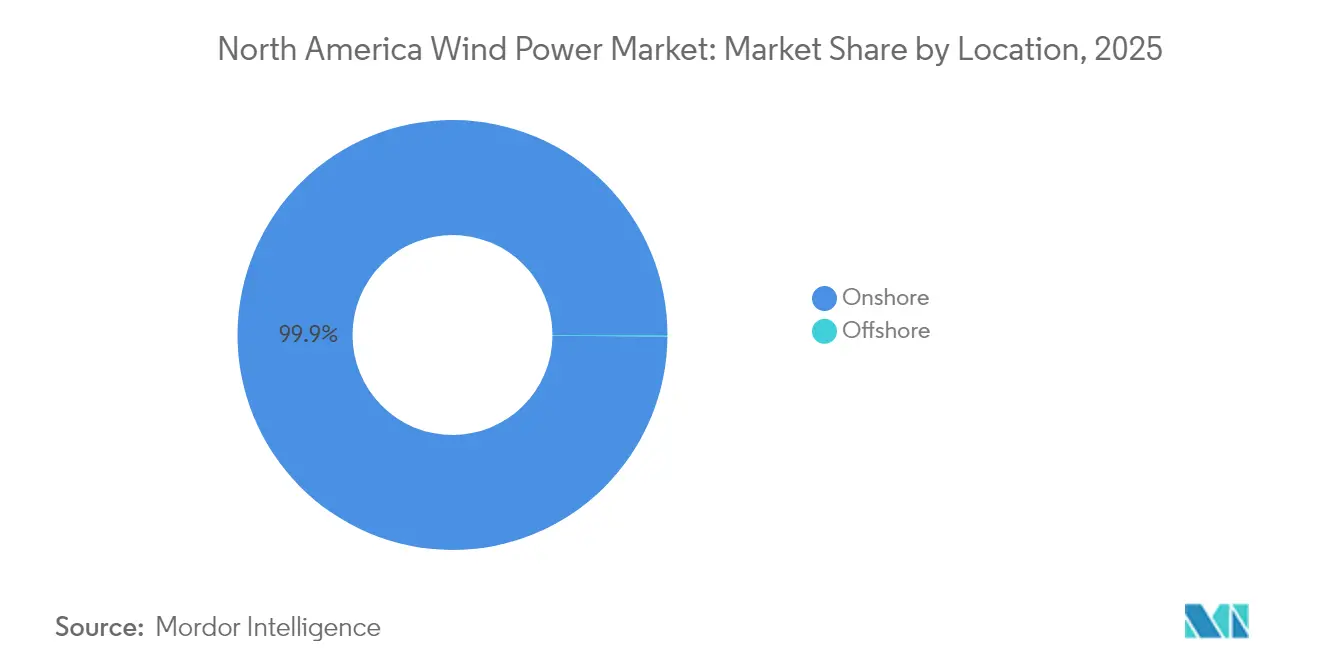
Onshore projects controlled 99.88% of installations in 2025, reflecting decades of streamlined permitting and cost-optimized supply chains across the Great Plains and Texas. Despite this dominance, offshore capacity is scaling rapidly, delivering a 47.69% CAGR to 2031 as Atlantic fixed-bottom farms reach commercial operations. Vineyard Wind and South Fork Wind showcased reliable 40%-plus capacity factors, narrowing cost gaps with onshore assets. State procurement mandates in New York and New Jersey support a 30 GW pipeline, providing visibility for vessel owners and component suppliers. Floating wind pilots in California and Nova Scotia target deeper-water zones, positioning the North America wind power market for another phase of growth beyond 2030.

By Turbine Capacity: Mid-Range Dominance with Large-Scale Migration
Turbines in the 3-6 MW range captured 53.70% of 2025 installations, balancing logistical practicality with competitive LCOE metrics. Over the forecast, developers pivot toward above-6 MW machines, which will record a 9.98% CAGR and supply both large onshore clusters and virtually all offshore plants. GE Vernova’s 2.4 GW SunZia order and Siemens Gamesa’s 21 MW prototype highlight a trajectory toward fewer, more powerful turbines that slash foundation counts and electrical-system costs. Sub-3 MW designs now serve primarily repowering niches.
By Application: Utility-Scale Dominance with C&I Emergence
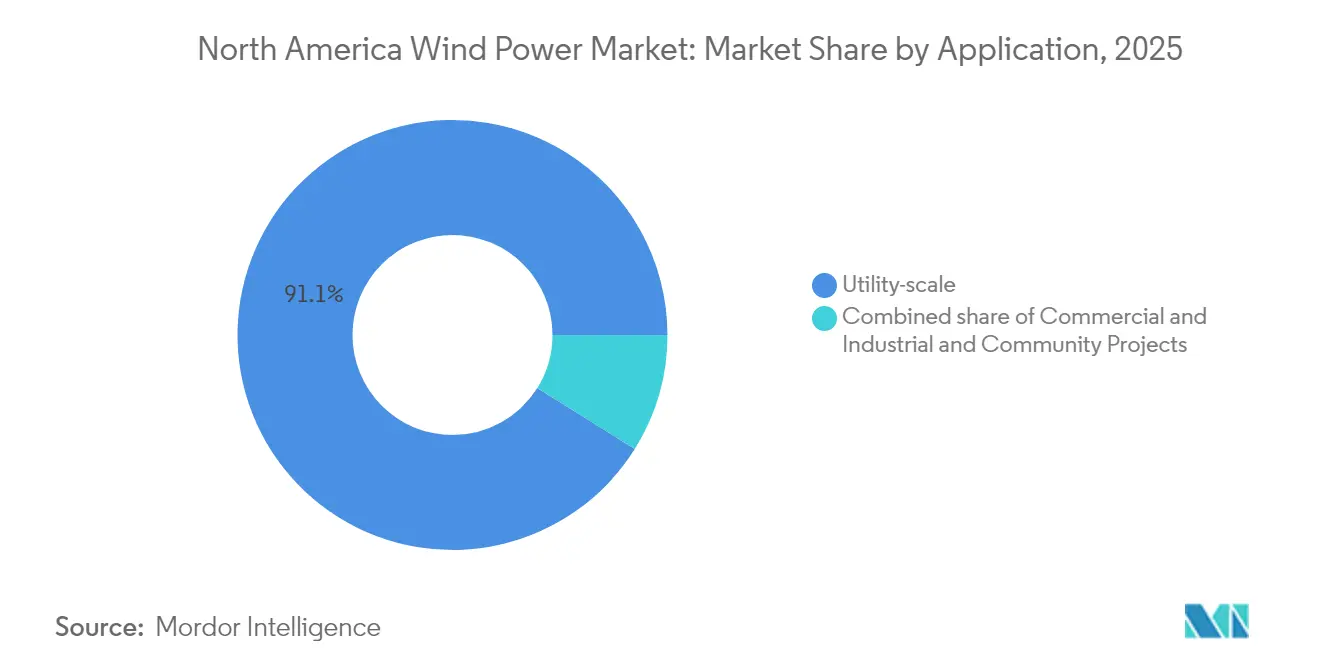
Utility-scale assets represented 91.10% of capacity in 2025, supported by competitive wholesale markets and capacity-market revenues. Hybrid wind-plus-storage projects are increasingly common, enabling firm dispatch and frequency regulation services valued by system operators. The commercial-and-industrial segment, while only 8.90% today, is expanding at 8.65% CAGR as corporates execute direct PPAs and onsite installations to hedge power costs and meet science-based targets. Community wind remains limited due to zoning hurdles and distributed solar competition, but offers social-license benefits in rural areas, enhancing acceptance of the North America wind power market.
Geography Analysis
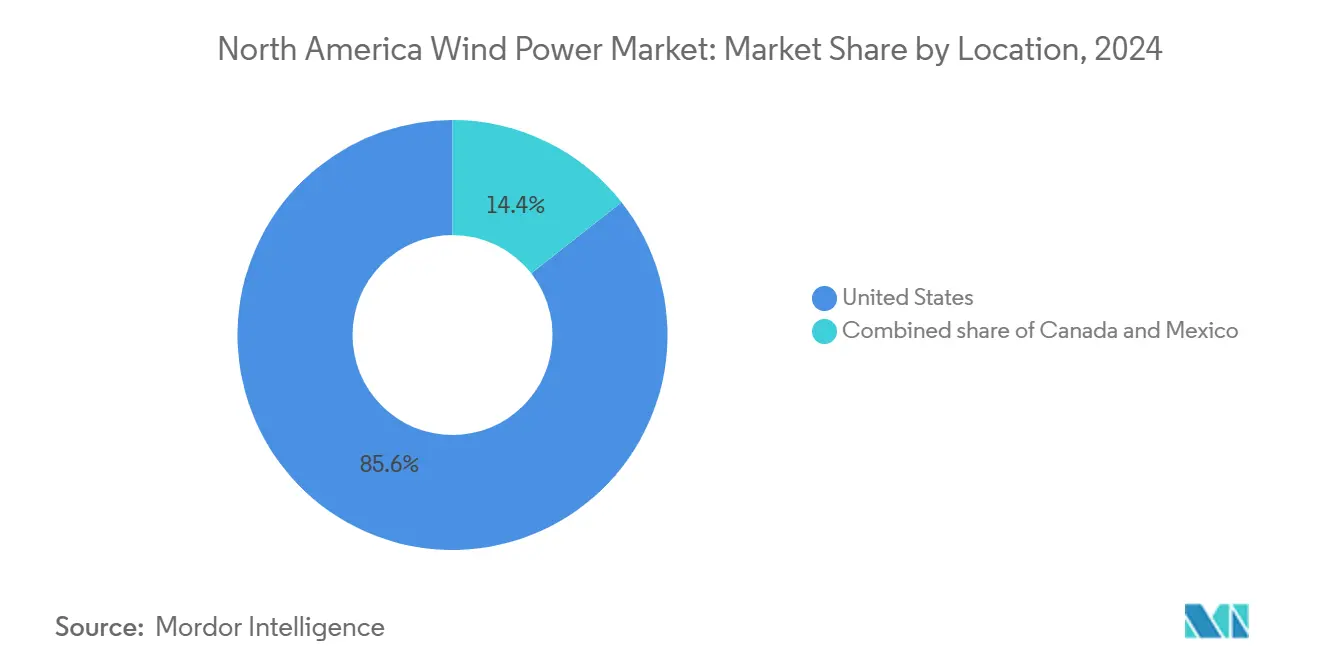
The United States accounted for 85.10% of total installations in 2025, led by Texas at more than 40 GW. Domestic-content rules spur new factories in the Midwest, shortening supply chains and qualifying projects for higher tax credits. ERCOT’s merchant market structure supports gigawatt-scale additions, although congestion in West Texas requires transmission upgrades.
Mexico, forecast to grow at a 12.95% CAGR, leverages the Isthmus of Tehuantepec’s robust wind regime and a USD 23 billion infrastructure program that features seven utility-scale wind farms. Near-shoring trends add industrial load in northern states, where developers secure long-term corporate offtake contracts. Canada’s 18 GW fleet spans Ontario, Québec, and Alberta, supported by provincial procurement schemes and Indigenous partnerships. Hydro-Québec’s 10 GW clean-energy plan and British Columbia’s fast-track permitting underline federal ambitions for a net-zero grid by 2050.
Regulatory Landscape
The regulatory environment for wind in North America is shaped by tax-credit mechanics, grid-market filings, and evolving offshore authorization frameworks. In the United States, the Federal Energy Regulatory Commission (FERC) continues to oversee wholesale market participation through docketed processes such as section 205(d) rate filings and market-based rate tariff updates, with multiple wind-related filings and comment windows published in 2026. Federal tax-credit administration also remains an anchor for project economics, with the 2026 renewable electricity production tax credit calculation (Section 45) published for eligible qualified resources including wind.
In Canada, offshore wind is moving into a clearer federal compliance structure via the Offshore Renewable Energy Regulations (SOR/2024-272), consolidated and current to May 26, 2026. These regulations set an offshore authorization process, including required application contents and plans (for example, safety and environmental protection plans) for offshore renewable energy wind projects and associated offshore power lines. Alongside the authorization framework, Natural Resources Canada programs such as the Offshore Wind Predevelopment Program support science-based predevelopment work and Indigenous and coastal-community engagement off Nova Scotia and Newfoundland and Labrador, helping align early-stage development with permitting readiness.
Competitive Landscape
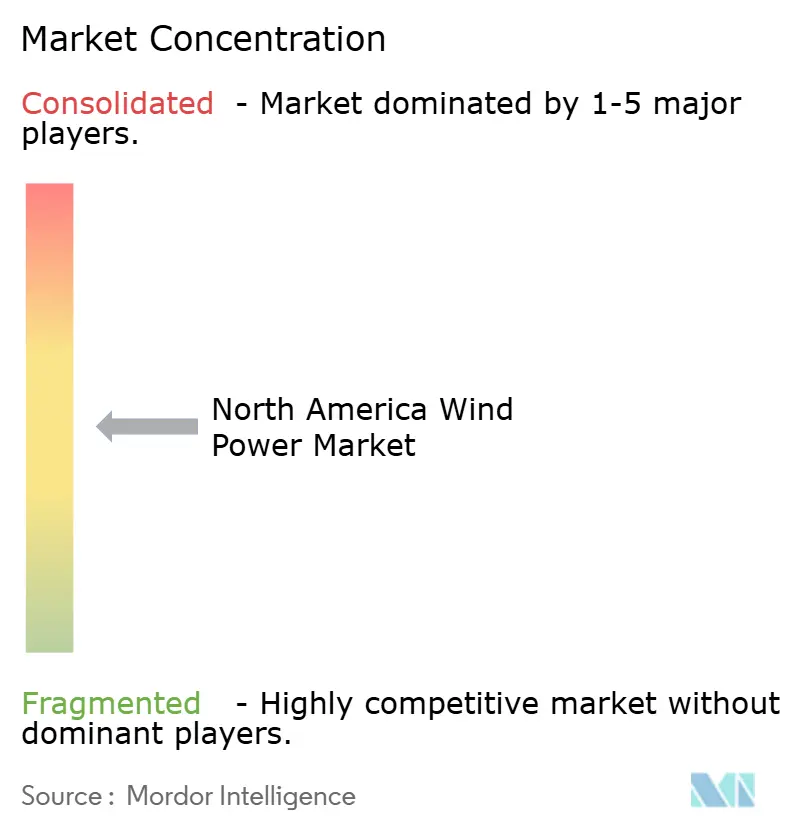
North America’s wind sector is moderately concentrated; the five largest owners controlled roughly 48% of operating capacity in 2024. NextEra Energy leads through integrated utility and development arms, announcing plans to repower 1.9 GW of legacy assets with modern turbines. Brookfield Renewable strengthened its presence by purchasing National Grid Renewables for USD 1.7 billion, adding 3 GW operating and 24 GW pipeline assets. Ørsted accelerates U.S. offshore development with supply-chain alliances that localize foundation and cable manufacture, mitigating Jones Act compliance risks.
Turbine makers such as Vestas and GE Vernova pursue service-oriented revenue streams, offering 20-year O&M packages backed by predictive analytics that enhance fleet availability. Market participants increasingly bundle wind, solar, and storage to sell dispatchable clean-energy blocks, differentiating their bids in competitive solicitations. Consolidation is expected to continue as capital-intensive transmission upgrades favor well-capitalized developers within the North America wind power market.
North America Wind Power Industry Leaders
-
Orsted AS
-
Duke Energy Corporation
-
NextEra Energy Inc.
-
Invenergy LLC
-
Pattern Energy Group LP
- *Disclaimer: Major Players sorted in no particular order
Market Opportunities and Future Outlook
Corporate and utility procurement structures continue to create whitespace for long-tenor contracted wind, especially where buyers are looking for price hedges and scope 2 decarbonization outcomes. Large, repeatable offtake frameworks such as Microsofts 10.5 GW global renewable energy framework with Brookfield Renewable illustrate the scale at which bankable virtual PPAs can be executed, and the same contracting approach is being replicated around major load additions such as data centers and electrifying industrial sites in Texas, Virginia, and Quebec. In the United States, onshore remains the near-term capacity backbone (99.88% share in 2025), while offshore activity is increasingly defined by projects moving into operations and fixed-price, long-duration utility agreements, as reflected in Revolution Wind delivering power into New Englands grid under 20-year fixed-price contracts.
Execution-focused opportunities are also emerging around grid integration and compliance-driven development pathways. Transmission planning reforms and queue discipline, including FERCs long-horizon planning direction (Order 1920) and ongoing market-based rate and market-power proceedings, are creating demand for developers and asset owners that can pair wind with storage, optimize congestion exposure, and manage interconnection timelines across ISOs such as MISO, SPP, and ERCOT. In Canada, the Offshore Renewable Energy Regulations and Natural Resources Canadas predevelopment work for offshore projects in the Atlantic provinces help make early offshore development more predictable, while provincial procurement schemes and Indigenous partnership models continue to shape bankable pipelines for onshore buildouts.
Recent Industry Developments
- June 2026: Duke Energy agreed to terminate its offshore wind lease in the Carolina Long Bay area through a settlement with the U.S. Department of the Interior and outlined reinvestment into alternative generation and grid infrastructure in the Carolinas. The agreement highlights how policy and permitting conditions can quickly reshape offshore wind portfolios and redirect capital toward onshore and grid-side priorities.
- April 2026: NextEra Energy Resources reported contracting 4 GW of new generation projects in Q1 2026, including about 0.5 GW of wind within the total. The contracting cadence reinforces the role of large developers with diversified pipelines in securing offtake and advancing utility-scale wind alongside solar and storage.
- March 2026: Orsted announced that its 704 MW Revolution Wind project began delivering power to New Englands electric grid under fixed-price 20-year agreements with utilities in Rhode Island and Connecticut. Delivering first power shifts offshore wind from construction risk to operational execution, supporting referenceability for future utility procurements and supply-chain commitments.
Research Methodology Framework and Report Scope
Market Definition and Coverage
For this study, the North America wind power market is defined as the total installed wind generation capacity connected to the grid across the United States, Canada, and Mexico, counted in gigawatts and tracked on a cumulative basis.
Scope exclusions: We exclude short term electricity prices, renewable energy certificate trading values, and purely planned projects that have not reached a defined construction or commissioning milestone.
Segmentation Overview
- By Location
- Onshore
- Offshore
- By Turbine Capacity
- Up to 3 MW
- 3 to 6 MW
- Above 6 MW
- By Application
- Utility-scale
- Commercial and Industrial
- Community Projects
- By Geography
- United States
- Canada
- Mexico
- By Component (Qualitative Analysis)
- Nacelle/Turbine
- Blade
- Tower
- Generator and Gearbox
- Balance-of-System
Data Sources, Market Sizing, and Validation
Desk Research
Desk work started by building a consistent installed capacity baseline for the United States, Canada, and Mexico, and then matching it to official time series. Key non-paywalled sources used included, such as the US Energy Information Administration, Natural Resources Canada, Mexico national energy statistics and ministry publications, and the International Energy Agency for common definitions and comparable indicators. We also referred to grid and system operator updates, plus public interconnection queue releases where available, to understand what is likely to connect in the near term.
Next, assumptions were tightened using public company filings and investor presentations, plus wind trade association websites and reputable press coverage of large awards, delays, and cancellations. A paid subscription for company financials and news was used to confirm ownership changes and project status updates, and a patent database was selectively used to sanity check technology direction, such as larger rotor designs, that can influence capacity additions over time. This desk source list is not exhaustive, and many other public documents were used to collect data, validate it, and clarify open questions.
Primary Interviews and Surveys
Primary work used expert interviews and structured surveys with developers, asset owners, EPC and procurement teams, and grid related specialists across North America, so key assumptions matched how projects are moving from pipeline to commissioning. We used this feedback to validate commissioning cadence, typical repowering triggers that change nameplate capacity, and the onshore versus offshore split by country, and then to confirm where permitting or supply constraints were most likely to shift the near term totals.
Distribution of primary research fieldwork respondents
| Company type | Respondent position |
|---|---|
| Top tier: 27% | CXOs: 19% |
| Mid tier: 52% | Functional/Unit leaders: 25% |
| Smaller Players: 21% | Managers: 56% |
Market-Sizing & Forecasting
Sizing is built using a top-down and bottom-up combination where official installed capacity series and annual commissioning additions are reconstructed by country, and then rolled up to a North America total. The totals are then checked with selective bottom-up approximations, such as sampling announced project pipelines, reviewing typical project sizes, and running channel checks on the share of repowering versus greenfield additions, which helps us adjust totals when they drift from what the market is signaling.
A few inputs that matter most include annual wind capacity additions (GW), retirements and repowering volumes, the offshore commissioning schedule, transmission availability signals, such as curtailment and congestion commentary, and policy timing that affects project start and completion. When data gaps appear, especially around early stage projects, we only count capacity after it clears a defined progress threshold, and then we use primary feedback to apply reasonable slippage factors for expected delays.
For forecasting, scenario analysis is used because wind buildouts are sensitive to permitting timelines, supply constraints, and grid readiness, not only long term targets. Assumptions on additions and repowering are aligned to expert consensus gathered in interviews, and then the country forecasts are summed to produce the regional outlook.
Data Validation & Update Cycle
Outputs are validated by comparing modeled totals against independent signals, such as published capacity totals, recent commissioning announcements, and the direction of grid connection activity. When a country total or growth rate looks unusual, the drivers are traced back to the input series, and then the assumption is reviewed again before sign-off, sometimes followed by a re-contact with an expert to confirm what changed.
Each report is refreshed annually, and interim updates are made when a material event occurs, such as a major policy shift, a large project cancellation, or a supply bottleneck that alters near term commissioning. Before delivery, an analyst performs a fresh pass so clients receive the latest updated view.
Mordor Intelligence's North America Wind Power Market Size Versus Other Published Estimates
Published market size numbers for North America wind power can look far apart, even when they appear to be discussing the same market. Most of the gap comes from different units of measure, differences in what is included in the counted universe, and how project timing is treated when pipelines shift.
Some external publications report the market in USD and can include turbine manufacturing, installation services, or broader wind industry revenue across the region. Mordor Intelligence counts cumulative installed wind power capacity in gigawatts for the United States, Canada, and Mexico, and additions are recognized only after they clear commissioning based checks.
Benchmark comparison
| Source | Market Size | Gaps in Research Methodology |
|---|---|---|
| Mordor Intelligence | USD 198.17 B (2026) | |
| Trade Journal A | USD 38.16 B (2025) | Uses a revenue-based USD view of the wind power industry, and it may be more focused on project and supply-chain spending rather than grid-connected installed capacity totals. |
| Global Consultancy A | USD 25.10 B (2024) | Tracks the wind turbine market in revenue terms, so the outcome can move with equipment pricing and delivery timing, and it may not fully reflect repowering-led nameplate capacity changes in the installed base. |
The spread is mainly explained by mixing capacity and revenue views, plus differences in whether installed base, new builds, or equipment sales are being counted. By keeping the unit consistent and tying additions to commissioning signals that can be cross-checked, the final number stays transparent and repeatable for decision-makers.
Key Questions Answered in the Report
How much installed wind capacity does North America have in 2026?
The region is expected to reach 198.17 GW of cumulative wind capacity by the end of 2026.
What is the forecast CAGR for wind additions through 2031?
The North America wind power market is projected to grow at a 4.99% CAGR between 2026 and 2031.
Which turbine class is growing fastest?
Turbines above 6 MW will expand at about 9.98% per year as developers favor higher output machines.
Why is offshore wind important for future growth?
Offshore projects show a 47.69% CAGR to 2031, unlocking vast coastal and deep-water resources and diversifying regional supply.
How are data centers influencing demand?
Hyperscale data-center operators are signing multi-gigawatt, 15- to 20-year power purchase agreements that underpin new project financing.
Which country will post the fastest growth rate?
Mexico leads with an expected 12.95% CAGR, driven by near-shoring-related industrial electricity demand and supportive infrastructure spending.