
| Study Period | 2017 - 2030 |
| Base Year For Estimation | 2024 |
| Forecast Data Period | 2025 - 2030 |
| Market Size (2025) | USD 1.13 Billion |
| Market Size (2030) | USD 1.46 Billion |
| CAGR (2025 - 2030) | 5.17 % |
| Market Concentration | Low |
Major Players*Disclaimer: Major Players sorted in no particular order |


North America Whey Protein Ingredients Market Analysis
The North America Whey Protein Ingredients Market size is estimated at 1.13 billion USD in 2025, and is expected to reach 1.46 billion USD by 2030, growing at a CAGR of 5.17% during the forecast period (2025-2030).
The North American whey protein market is experiencing significant transformation driven by evolving consumer preferences and health consciousness. Despite the rising vegan population, animal protein remains a dominant choice, with approximately 80% of US adult consumers in 2022 preferring traditional protein sources like pork, beef, poultry, and fish. This preference has encouraged manufacturers to focus on whey protein ingredients-enriched product development, particularly in functional foods and beverages. The industry has also witnessed substantial investments in processing intelligence and membrane technology, enabling manufacturers to produce higher-quality isolates while maintaining proteins in their native state.
Product innovation and clean-label trends continue to shape the industry landscape, with manufacturers focusing on developing natural and clean-label dairy ingredients. The growing obesity concerns, with about 36% of US consumers being obese in 2022, have prompted manufacturers to develop healthier alternatives. Major players are increasingly investing in research and development to create specialized formulations, particularly in areas like sports nutrition ingredients and functional foods. Companies are also incorporating pro-health ingredients and focusing on sugar reduction while maintaining protein content, responding to consumer demands for healthier options.
The industry is witnessing significant expansion in personal care and cosmetics applications, driven by increasing consumer spending on personal appearance products. In Mexico, the per capita consumption of cosmetics reached approximately USD 329 in 2022, reflecting the growing importance of this segment. This trend is further amplified by social media influence, with about 82% of consumers actively using social media platforms, driving demand for whey protein ingredients-enriched personal care products. Manufacturers are developing specialized whey protein formulations for skin care and hair care products, capitalizing on the ingredient's skin-hydrating and conditioning properties.
The North American whey protein market is characterized by significant consolidation and technological advancement in manufacturing capabilities. Leading manufacturers are investing in state-of-the-art facilities and implementing advanced monitoring systems that provide real-time data to improve operations. Companies are also focusing on sustainable practices and traceability, with many implementing comprehensive dairy efficiency programs and ethical procurement policies. The industry has seen notable expansion in production capacity, with several manufacturers announcing new facility constructions and expansions to meet growing demand while maintaining strict quality standards.
North America Whey Protein Ingredients Market Trends
Sport/performance nutrition to witness significant growth during the forecast period
- The North American plant protein-based sports nutrition market grew by 23.65% in value from 2016 to 2019. In 2020, it witnessed a steep decline of 3.35% in its Y-o-Y growth rate. This decline was attributed to gym closures due to lockdowns and COVID-19-related restrictions in major countries like the United States, Canada, and Mexico. For instance, health clubs, one of the common sales channels for supplements, impacted the sales of supplements adversely as the pandemic took a harsh toll on fitness club operators, employees, and consumers. In 2020, more than 17% of fitness facilities were permanently closed in the United States.
- North America is one of the world's leading sport and performance nutrition markets, owing to the increasing trend of athleticism and rising health awareness. The innovation of new flavors with health benefits is predicted to support the market growth by 18% during the forecast period (2023-2029). The increased consumers' proclivity to maintain nutrition boosts the demand for plant proteins. Fortified organic products also witnessed a growth of around 40% from 2019 to 2021.
- In North America, the demand for sports nutrition products is rising quickly from core users and consumers who lead active lifestyles. Light users consumed sports nutrition items focused on energy, weight control, muscle support, and healthy snacking. Sports supplements essential for muscular growth, strength performance, endurance, and recovery are mainly preferred by core or heavy users. For instance, in 2021, within the United States, 41.7% of users were consuming protein products, boosting plant protein sales as the preference for a plant-based diet increased by 27% from 2019 to 2020.

Understand The Key Trends Shaping This Market
Download PDF
Increasing dry whey production to stabilize whey protein prices during forecast period
- The United States is the major dry whey producing country in the region. Whey production is mainly driven by the supply from cheese production plants, accounting for most of the country's liquid whey production. As of April 2022, there were over 500 cheese production plants in the United States. Whey powder dominates the whey products market, closely followed by WPC. In 2021, around 934 million pounds of dry whey is produced in the country.
- Major companies are working toward securing additional whey plants. Sports and performance nutrition products drive strong growth in the high-end protein ingredients sector. WPC is produced by removing a certain percentage of non-protein constituents from pasteurized whey derived from cheese processing. The finished WPC products available for food aid are WPC34, which contains more than 34% whey protein, and WPC80, which includes more than 80% protein.
- In 2020, the overall whey production declined due to the pandemic because production plants had shut down across the nation. The production volume of dry whey was nearly 951 million pounds, down by 2.7%. The production volume of WPC was about 478 million pounds, down by 2.7% from that of 2019. On the contrary, production in milk plants witnessed a surge due to panic buying, which stabilized after April 2020. The production of dry whey for the animal feed sector is stable as prices remain unchanged. Although WPC production is stable, some market players expect higher prices for higher-concentration WPC in the next few quarters, which will likely positively impact production.

OTHER KEY INDUSTRY TRENDS COVERED IN THE REPORT
- Organic baby food is expected to drive the market in the future
- Fortified beverages are expected to witness a rise in sales during the forecast period
- An increase in the demand for single-serve packets may augment production
- Dairy alternatives are expected to witness a significant growth rate
- Great opportunities for meat alternative products
- Key players are focusing more on healthy ingredients post the COVID-19 pandemic
- The cosmetic industry to be driven by synergy of innovation and social media influence
- Large commercial players lead the growth of the bakery industry
- Consumer shift toward low-carb diets poses a threat to market growth
- Key players are expected to focus on fortification and nutritional enrichment
- The emphasis on awareness and innovation is one of the major growth drivers of the elderly nutrition market
- E-commerce is expected to emerge as one of the most preferred channels
- Steady demand from the United States to support market growth
- The consumption growth of animal protein is fueling opportunities for key players in the ingredients segment
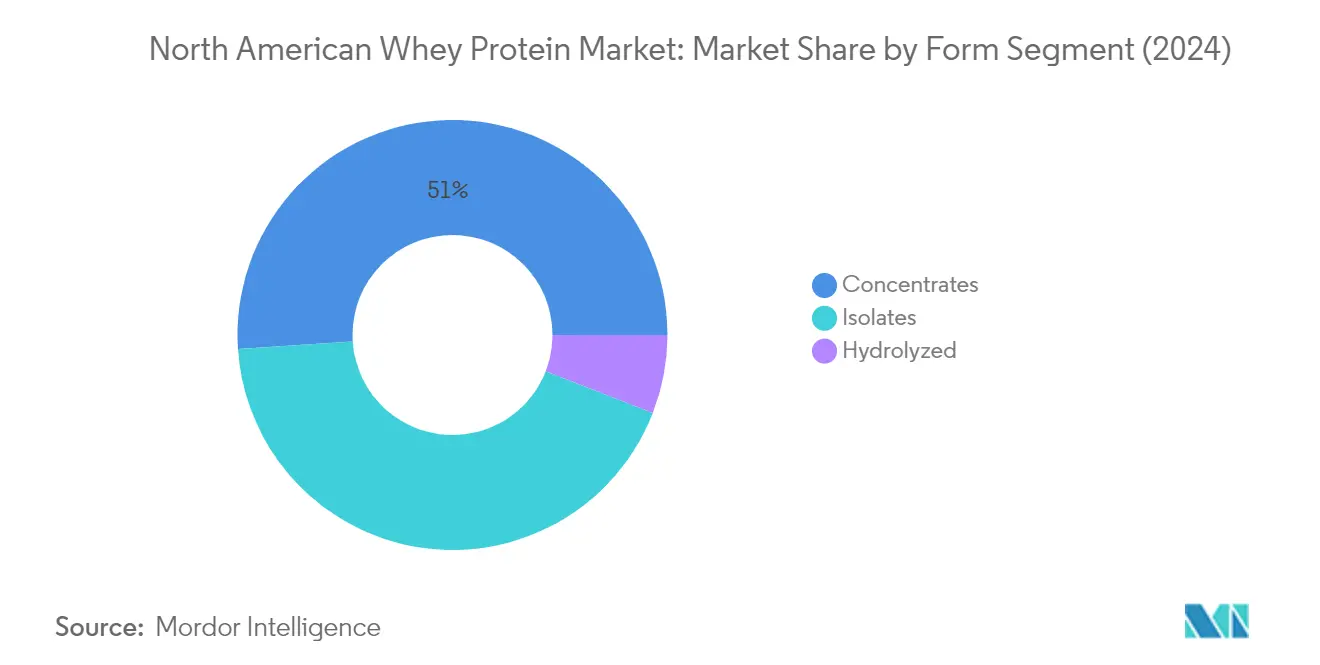
Segment Analysis: Form
Concentrates Segment in North American Whey Protein Market
Whey protein concentrates dominate the North American market, holding approximately 51% market share in 2024, driven by their cost-effectiveness and versatile application profile. This segment's prominence is attributed to its lower production costs compared to other forms, making it approximately 8-10% cheaper than isolates and hydrolysates. The concentrates segment particularly excels in the food and beverage industry, with significant applications in snacks and dairy products, accounting for nearly 59% and 26% of the segment, respectively. WPC's superior functional properties, including water retention, gelling capabilities, and solubility of up to 78%, make it particularly attractive for manufacturers. The segment's growth is further supported by the rising demand for protein-fortified foods and beverages, with manufacturers increasingly incorporating WPC into various products due to its optimal nutritional profile and cost-effectiveness.
Hydrolyzed Segment in North American Whey Protein Market
The whey protein hydrolysate segment is projected to exhibit the strongest growth trajectory, with an expected CAGR of approximately 7% during 2024-2029. This accelerated growth is primarily driven by its enhanced digestibility and faster absorption properties, making it particularly valuable for medical nutrition and sports recovery applications. The segment's expansion is supported by increasing consumer awareness about the benefits of pre-digested proteins, especially among individuals with digestive sensitivities. Hydrolyzed whey protein's ability to be absorbed at a rate of 13-18 grams per hour, significantly higher than standard proteins, makes it particularly attractive for the sports nutrition sector. The segment is also gaining traction in the medical nutrition field, where its pre-digested structure makes it ideal for patients with compromised digestive systems.
Remaining Segments in Form Segmentation
The whey protein isolate segment represents a significant portion of the North American whey protein market, characterized by its high protein content and minimal fat and lactose composition. Whey protein isolates are particularly valued in the premium product category, offering superior nutritional profiles with protein content exceeding 90% per serving. This segment has established a strong presence in the beverages and sports nutrition sectors, where its clean taste profile and excellent solubility make it ideal for clear protein drinks and premium supplements. The segment's growth is supported by increasing consumer demand for pure protein products, particularly among health-conscious consumers and athletes requiring high-protein, low-carbohydrate options.
Segment Analysis: End User
Supplements Segment in North America Whey Protein Market
The supplements segment has established itself as the dominant force in the North American whey protein market, commanding approximately 50% of the total market value in 2024. This segment's prominence is primarily driven by the robust demand from sports nutrition applications, where whey protein serves as a crucial ingredient for muscle development and recovery. The segment's growth is further bolstered by the expanding athlete base across the region, particularly in Canada and the United States, where fitness consciousness and professional sports activities continue to rise. Additionally, the segment is experiencing the fastest growth trajectory, projected to expand at approximately 7% during 2024-2029, driven by increasing consumer awareness about ingredients in protein supplements, rising health consciousness, and the growing popularity of personalized nutrition plans among fitness enthusiasts.
Remaining Segments in End User Segmentation
The food and beverages segment represents the second-largest end-user category, with applications spanning various sub-segments, including snacks, beverages, dairy products, and bakery items. The segment's growth is driven by the increasing incorporation of whey protein in functional foods and fortified beverages. The animal feed segment maintains a steady presence in the market, primarily serving the livestock and pet food industries with protein-enriched feed formulations. The personal care and cosmetics segment, while smaller in market share, is gaining traction due to the growing recognition of whey protein's benefits in skincare and haircare products, with manufacturers increasingly incorporating these ingredients in premium personal care formulations. Additionally, the use of ingredients from milk proteins in these segments is becoming more prevalent, enhancing product appeal.
North America Whey Protein Ingredients Market Geography Segment Analysis
Whey Protein Market in the United States
The whey protein market in the US dominates the North American whey protein market, commanding approximately 86% of the total market value in 2024. The market's robust performance is primarily driven by the food and beverage segment, particularly in applications like protein-based snack bars and functional beverages. The country's extensive network of cheese production facilities ensures a steady supply of whey, while the consolidation of production by major players has resulted in competitive pricing and improved accessibility. The presence of numerous health and fitness centers actively promoting sports nutrition products has significantly contributed to market growth. The market is further strengthened by the rising consumer awareness about health and wellness, particularly among the youth population involved in fitness activities. The country's advanced research and development capabilities have enabled manufacturers to introduce innovative whey protein formulations, catering to specific consumer needs such as clean label products and specialized sports nutrition solutions.
Whey Protein Market in Mexico
Mexico stands out as the most dynamic market in the North American region, projected to grow at approximately 6% CAGR from 2024 to 2029. The country's whey protein market is experiencing rapid evolution, driven by increasing health consciousness and growing demand for functional food products. The personal care and cosmetics segment has emerged as a significant growth driver, supported by the rising number of beauty clinics and increasing per capita expenditure on personal care products. Mexican consumers are increasingly embracing whey protein products, particularly in the sports nutrition segment, as awareness about fitness and healthy lifestyle choices continues to rise. The beverage industry has become a key application area, with manufacturers incorporating whey protein in various functional drinks. The market is also benefiting from the country's expanding food processing sector, where whey protein is increasingly used in bakery products, snacks, and dairy alternatives. Local manufacturers are focusing on developing affordable whey protein products to cater to the price-sensitive consumer base while maintaining quality standards.
Whey Protein Market in Canada
Canada's whey protein market demonstrates strong fundamentals, supported by the country's well-established dairy industry and growing consumer preference for protein-enriched products. The supplements segment, particularly sports nutrition, has emerged as a key growth driver, reflecting the increasing number of fitness enthusiasts and health-conscious consumers. Canadian manufacturers are actively investing in research and development to create innovative whey protein formulations, especially targeting the elderly nutrition segment with specialized products. The market is characterized by a strong emphasis on premium and organic products, aligning with Canadian consumers' preference for high-quality, clean-label ingredients. The country's robust regulatory framework and stringent quality standards have helped establish trust among consumers, leading to increased adoption of whey protein products. The market also benefits from Canada's advanced food processing capabilities and strong distribution networks, ensuring widespread product availability across various retail channels.
Whey Protein Market in Other Countries
The whey protein market in other North American countries, including Greenland, Jamaica, Cuba, Panama, Costa Rica, and Guatemala, exhibits diverse growth patterns influenced by local dietary preferences and economic conditions. These markets are characterized by growing awareness of protein-enriched products and increasing health consciousness among consumers. The food and beverage sector serves as the primary growth driver, with particular emphasis on snacks and beverages. The sports nutrition segment is gradually gaining traction, especially in urban areas where fitness culture is becoming more prevalent. Local manufacturers are adapting their strategies to meet specific regional preferences while maintaining competitive pricing. The market in these countries benefits from improving distribution networks and increasing exposure to international brands, though growth patterns vary significantly based on local economic conditions and consumer purchasing power.
Get Analysis on Important Geographic Markets
Download PDF
North America Whey Protein Ingredients Industry Overview
Top Companies in North American Whey Protein Market
The North American whey protein market is characterized by companies focusing heavily on product innovation and development strategies to maintain their competitive edge. Major players are consistently expanding their product portfolios through the introduction of new whey protein ingredients variants, particularly in specialized categories like sports nutrition and infant formula ingredients. Operational agility has become crucial, with companies investing in advanced manufacturing technologies and establishing strategic partnerships to ensure stable supply chains. Many players are pursuing geographical expansion through new facility construction and capacity enhancement projects, particularly in the United States and Canada. The industry has also witnessed a significant trend toward sustainability initiatives, with companies implementing environmentally conscious production processes and developing clean-label products to meet evolving consumer preferences.
Fragmented Market with Strong Global Players
The competitive landscape is characterized by a mix of global dairy conglomerates and specialized protein ingredient manufacturers, with companies like Glanbia PLC, Fonterra, and FrieslandCampina holding significant market positions. These established players leverage their extensive distribution networks, research capabilities, and vertical integration to maintain their market dominance. The market structure shows moderate fragmentation, with regional players maintaining strong positions in specific geographic areas or product segments, particularly in specialized whey protein formulations for specific applications.
The industry has witnessed considerable merger and acquisition activity, primarily driven by larger companies seeking to expand their product portfolios and geographic reach. Global players are actively acquiring regional manufacturers to strengthen their presence in key markets and gain access to established distribution channels. Strategic partnerships between dairy cooperatives and protein manufacturers have become increasingly common, allowing companies to share resources, technology, and expertise while maintaining competitive advantages in specific market segments.
Innovation and Sustainability Drive Future Success
For incumbent companies to maintain and expand their market share, focusing on product differentiation through innovative formulations and applications will be crucial. Success factors include developing specialized protein variants for emerging applications, investing in sustainable production methods, and strengthening relationships with key end-user industries. Companies must also focus on vertical integration and supply chain optimization to ensure consistent quality and cost competitiveness while addressing growing consumer demands for transparency and traceability in protein sourcing.
New entrants and challenger brands can gain ground by focusing on niche market segments and developing specialized products for specific applications or consumer groups. Success will depend on building strong relationships with local dairy suppliers, investing in efficient processing technologies, and developing innovative marketing strategies to differentiate their offerings. Companies must also prepare for potential regulatory changes regarding protein content claims and labeling requirements, while maintaining flexibility to adapt to shifting consumer preferences and potential substitution risks from plant-based alternatives. The focus on protein supplement ingredients and dairy ingredients will be pivotal in addressing these market dynamics.
North America Whey Protein Ingredients Market Leaders
-
Arla Foods amba
-
Fonterra Co-operative Group Limited
-
FrieslandCampina Ingredients
-
Glanbia PLC
-
Groupe Lactalis
- *Disclaimer: Major Players sorted in no particular order

Need More Details on Market Players and Competiters?
Download PDF
North America Whey Protein Ingredients Market News
- August 2022: Optimum Nutrition announced the launch of its new Gold Standard Protein Shake. The RTD is available in chocolate and vanilla flavors and is formulated with 24 grams of protein per serving.
- June 2022: Fonterra JV entered a joint venture with Tillamook County Creamery Association (TCCA) and a three-mile canyon farm in the United States to launch Pro-Optima TM, a grade A functional whey protein concentrate (fWPC).
- November 2021: At the Food ingredient Europe 2021, FrieslandCampina Ingredients exhibited 45D, its fortified protein water concept containing Nutri Whey Isolate Clear, in the New Product Zone.
Free With This Report
We provide a comprehensive and exhaustive set of data pointers for global, regional, and country-level metrics that illustrate the fundamentals of the protein industry. With the help of 45+ free charts, clients can access in-depth market analysis based on per capita consumption of animal and plant protein, end-user market volume, and production data of raw materials for protein ingredients, through granular-level segmental information supported by a repository of market data, trends, and expert analysis. Data and analysis on protein sources, protein types, forms, end-user segments, etc., are available in the form of comprehensive reports as well as Excel-based data worksheets.


North America Whey Protein Ingredients Market Report - Table of Contents
1. EXECUTIVE SUMMARY & KEY FINDINGS
2. INTRODUCTION
- 2.1 Study Assumptions & Market Definition
- 2.2 Scope of the Study
- 2.3 Research Methodology
3. KEY INDUSTRY TRENDS
-
3.1 End User Market Volume
- 3.1.1 Baby Food and Infant Formula
- 3.1.2 Bakery
- 3.1.3 Beverages
- 3.1.4 Breakfast Cereals
- 3.1.5 Condiments/Sauces
- 3.1.6 Confectionery
- 3.1.7 Dairy and Dairy Alternative Products
- 3.1.8 Elderly Nutrition and Medical Nutrition
- 3.1.9 Meat/Poultry/Seafood and Meat Alternative Products
- 3.1.10 RTE/RTC Food Products
- 3.1.11 Snacks
- 3.1.12 Sport/Performance Nutrition
- 3.1.13 Animal Feed
- 3.1.14 Personal Care and Cosmetics
-
3.2 Protein Consumption Trends
- 3.2.1 Animal
-
3.3 Production Trends
- 3.3.1 Animal
-
3.4 Regulatory Framework
- 3.4.1 Canada
- 3.4.2 United States
- 3.5 Value Chain & Distribution Channel Analysis
4. MARKET SEGMENTATION (includes market size in Value in USD and Volume, Forecasts up to 2030 and analysis of growth prospects)
-
4.1 Form
- 4.1.1 Concentrates
- 4.1.2 Hydrolyzed
- 4.1.3 Isolates
-
4.2 End User
- 4.2.1 Animal Feed
- 4.2.2 Food and Beverages
- 4.2.2.1 By Sub End User
- 4.2.2.1.1 Bakery
- 4.2.2.1.2 Beverages
- 4.2.2.1.3 Breakfast Cereals
- 4.2.2.1.4 Condiments/Sauces
- 4.2.2.1.5 Dairy and Dairy Alternative Products
- 4.2.2.1.6 RTE/RTC Food Products
- 4.2.2.1.7 Snacks
- 4.2.3 Personal Care and Cosmetics
- 4.2.4 Supplements
- 4.2.4.1 By Sub End User
- 4.2.4.1.1 Baby Food and Infant Formula
- 4.2.4.1.2 Elderly Nutrition and Medical Nutrition
- 4.2.4.1.3 Sport/Performance Nutrition
-
4.3 Country
- 4.3.1 Canada
- 4.3.2 Mexico
- 4.3.3 United States
- 4.3.4 Rest of North America
5. COMPETITIVE LANDSCAPE
- 5.1 Key Strategic Moves
- 5.2 Market Share Analysis
- 5.3 Company Landscape
-
5.4 Company Profiles (includes Global Level Overview, Market Level Overview, Core Business Segments, Financials, Headcount, Key Information, Market Rank, Market Share, Products and Services, and Analysis of Recent Developments).
- 5.4.1 Agropur Dairy Cooperative
- 5.4.2 Arla Foods amba
- 5.4.3 Carbery Food Ingredients Limited
- 5.4.4 Cooke Inc.
- 5.4.5 Fonterra Co-operative Group Limited
- 5.4.6 FrieslandCampina Ingredients
- 5.4.7 Glanbia PLC
- 5.4.8 Groupe Lactalis
- 5.4.9 Hilmar Cheese Company Inc.
- 5.4.10 Milk Specialties Global
- 5.4.11 Saputo Inc.
6. KEY STRATEGIC QUESTIONS FOR PROTEIN INGREDIENTS INDUSTRY CEOS
7. APPENDIX
-
7.1 Global Overview
- 7.1.1 Overview
- 7.1.2 Porter’s Five Forces Framework
- 7.1.3 Global Value Chain Analysis
- 7.1.4 Market Dynamics (DROs)
- 7.2 Sources & References
- 7.3 List of Tables & Figures
- 7.4 Primary Insights
- 7.5 Data Pack
- 7.6 Glossary of Terms
You Can Purchase Parts Of This Report. Check Out Prices For Specific Sections
Get Price Break-up Now
List of Tables & Figures
- Figure 1:
- VOLUME OF BABY FOOD AND INFANT FORMULA MARKET, METRIC TON, NORTH AMERICA, 2017 - 2029
- Figure 2:
- VOLUME OF BAKERY MARKET, METRIC TON, NORTH AMERICA, 2017 - 2029
- Figure 3:
- VOLUME OF BEVERAGES MARKET, METRIC TON, NORTH AMERICA, 2017 - 2029
- Figure 4:
- VOLUME OF BREAKFAST CEREALS MARKET, METRIC TON, NORTH AMERICA, 2017 - 2029
- Figure 5:
- VOLUME OF CONDIMENTS/SAUCES MARKET, METRIC TON, NORTH AMERICA, 2017 - 2029
- Figure 6:
- VOLUME OF CONFECTIONERY MARKET, METRIC TON, NORTH AMERICA, 2017 - 2029
- Figure 7:
- VOLUME OF DAIRY AND DAIRY ALTERNATIVE PRODUCTS MARKET, METRIC TON, NORTH AMERICA, 2017 - 2029
- Figure 8:
- VOLUME OF ELDERLY NUTRITION AND MEDICAL NUTRITION MARKET, METRIC TON, NORTH AMERICA, 2017 - 2029
- Figure 9:
- VOLUME OF MEAT/POULTRY/SEAFOOD AND MEAT ALTERNATIVE PRODUCTS MARKET, METRIC TON, NORTH AMERICA, 2017 - 2029
- Figure 10:
- VOLUME OF RTE/RTC FOOD PRODUCTS MARKET, METRIC TON, NORTH AMERICA, 2017 - 2029
- Figure 11:
- VOLUME OF SNACKS MARKET, METRIC TON, NORTH AMERICA, 2017 - 2029
- Figure 12:
- VOLUME OF SPORT/PERFORMANCE NUTRITION MARKET, METRIC TON, NORTH AMERICA, 2017 - 2029
- Figure 13:
- VOLUME OF ANIMAL FEED MARKET, METRIC TON, NORTH AMERICA, 2017 - 2029
- Figure 14:
- VOLUME OF PERSONAL CARE AND COSMETICS MARKET, METRIC TON, NORTH AMERICA, 2017 - 2029
- Figure 15:
- AVERAGE PER CAPITA CONSUMPTION OF ANIMAL PROTEIN, GRAM PER DAY, NORTH AMERICA, 2017 - 2029
- Figure 16:
- DRY WHEY PRODUCTION, METRIC TON, NORTH AMERICA, 2017 - 2022
- Figure 17:
- VOLUME OF WHEY PROTEIN MARKET, TONNES, NORTH AMERICA, 2017 - 2029
- Figure 18:
- VALUE OF WHEY PROTEIN MARKET, USD, NORTH AMERICA, 2017 - 2029
- Figure 19:
- VOLUME OF WHEY PROTEIN MARKET BY FORM, METRIC TONNES, NORTH AMERICA, 2017 - 2029
- Figure 20:
- VALUE OF WHEY PROTEIN MARKET BY FORM, USD, NORTH AMERICA, 2017 - 2029
- Figure 21:
- VALUE SHARE OF WHEY PROTEIN MARKET BY FORM, %, NORTH AMERICA, 2017 VS 2023 VS 2029
- Figure 22:
- VOLUME SHARE OF WHEY PROTEIN MARKET BY FORM, %, NORTH AMERICA, 2017 VS 2023 VS 2029
- Figure 23:
- VOLUME OF WHEY PROTEIN MARKET, CONCENTRATES, METRIC TONNES, NORTH AMERICA, 2017 - 2029
- Figure 24:
- VALUE OF WHEY PROTEIN MARKET, CONCENTRATES, USD, NORTH AMERICA, 2017 - 2029
- Figure 25:
- VALUE SHARE OF WHEY PROTEIN MARKET BY END USER, % CONCENTRATES , NORTH AMERICA, 2022 VS 2029
- Figure 26:
- VOLUME OF WHEY PROTEIN MARKET, HYDROLYZED, METRIC TONNES, NORTH AMERICA, 2017 - 2029
- Figure 27:
- VALUE OF WHEY PROTEIN MARKET, HYDROLYZED, USD, NORTH AMERICA, 2017 - 2029
- Figure 28:
- VALUE SHARE OF WHEY PROTEIN MARKET BY END USER, % HYDROLYZED , NORTH AMERICA, 2022 VS 2029
- Figure 29:
- VOLUME OF WHEY PROTEIN MARKET, ISOLATES, METRIC TONNES, NORTH AMERICA, 2017 - 2029
- Figure 30:
- VALUE OF WHEY PROTEIN MARKET, ISOLATES, USD, NORTH AMERICA, 2017 - 2029
- Figure 31:
- VALUE SHARE OF WHEY PROTEIN MARKET BY END USER, % ISOLATES , NORTH AMERICA, 2022 VS 2029
- Figure 32:
- VOLUME OF WHEY PROTEIN MARKET BY END USER, METRIC TONNES, NORTH AMERICA, 2017 - 2029
- Figure 33:
- VALUE OF WHEY PROTEIN MARKET BY END USER, USD, NORTH AMERICA, 2017 - 2029
- Figure 34:
- VALUE SHARE OF WHEY PROTEIN MARKET BY END USER, %, NORTH AMERICA, 2017 VS 2023 VS 2029
- Figure 35:
- VOLUME SHARE OF WHEY PROTEIN MARKET BY END USER, %, NORTH AMERICA, 2017 VS 2023 VS 2029
- Figure 36:
- VOLUME OF WHEY PROTEIN MARKET, ANIMAL FEED, NORTH AMERICA, 2017 - 2029
- Figure 37:
- VALUE OF WHEY PROTEIN MARKET, ANIMAL FEED, NORTH AMERICA, 2017 - 2029
- Figure 38:
- VALUE SHARE OF WHEY PROTEIN MARKET BY FORM, % ANIMAL FEED , NORTH AMERICA, 2022 VS 2029
- Figure 39:
- VOLUME OF WHEY PROTEIN MARKET, FOOD AND BEVERAGES END USER, METRIC TONNES, NORTH AMERICA, 2017 - 2029
- Figure 40:
- VALUE OF WHEY PROTEIN MARKET, FOOD AND BEVERAGES END USER, USD, NORTH AMERICA, 2017 - 2029
- Figure 41:
- VALUE SHARE OF WHEY PROTEIN MARKET BY FOOD AND BEVERAGES END USER, %, NORTH AMERICA, 2017 VS 2023 VS 2029
- Figure 42:
- VOLUME SHARE OF WHEY PROTEIN MARKET BY FOOD AND BEVERAGES END USER, %, NORTH AMERICA, 2017 VS 2023 VS 2029
- Figure 43:
- VOLUME OF WHEY PROTEIN MARKET, BAKERY, METRIC TONNES, NORTH AMERICA, 2017 - 2029
- Figure 44:
- VALUE OF WHEY PROTEIN MARKET, BAKERY, USD, NORTH AMERICA, 2017 - 2029
- Figure 45:
- VALUE SHARE OF WHEY PROTEIN MARKET BY FORM, % BAKERY , NORTH AMERICA, 2022 VS 2029
- Figure 46:
- VOLUME OF WHEY PROTEIN MARKET, BEVERAGES, METRIC TONNES, NORTH AMERICA, 2017 - 2029
- Figure 47:
- VALUE OF WHEY PROTEIN MARKET, BEVERAGES, USD, NORTH AMERICA, 2017 - 2029
- Figure 48:
- VALUE SHARE OF WHEY PROTEIN MARKET BY FORM, % BEVERAGES , NORTH AMERICA, 2022 VS 2029
- Figure 49:
- VOLUME OF WHEY PROTEIN MARKET, BREAKFAST CEREALS, METRIC TONNES, NORTH AMERICA, 2017 - 2029
- Figure 50:
- VALUE OF WHEY PROTEIN MARKET, BREAKFAST CEREALS, USD, NORTH AMERICA, 2017 - 2029
- Figure 51:
- VALUE SHARE OF WHEY PROTEIN MARKET BY FORM, % BREAKFAST CEREALS , NORTH AMERICA, 2022 VS 2029
- Figure 52:
- VOLUME OF WHEY PROTEIN MARKET, CONDIMENTS/SAUCES, METRIC TONNES, NORTH AMERICA, 2017 - 2029
- Figure 53:
- VALUE OF WHEY PROTEIN MARKET, CONDIMENTS/SAUCES, USD, NORTH AMERICA, 2017 - 2029
- Figure 54:
- VALUE SHARE OF WHEY PROTEIN MARKET BY FORM, % CONDIMENTS/SAUCES , NORTH AMERICA, 2022 VS 2029
- Figure 55:
- VOLUME OF WHEY PROTEIN MARKET, DAIRY AND DAIRY ALTERNATIVE PRODUCTS, METRIC TONNES, NORTH AMERICA, 2017 - 2029
- Figure 56:
- VALUE OF WHEY PROTEIN MARKET, DAIRY AND DAIRY ALTERNATIVE PRODUCTS, USD, NORTH AMERICA, 2017 - 2029
- Figure 57:
- VALUE SHARE OF WHEY PROTEIN MARKET BY FORM, % DAIRY AND DAIRY ALTERNATIVE PRODUCTS , NORTH AMERICA, 2022 VS 2029
- Figure 58:
- VOLUME OF WHEY PROTEIN MARKET, RTE/RTC FOOD PRODUCTS, METRIC TONNES, NORTH AMERICA, 2017 - 2029
- Figure 59:
- VALUE OF WHEY PROTEIN MARKET, RTE/RTC FOOD PRODUCTS, USD, NORTH AMERICA, 2017 - 2029
- Figure 60:
- VALUE SHARE OF WHEY PROTEIN MARKET BY FORM, % RTE/RTC FOOD PRODUCTS , NORTH AMERICA, 2022 VS 2029
- Figure 61:
- VOLUME OF WHEY PROTEIN MARKET, SNACKS, METRIC TONNES, NORTH AMERICA, 2017 - 2029
- Figure 62:
- VALUE OF WHEY PROTEIN MARKET, SNACKS, USD, NORTH AMERICA, 2017 - 2029
- Figure 63:
- VALUE SHARE OF WHEY PROTEIN MARKET BY FORM, % SNACKS , NORTH AMERICA, 2022 VS 2029
- Figure 64:
- VOLUME OF WHEY PROTEIN MARKET, PERSONAL CARE AND COSMETICS, NORTH AMERICA, 2017 - 2029
- Figure 65:
- VALUE OF WHEY PROTEIN MARKET, PERSONAL CARE AND COSMETICS, NORTH AMERICA, 2017 - 2029
- Figure 66:
- VALUE SHARE OF WHEY PROTEIN MARKET BY FORM, % PERSONAL CARE AND COSMETICS , NORTH AMERICA, 2022 VS 2029
- Figure 67:
- VOLUME OF WHEY PROTEIN MARKET, SUPPLEMENTS END USER, METRIC TONNES, NORTH AMERICA, 2017 - 2029
- Figure 68:
- VALUE OF WHEY PROTEIN MARKET, SUPPLEMENTS END USER, USD, NORTH AMERICA, 2017 - 2029
- Figure 69:
- VALUE SHARE OF WHEY PROTEIN MARKET BY SUPPLEMENTS END USER, %, NORTH AMERICA, 2017 VS 2023 VS 2029
- Figure 70:
- VOLUME SHARE OF WHEY PROTEIN MARKET BY SUPPLEMENTS END USER, %, NORTH AMERICA, 2017 VS 2023 VS 2029
- Figure 71:
- VOLUME OF WHEY PROTEIN MARKET, BABY FOOD AND INFANT FORMULA, METRIC TONNES, NORTH AMERICA, 2017 - 2029
- Figure 72:
- VALUE OF WHEY PROTEIN MARKET, BABY FOOD AND INFANT FORMULA, USD, NORTH AMERICA, 2017 - 2029
- Figure 73:
- VALUE SHARE OF WHEY PROTEIN MARKET BY FORM, % BABY FOOD AND INFANT FORMULA , NORTH AMERICA, 2022 VS 2029
- Figure 74:
- VOLUME OF WHEY PROTEIN MARKET, ELDERLY NUTRITION AND MEDICAL NUTRITION, METRIC TONNES, NORTH AMERICA, 2017 - 2029
- Figure 75:
- VALUE OF WHEY PROTEIN MARKET, ELDERLY NUTRITION AND MEDICAL NUTRITION, USD, NORTH AMERICA, 2017 - 2029
- Figure 76:
- VALUE SHARE OF WHEY PROTEIN MARKET BY FORM, % ELDERLY NUTRITION AND MEDICAL NUTRITION , NORTH AMERICA, 2022 VS 2029
- Figure 77:
- VOLUME OF WHEY PROTEIN MARKET, SPORT/PERFORMANCE NUTRITION, METRIC TONNES, NORTH AMERICA, 2017 - 2029
- Figure 78:
- VALUE OF WHEY PROTEIN MARKET, SPORT/PERFORMANCE NUTRITION, USD, NORTH AMERICA, 2017 - 2029
- Figure 79:
- VALUE SHARE OF WHEY PROTEIN MARKET BY FORM, % SPORT/PERFORMANCE NUTRITION , NORTH AMERICA, 2022 VS 2029
- Figure 80:
- VOLUME OF WHEY PROTEIN MARKET BY COUNTRY, METRIC TONNES, NORTH AMERICA, 2017 - 2029
- Figure 81:
- VALUE OF WHEY PROTEIN MARKET BY COUNTRY, USD, NORTH AMERICA, 2017 - 2029
- Figure 82:
- VALUE SHARE OF WHEY PROTEIN MARKET BY COUNTRY, %, NORTH AMERICA, 2017 VS 2023 VS 2029
- Figure 83:
- VOLUME SHARE OF WHEY PROTEIN MARKET BY COUNTRY, %, NORTH AMERICA, 2017 VS 2023 VS 2029
- Figure 84:
- VOLUME OF WHEY PROTEIN MARKET, METRIC TONNES, CANADA, 2017 - 2029
- Figure 85:
- VALUE OF WHEY PROTEIN MARKET, USD, CANADA, 2017 - 2029
- Figure 86:
- VALUE SHARE OF WHEY PROTEIN MARKET BY END USER, % , CANADA, 2022 VS 2029
- Figure 87:
- VOLUME OF WHEY PROTEIN MARKET, METRIC TONNES, MEXICO, 2017 - 2029
- Figure 88:
- VALUE OF WHEY PROTEIN MARKET, USD, MEXICO, 2017 - 2029
- Figure 89:
- VALUE SHARE OF WHEY PROTEIN MARKET BY END USER, % , MEXICO, 2022 VS 2029
- Figure 90:
- VOLUME OF WHEY PROTEIN MARKET, METRIC TONNES, UNITED STATES, 2017 - 2029
- Figure 91:
- VALUE OF WHEY PROTEIN MARKET, USD, UNITED STATES, 2017 - 2029
- Figure 92:
- VALUE SHARE OF WHEY PROTEIN MARKET BY END USER, % , UNITED STATES, 2022 VS 2029
- Figure 93:
- VOLUME OF WHEY PROTEIN MARKET, METRIC TONNES, REST OF NORTH AMERICA, 2017 - 2029
- Figure 94:
- VALUE OF WHEY PROTEIN MARKET, USD, REST OF NORTH AMERICA, 2017 - 2029
- Figure 95:
- VALUE SHARE OF WHEY PROTEIN MARKET BY END USER, % , REST OF NORTH AMERICA, 2022 VS 2029
- Figure 96:
- MOST ACTIVE COMPANIES BY NUMBER OF STRATEGIC MOVES, COUNT, NORTH AMERICA WHEY PROTEIN INGREDIENTS MARKET, 2017 - 2022
- Figure 97:
- MOST ADOPTED STRATEGIES, COUNT, NORTH AMERICA, 2017 - 2022
- Figure 98:
- VALUE SHARE OF MAJOR PLAYERS, %, NORTH AMERICA WHEY PROTEIN INGREDIENTS MARKET
North America Whey Protein Ingredients Industry Segmentation
Concentrates, Hydrolyzed, Isolates are covered as segments by Form. Animal Feed, Food and Beverages, Personal Care and Cosmetics, Supplements are covered as segments by End User. Canada, Mexico, United States are covered as segments by Country.| Form | Concentrates | |||
| Hydrolyzed | ||||
| Isolates | ||||
| End User | Animal Feed | |||
| Food and Beverages | By Sub End User | Bakery | ||
| Beverages | ||||
| Breakfast Cereals | ||||
| Condiments/Sauces | ||||
| Dairy and Dairy Alternative Products | ||||
| RTE/RTC Food Products | ||||
| Snacks | ||||
| Personal Care and Cosmetics | ||||
| Supplements | By Sub End User | Baby Food and Infant Formula | ||
| Elderly Nutrition and Medical Nutrition | ||||
| Sport/Performance Nutrition | ||||
| Country | Canada | |||
| Mexico | ||||
| United States | ||||
| Rest of North America | ||||
Need A Different Region or Segment?
Customize Now
Market Definition
- End User - The Protein Ingredients Market operates on a B2B basis. Food, Beverages, Supplements, Animal Feed, and Personal Care & Cosmetic manufacturers are considered to be end-consumers in the market studied. The scope excludes manufacturers buying liquid/dry whey to be used for application as a binding agent or thickener or other non-protein applications.
- Penetration Rate - Penetration Rate is defined as the percentage of Protein-Fortified End User Market Volume in the Overall End User Market Volume.
- Average Protein Content - Average protein content is the average protein content present per 100 g of product manufactured by all end-user companies considered under the scope of this report.
- End User Market Volume - End-user market volume is the consolidated volume of all types and forms of end-user products in the country or region.
| Keyword | Definition |
|---|---|
| Alpha-lactalbumin (α-Lactalbumin) | It is a protein that regulates the production of lactose in the milk of almost all mammalian species. |
| Amino acid | It is an organic compound that contains both amino and carboxylic acid functional groups, which are required for the synthesis of body protein and other important nitrogen-containing compounds, such as creatine, peptide hormones, and some neurotransmitters. |
| Blanching | It is the process of briefly heating vegetables with steam or boiling water. |
| BRC | British Retail Consortium |
| Bread improver | It is a flour-based blend of several components with specific functional properties designed to modify dough characteristics and give quality attributes to bread. |
| BSF | Black Soldier Fly |
| Caseinate | It is a substance produced by adding an alkali to acid casein, a derivative of casein. |
| Celiac disease | Celiac disease is an immune reaction to eating gluten, a protein found in wheat, barley, and rye. |
| Colostrum | It is a milky fluid that’s released by mammals that have recently given birth before breast milk production begins. |
| Concentrate | It is the least processed form of protein and has a protein content ranging from 40-90% by weight. |
| Dry protein basis | It refers to the percentage of "pure protein" present in a supplement after the water in it is completely removed through heat. |
| Dry whey | It is the product resulting from drying fresh whey which has been pasteurized and to which nothing has been added as a preservative. |
| Egg protein | It is a mixture of individual proteins, including ovalbumin, ovomucoid, ovoglobulin, conalbumin, vitellin, and vitellenin. |
| Emulsifier | It is a food additive that facilitates the blending of foods that are immiscible with one another, such as oil and water. |
| Enrichment | It is the process of addition of micronutrients that are lost during the processing of the product. |
| ERS | Economic Research Service of the USDA |
| Extrusion | It is the process of forcing soft mixed ingredients through an opening in a perforated plate or die designed to produce the required shape. The extruded food is then cut to a specific size by blades. |
| Fava | Also known as Faba, it is another word for yellow split beans. |
| FDA | Food and Drug Administration |
| Flaking | It is a process in which typically a cereal grain (like corn, wheat, or rice) is broken down into grits, cooked with flavors and syrups, and then pressed into flakes between cooled rollers. |
| Foaming agent | It is a food ingredient that makes it possible to form or maintain a uniform dispersion of a gaseous phase in a liquid or solid food. |
| Foodservice | It refers to the part of the food industry which includes businesses, institutions, and companies which prepare meals outside the home. It includes restaurants, school and hospital cafeterias, catering operations, and many other formats. |
| Fortification | It is the deliberate addition of micronutrients that are not found in them naturally or which are lost during processing, to improve a food product's nutritional value. |
| FSANZ | Food Standards Australia New Zealand |
| FSIS | Food Safety and Inspection Service |
| FSSAI | Food Safety and Standards Authority of India |
| Gelling agent | It is an ingredient that functions as a stabilizer and thickener to provide thickening without stiffness through the formation of gel. |
| GHG | Greenhouse Gas |
| Gluten | It is a family of proteins found in grains, including wheat, rye, spelt, and barley. |
| Hemp | It is a botanical class of Cannabis sativa cultivars grown specifically for industrial or medicinal use. |
| Hydrolysate | It is a form of protein manufactured by exposing the protein to enzymes that can partially break the bonds between the protein's amino acids and break down large, complicated proteins into smaller pieces. Its processing makes it easier and quicker to digest. |
| Hypoallergenic | It refers to a substance that causes fewer allergic reactions. |
| Isolate | It is the purest and most processed form of protein which has undergone separation to obtain a pure protein fraction. It typically contains ≥ 90% of protein by weight. |
| Keratin | It is a protein that helps form hair, nails, and the outer layer of skin. |
| Lactalbumin | It is the albumin contained in milk and obtained from whey. |
| Lactoferrin | It is an iron‑binding glycoprotein that is present in the milk of most mammals. |
| Lupin | It is the yellow legume seeds of the genus Lupinus. |
| Millenial | Also known as Generation Y or Gen Y, it refers to the people born from 1981 to 1996. |
| Monogastric | It refers to an animal with a single-compartmented stomach. Examples of monogastric include humans, poultry, pigs, horses, rabbits, dogs, and cats. Most monogastric are generally unable to digest much cellulose food materials such as grasses. |
| MPC | Milk protein concentrate |
| MPI | Milk protein isolate |
| MSPI | Methylated soy protein isolate |
| Mycoprotein | Mycoprotein is a form of single-cell protein, also known as fungal protein, derived from fungi for human consumption. |
| Nutricosmetics | It is a category of products and ingredients that act as nutritional supplements to care for skin, nails, and hair natural beauty. |
| Osteoporosis | It is a medical condition in which the bones become brittle and fragile from loss of tissue, typically as a result of hormonal changes, or deficiency of calcium or vitamin D. |
| PDCAAS | Protein digestibility-corrected amino acid score (PDCAAS) is a method of evaluating the quality of a protein based on both the amino acid requirements of humans and their ability to digest it. |
| Per-capita consumption of animal protein | It is the average amount of animal protein (such as milk, whey, gelatin, collagen, and egg proteins) that is readily available for consumption by each person in an actual population. |
| Per-capita consumption of plant protein | It is the average amount of plant protein (such as soy, wheat, pea, oat, and hemp proteins) that is readily available for consumption by each person in an actual population. |
| Quorn | It is a microbial protein manufactured using mycoprotein as an ingredient, in which the fungus culture is dried and mixed with egg albumen or potato protein, which acts as a binder, and then is adjusted in texture and pressed into various forms. |
| Ready-to-Cook (RTC) | It refers to food products that include all of the ingredients, where some preparation or cooking is required through a process that is given on the package. |
| Ready-to-Eat (RTE) | It refers to a food product prepared or cooked in advance, with no further cooking or preparation required before being eaten. |
| RTD | Ready-to-Drink |
| RTS | Ready-to-Serve |
| Saturated fat | It is a type of fat in which the fatty acid chains have all single bonds. It is generally considered unhealthy. |
| Sausage | It is a meat product made of finely chopped and seasoned meat, which may be fresh, smoked, or pickled and which is then usually stuffed into a casing. |
| Seitan | It is a plant-based meat substitute made out of wheat gluten. |
| Softgel | It is a gelatin-based capsule with a liquid fill. |
| SPC | Soy protein concentrate |
| SPI | Soy protein isolate |
| Spirulina | It is a biomass of cyanobacteria that can be consumed by humans and animals. |
| Stabilizer | It is an ingredient added to food products to help maintain or enhance their original texture, and physical and chemical characteristics. |
| Supplementation | It is the consumption or provision of concentrated sources of nutrients or other substances that are intended to supplement nutrients in the diet and is intended to correct nutritional deficiencies. |
| Texturant | It is a specific type of food ingredient that is used to control and alter the mouthfeel and texture of food and beverage products. |
| Thickener | It is an ingredient that is used to increase the viscosity of a liquid or dough and make it thicker, without substantially changing its other properties. |
| Trans fat | Also called trans-unsaturated fatty acids or trans fatty acids, it is a type of unsaturated fat that naturally occurs in small amounts in meat. |
| TSP | Textured soy protein |
| TVP | Textured vegetable protein |
| WPC | Whey protein concentrate |
| WPI | Whey protein isolate |
Need More Details on Market Definition?
Ask a Question
Research Methodology
Mordor Intelligence follows a four-step methodology in all our reports.
- Step-1: Identify Key Variables: The quantifiable key variables (industry and extraneous) pertaining to the specific product segment and country are selected from a group of relevant variables & factors based on desk research & literature review; along with primary expert inputs. These variables are further confirmed through regression modeling (wherever required).
- Step-2: Build a Market Model: In order to build a robust forecasting methodology, the variables and factors identified in Step-1 are tested against available historical market numbers. Through an iterative process, the variables required for market forecast are set and the model is built on the basis of these variables.
- Step-3: Validate and Finalize: In this important step, all market numbers, variables and analyst calls are validated through an extensive network of primary research experts from the market studied. The respondents are selected across levels and functions to generate a holistic picture of the market studied.
- Step-4: Research Outputs: Syndicated Reports, Custom Consulting Assignments, Databases & Subscription Platforms

Get More Details On Research Methodology
Download PDF


