Market Overview
| Study Period | 2019 - 2031 |
|---|---|
| Base Year For Estimation | 2025 |
| Forecast Data Period | 2026 - 2031 |
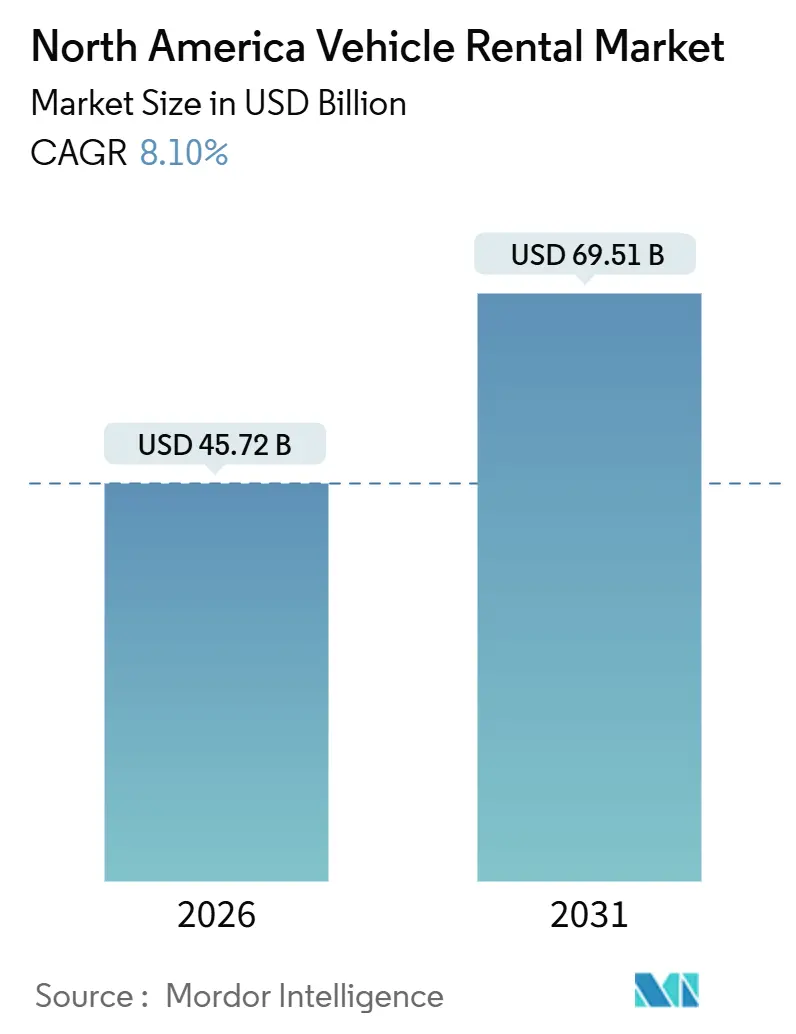
| Market Size (2026) | USD 45.72 Billion |
| Market Size (2031) | USD 69.51 Billion |
| Growth Rate (2026 - 2031) | 8.10% CAGR |
| Market Concentration | Medium |
Major Players
*Disclaimer: Major Players sorted in no particular order Image © Mordor Intelligence. Reuse requires attribution under CC BY 4.0. |
|
North America Vehicle Rental Market Analysis by Mordor Intelligence
The North American vehicle rental market was valued at USD 45.72 billion in 2026 and is projected to reach USD 69.51 billion by 2031, advancing at an 8.10% CAGR. The market’s expansion rests on a rebound in leisure and corporate travel, major airport infrastructure upgrades, and stronger online distribution that lifts utilization and revenue per available car. Operators are accelerating electrification to capture federal and provincial incentives, though residual-value risk and charging-network gaps threaten profitability. Peer-to-peer platforms widen supply without owning fleets, intensifying price competition and compelling incumbents to refine dynamic-pricing engines. Fleet-cost inflation, rising insurance premiums, and airport concession fees remain structural cost headwinds, but product innovation, subscription rentals, contactless pickup, and AI-driven upsells create incremental revenue streams that can offset margin pressure.
Key Report Takeaways
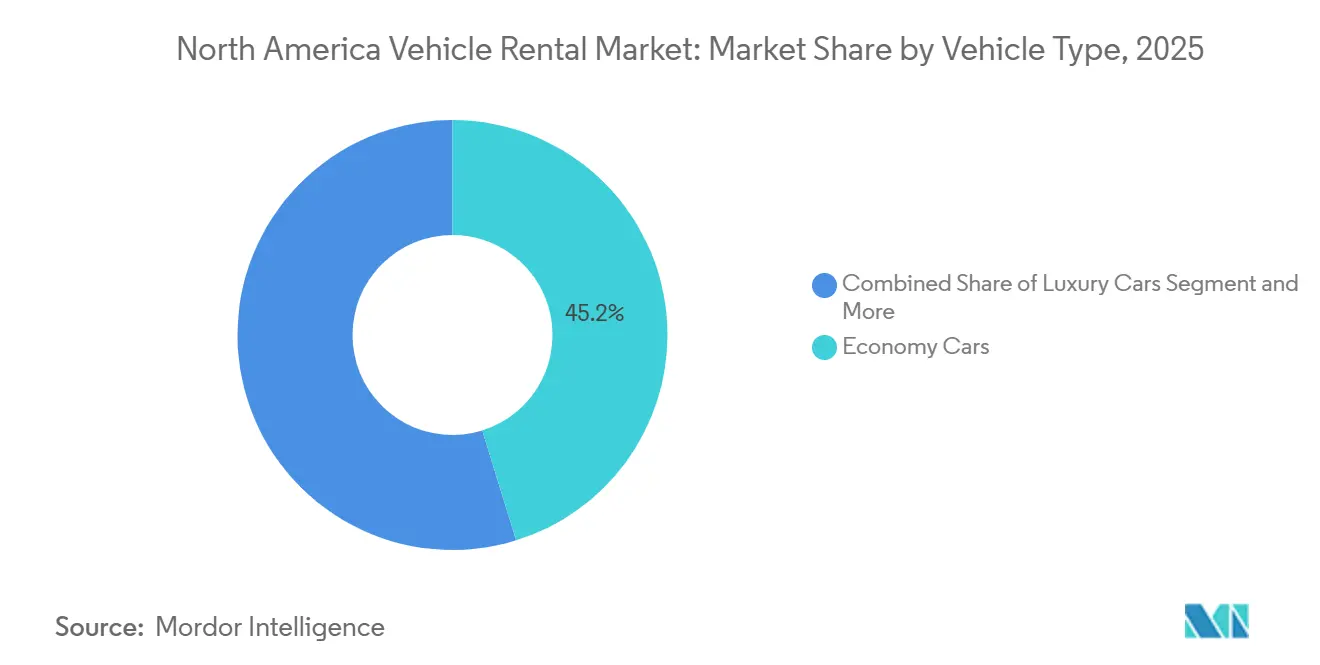
- By vehicle type, economy cars led with 45.18% revenue share in 2025, while sport utility vehicles and crossovers are projected to expand at a 10.68% CAGR to 2031.
- By application type, leisure travel captured 53.62% of 2025 revenue and is advancing at an 11.92% CAGR through 2031.
- By rental duration, short-term contracts held 79.94% of market revenue in 2025, whereas long-term and subscription offerings are forecast to grow at a 13.35% CAGR to 2031.
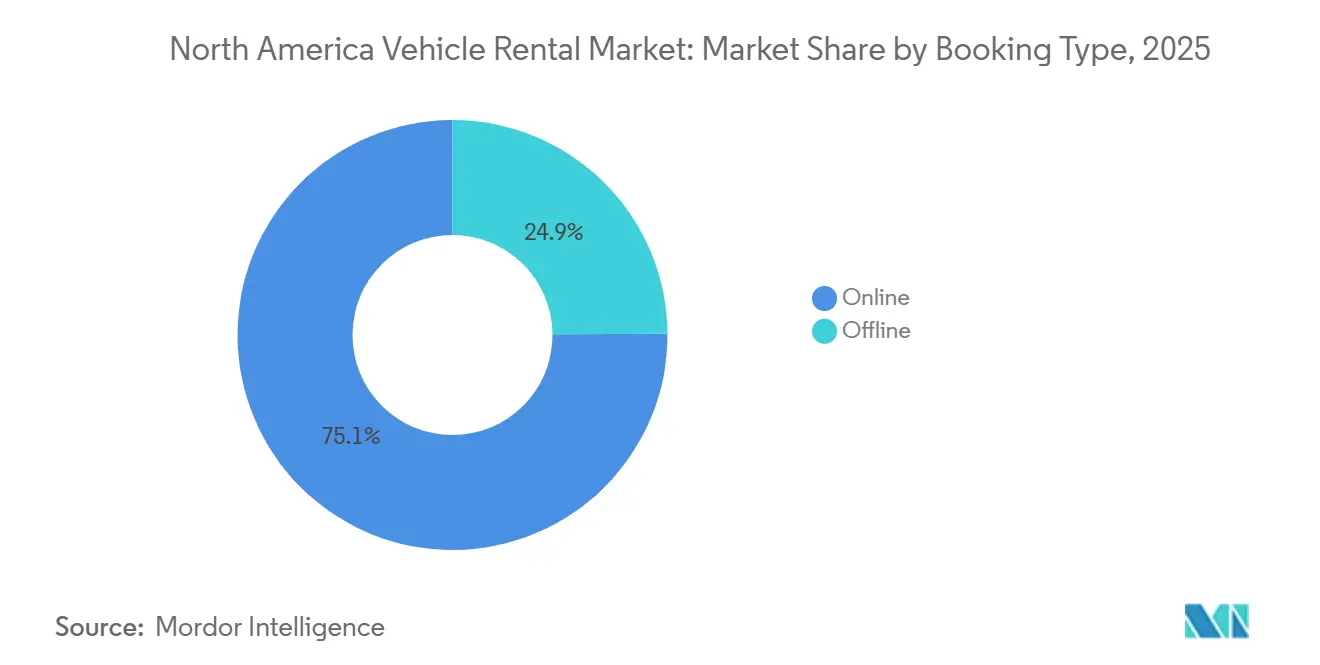
- By booking type, online reservations accounted for 75.08% of 2025 transactions and are expanding at a 13.84% CAGR through 2031.
- By customer type, individual renters generated 66.87% of 2025 revenue, and the segment is also rising at a 12.21% CAGR to 2031.
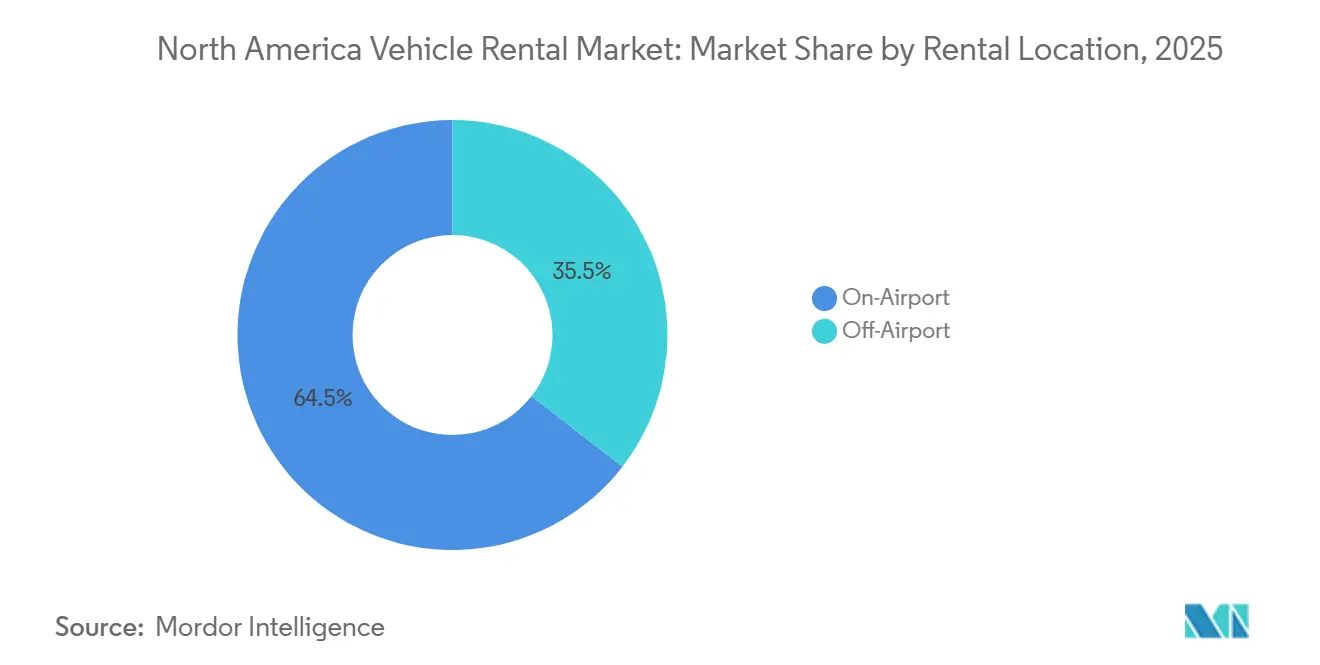
- By rental location, on-airport facilities commanded 64.48% of market revenue in 2025, and are projected to grow at a 13.26% CAGR through 2031.
- By fuel type, internal-combustion vehicles retained 86.21% of the 2025 fleet share, whereas battery-electric models are poised to climb at a 14.42% CAGR to 2031.
- By country, the United States contributed 87.54% of regional revenue in 2025, while Canada is expected to post a 6.58% CAGR through 2031
Note: Market size and forecast figures in this report are generated using Mordor Intelligence’s proprietary estimation framework, updated with the latest available data and insights as of January 2026.
North America Vehicle Rental Market Trends and Insights
Drivers Impact Analysis
| Driver | (~) % Impact on CAGR Forecast | Geographic Relevance | Impact Timeline |
|---|---|---|---|
| Rise in Inbound Leisure Travel | +2.5% | North America, with strongest gains in Florida, California, Nevada tourism corridors | Short term (≤ 2 years) |
| Strong Rebound of Corporate Road-Warrior Segment | +2.0% | North America, concentrated in major business hubs and airport locations | Medium term (2-4 years) |
| Airport Infrastructure Modernization | +1.5% | Global, with early adoption in North American urban markets | Medium term (2-4 years) |
| EV-Focused Fleet Incentives | +1.2% | North America, focused on Tier 1 airports with ConRAC investments | Long term (≥ 4 years) |
| Peer-to-Peer Car-Sharing Platforms Unlocking Latent Supply | +1.0% | United States and Canada, with state-level variations in incentive structures | Long term (≥ 4 years) |
| AI-Driven Dynamic Pricing | +0.8% | North America, concentrated in urban centers with high vehicle ownership | Medium term (2-4 years) |
| Source: Mordor Intelligence | |||
Rise in Inbound Leisure Travel Post-COVID-19
Passenger throughput at Transportation Security Administration checkpoints reached 904 million in 2024[1]"TSA 2024 By the Numbers," tsa.gov., the highest annual total on record. The surge restored confidence in airport rentals and maintained leisure’s 53.62% share of the North America vehicle rental market, with a projected 11.92% CAGR through 2031. Gateway airports such as Los Angeles, Miami, and Orlando benefited disproportionately from recovering trans-Atlantic and Latin American traffic, translating to higher multi-day Sport Utility Vehicle (SUV) bookings. Canadian destinations also logged double-digit growth in overnight visitors during the 2024 summer peak. Extended “bleisure” stays among millennial and Gen Z travelers lengthened average rental durations and supported yield improvements.
Strong Rebound of Corporate Road-Warrior Segment
Corporate travel volumes reached about 90% of 2019 benchmarks by Q4 2024. High-frequency road warriors chose premium sedans and loyalty perks, enabling operators to deploy dynamic pricing and earn higher ancillary revenue. Enterprise Holdings and Avis Budget Group reported sequential gains in corporate account bookings during 2024. Large conventions such as CES 2025 drove short-notice spikes that AI-based pricing captured, lifting revenue per available car even with modest fleet growth.
Airport Infrastructure Modernization Boosting On-Airport Rentals
Completion of the USD 2 billion[2]"Consolidated Rent-A-Car Facility," Los Angeles World Airports, lawa.org. Los Angeles ConRAC and the USD 420 million Orlando facility integrated rental counters into terminal circulations, reducing shuttle wait times and elevating customer satisfaction. Similar projects in Reno, Sacramento, and Detroit expanded consolidated facilities by early 2025. These upgrades underpin the 64.48% on-airport share in 2025 and a 13.26% forecast CAGR, as long-term concession agreements ensure incumbents retain prime positions.
EV-Focused Fleet Incentives Under United States Inflation Reduction Act (IRA) and the Canadian Zero-Emission Vehicle (ZEV) Mandates
The United States Inflation Reduction Act provides commercial credits up to USD 40,000 for qualifying battery-electric vehicles. Canada mandates 20% zero-emission sales by 2026 and 60% by 2030[3]"Canada’s Electric Vehicle Availability Standard (regulated targets for zero-emission vehicles)," Government of Canada, canada.ca., supported by federal incentives up to CAD 5,000 (USD 3,700). Large operators leverage bulk purchase agreements, such as Sixt’s framework with Stellantis for up to 250,000 vehicles, to accelerate fleet turnover and secure residual-value guarantees. Hertz’s 2024 divestiture of about 20,000 EVs highlighted resale-value volatility when charging access lags expectations.
Restraints Impact Analysis
| Restraint | (~) % Impact on CAGR Forecast | Geographic Relevance | Impact Timeline |
|---|---|---|---|
| OEM Vehicle Supply Constraints and High Acquisition Costs | -1.5% | North America, with particular impact on domestic OEM supply chains | Short term (≤ 2 years) |
| Rising Insurance Premiums | -1.2% | North America, with state-level variations in regulatory environments | Medium term (2-4 years) |
| Urban Modal Shift Toward Ride-Hailing | -0.8% | North America urban centers, concentrated in cities with established alternative transportation | Long term (≥ 4 years) |
| Airport Surcharges and Environmental Levies | -0.5% | North America, focused on major airport hubs with high fee structures | Medium term (2-4 years) |
| Source: Mordor Intelligence | |||
OEM Vehicle Supply Constraints and High Acquisition Costs
Semiconductor shortages curbed 2024 fleet deliveries, forcing operators to extend holding periods and negotiate residual-value guarantees. Average new-vehicle transaction prices in the United States hovered near USD 48,000 in 2024, increasing capital requirements. Operators narrowed depreciation per unit by replacing aging sedans with customer-preferred sport utility vehicles, yet acquisition costs remain a drag while original equipment manufacturers retool for electrification.
Rising Insurance Premiums and Liability-Claims Inflation
Higher accident severity and litigation frequency in tort-friendly states drove double-digit premium hikes during 2024. Operators disclosed year-over-year rises in direct operating expense per transaction day tied to insurance cost escalation. Marketplace players integrate credit-based risk scoring and telematics to blunt losses, but coverage remains a growing cost line.
Segment Analysis
By Vehicle Type: Sport Utility vehicles Drive Premium Segment Growth
Economy vehicles hold a significant position in North America's vehicle rental market, accounting for a 45.18% share in 2025. This dominance is primarily driven by corporate contracts and the demand from cost-sensitive leisure travelers. However, sport utility vehicles and crossovers are rapidly gaining traction as the fastest-growing segment. They are projected to grow at a 10.68% CAGR through 2031, fueled by the preferences of families and inbound tourists who prioritize space, comfort, and all-weather reliability.
Operators are increasingly adjusting their fleet composition to include more sport utility vehicles, despite the higher costs associated with acquisition and insurance. These vehicles offer better utilization rates and command higher average daily rates, making them a lucrative choice. Premium and luxury vehicles, although representing a smaller share of the market, deliver higher margins, particularly in urban and resort areas. Additionally, multi-purpose vehicles and light vans continue to address the specific needs of group travel and commercial mobility niches.
Note: Segment shares of all individual segments available upon report purchase
Get Detailed Market Forecasts at the Most Granular Levels
Download PDF
By Application Type: Leisure Travel Dominates Growth Trajectory
Leisure travel has established itself as the leading segment in the market, holding a significant 53.62% share in 2025. This segment is anticipated to grow at an impressive 11.92% CAGR through 2031, driven by robust inbound tourism and the increasing trend of extended holiday travel. Additionally, the rise of "bleisure" travel, which combines business and leisure, is further extending rental durations and directly enhancing revenue per transaction.
On the other hand, business travel has stabilised as a reliable secondary demand pillar, contributing steady weekday volumes and generating a higher yield per rental. Although corporate travel levels remain below pre-pandemic peaks, operators benefit from margin stability supported by negotiated accounts and loyalty-driven repeat usage.
By Rental Duration: Subscription Models Reshape Long-Term Segment
In 2025, short-term rentals commanded a significant 79.94% share of the market, underscoring their appeal to both leisure and business travelers, who favor daily and weekly bookings. These rentals adeptly leverage dynamic pricing, capitalizing on seasonal peaks and surges driven by major events. The dominance of short-term rentals is further supported by their ability to cater to last-minute bookings and provide a wide range of options, from budget-friendly accommodations to luxury stays, making them a preferred choice for diverse traveler needs.
Long-term rentals, alongside subscription models, are set to expand at a robust 13.35% CAGR. This growth is fueled by a consumer shift towards valuing flexibility over traditional ownership and a rising demand from the gig economy. Additionally, the increasing adoption of remote work has amplified the demand for long-term rental solutions, as individuals and families seek adaptable living arrangements. Furthermore, operators are enhancing customer retention and securing stable, recurring revenue through bundled pricing that encompasses insurance and maintenance services, which also adds convenience and value for consumers.
By Booking Type: Digital Transformation Accelerates Online Dominance
In 2025, online bookings made up 75.08% of total reservations and are projected to grow at a 13.84% CAGR, fueled by mobile apps, comparison platforms, and direct-to-consumer channels. These digital bookings not only facilitate quicker price discovery but also enhance the uptake of ancillary services, such as insurance, GPS rentals, and additional driver options, which contribute to higher revenue streams for operators.
As operators shrink their counter footprints, offline bookings wane, nudging customers towards self-service platforms. This shift not only reduces operational costs but also aligns with evolving consumer preferences for convenience and speed. Furthermore, data harvested from online channels powers AI-driven pricing engines, bolstering revenue per available car and refining yield management by enabling dynamic pricing strategies and better inventory allocation.
Get Detailed Market Forecasts at the Most Granular Levels
Download PDF
By Customer Type: Individual Segment Drives Market Expansion
In 2025, individual customers held a dominant 66.87% share of the market. Forecasts predict this segment will expand at a robust 12.21% CAGR through 2031, buoyed by a resurgence in leisure travel and broader digital access. This growth is driven by increasing affordability of travel options, the proliferation of online booking platforms, and the rising preference for personalized travel experiences. While this segment propels volume, it exhibits heightened sensitivity to pricing, requiring operators to adopt competitive pricing strategies and targeted marketing efforts to retain and attract customers.
Operators leverage long-term contracts and loyalty programs to steady revenues, countering the fluctuations often seen with individual renters. Additionally, corporate customers benefit from tailored services, such as streamlined booking processes, dedicated account management, and flexible rental terms, which further enhance their value to operators. This segment's predictable demand and higher spending capacity make it a critical focus area for sustained profitability in the market.
By Rental Location: On-Airport Facilities Maintain Strategic Advantage
In 2025, on-airport rentals commanded a dominant 64.48% market share, with projections indicating a robust 13.26% CAGR, buoyed by ongoing airport modernization and the establishment of integrated rental facilities. These facilities are increasingly designed to enhance customer experience by offering seamless booking processes, faster vehicle pick-up and drop-off services, and proximity to terminals. Despite the burden of elevated concession fees, the allure of high passenger throughput and convenience prevails, making on-airport rentals a preferred choice for both business and leisure travelers.
Off-airport locations primarily serve local replacements and value-seeking customers, providing competitive pricing. However, they grapple with elevated customer acquisition costs due to the need for extensive marketing and partnerships to attract customers. Nonetheless, these outlets play a pivotal role in optimising fleet utilisation during non-peak travel times by catering to demand from local residents and businesses. Additionally, they often offer flexible rental terms and a wider variety of vehicle options, further appealing to cost-conscious consumers.
Get Detailed Market Forecasts at the Most Granular Levels
Download PDF
By Fuel Type: Electric Vehicle Adoption Accelerates Despite Challenges
In 2025, internal-combustion engine vehicles commanded a dominant 86.21% share of the fleet market, buoyed by a well-established refuelling infrastructure and their lower upfront costs. These internal combustion engine vehicles are still the go-to choice for long-distance journeys and multi-day rentals, as they offer greater convenience and reliability in regions where charging infrastructure for electric vehicles remains underdeveloped. Additionally, the widespread availability of fuel stations and the familiarity of maintenance processes further reinforce their dominance in the market.
Battery-electric vehicles are set to surge at a robust 14.42% CAGR, fueled by regulatory incentives and a global push towards sustainability. Governments worldwide are implementing stricter emission standards and offering subsidies to encourage the adoption of electric vehicles, which is driving this growth. Despite facing hurdles like residual-value concerns and charging infrastructure issues, the momentum for fleet electrification is undeniable. Companies are increasingly investing in charging networks and battery technology advancements to address these challenges, further accelerating the transition to electric fleets.
Geography Analysis
The United States commanded 87.54% of the North American vehicle rental market share in 2025, aided by 904 million TSA screenings and extensive airport modernisation that embeds rental facilities inside terminal footprints. Infrastructure upgrades at Los Angeles, Orlando, Reno, Sacramento, and Detroit improve customer flow and protect incumbents through long-term concessions. Corporate volumes approached 90% of 2019 levels by late 2024, boosting premium-vehicle demand, yet elevated concession fees and insurance premiums weigh on profitability. Inflation Reduction Act (IRA) credits accelerate electrification, though Hertz’s write-downs highlight residual-value uncertainty.
Canada is advancing at a 6.58% CAGR to 2031, supported by Zero-Emission Vehicle (ZEV) mandates and up to CAD 5,000 (approximately 3,700) federal purchase incentives. Overnight visitor arrivals grew in double digits during the 2024 peak, yet harsh winters suppress utilization, necessitating seasonal fleet redeployment. Sixt’s Stellantis framework positions it to meet Canadian zero-emission requirements while leveraging residual-value guarantees.
Mexico and select Caribbean destinations account for a marginal share, limited by lower incomes and fragmented regulations. United States operators serve resort areas but face higher credit risk and currency volatility. The geographic split underscores the strategic importance of defending United States airport concessions and navigating provincial and state regulations that shape fleet mix and profitability.
Competitive Landscape
Market concentration is moderate: Enterprise Holdings, Avis Budget Group, and Hertz Global control a major chunk of airport revenue, while peer-to-peer platforms and subscription services dilute share off-airport. Incumbents leverage fleet scale, original equipment manufacturer discounts, and loyalty programs to defend margins. Sixt’s long-term Stellantis pact secures electrified supply and residual-value protection.
Turo’s Uber partnership exposes 2.5 million peer-to-peer vehicles to ride-hailing users, challenging incumbents on price and convenience. Getaround integrates credit-based insurance scoring to cut claim frequency, while Kyte and Vay pursue remote delivery and tele-operation models that reduce capital intensity.
Legacies respond with AI-driven pricing, contactless pickup, and expanded ancillary offerings. Hertz reported sequential RevPAC gains in 2025 despite softer demand, crediting algorithmic yield, and fleet-mix optimization. The interplay of regulatory moats, technology adoption, and capital structure will shape share distribution as the market scales toward USD 69.51 billion by 2031.
North America Vehicle Rental Industry Leaders
-
Sixt SE
-
Turo Inc.
-
Hertz Global Holdings, Inc.
-
Avis Budget Group, Inc.
-
Enterprise Holdings, Inc.
- *Disclaimer: Major Players sorted in no particular order
Need More Details on Market Players and Competitors?
Download PDF
Recent Industry Developments
- March 2025: SIXT United States of America opened a new branch at the Seminole Hard Rock Hotel & Casino in Hollywood, Florida. The company established a partnership with Hard Rock International and Seminole Gaming, offering premium vehicle rentals to hotel guests and exclusive discounts to Unity by Hard Rock loyalty program members across the United States.
- February 2025: Turo abandoned its planned United States IPO despite posting USD 958 million in 2024 revenue, citing slower growth and investor caution.
Research Methodology Framework and Report Scope
Market Definitions and Key Coverage
The study defines the North America vehicle rental market as all passenger cars and light commercial vans supplied by professional rental operators for paid, short- or long-term use across the United States, Canada, Mexico, and selected Caribbean territories. Vehicles moved through subscriptions, airport desks, downtown counters, and digital platforms are all counted in value terms at retail rental prices.
Peer-to-peer car-sharing, where private owners rent out their own vehicles, is not part of our scope.
Segmentation Overview
-
By Vehicle Type
- Luxury Cars
- Economy Cars
- SUVs and Crossovers
- Multi-Purpose Vehicles (MPV)
- Light Commercial Vans
-
By Application Type
- Leisure Travel
- Business/Commercial Travel
- Local Usage (In-city)
- Outstation/Inter-city
-
By Rental Duration
- Short-Term (Under 30 days)
- Long-Term/Subscription (30 days or more)
-
By Booking Type
- Online
- Offline
-
By Customer Type
- Individual
- Corporate Fleet Accounts
-
By Rental Location
- On-Airport
- Off-Airport
-
By Fuel Type
- Internal Combustion Engine (ICE)
- Hybrid
- Battery Electric Vehicle (BEV)
-
By Country
- United States
- Canada
- Rest of North America
Detailed Research Methodology and Data Validation
Primary Research
Structured interviews with regional fleet managers, procurement heads in corporates, and airport concession officers helped us validate fleet refresh cycles, electric-vehicle adoption rates, and post-pandemic demand shifts across leisure and business cohorts. Online surveys of frequent renters in large metros clarified booking-channel splits and acceptable price bands.
Desk Research
Our analysts first built a foundation from trusted public datasets such as the US Bureau of Transportation Statistics, Statistics Canada, Mexico's INEGI vehicle registry, and tourism arrivals tables from UNWTO. Trade associations such as the American Car Rental Association and the Global Business Travel Association, together with filings from listed rental groups, enriched fleet size, utilization, and average daily rate indicators. Paid databases that Mordor subscribes to, including D&B Hoovers for company revenues and Dow Jones Factiva for event tracking, offered further granularity. These sources were cross-checked with reputable press articles and patent filings on connected-fleet telematics. The list above is illustrative; many additional publications informed data verification and context building.
Market-Sizing & Forecasting
We applied a top-down model that reconstructs demand from tourism nights, business trip counts, and resident mobility indices, which are then multiplied by derived average rental days and blended daily rates. Supplier roll-ups of reported fleet totals and channel checks on subscription programs served as bottom-up anchors that fine-tuned the topline. Key variables, including inbound tourist growth, airport passenger throughput, remote-work penetration, fleet electrification share, service fee inflation, and vehicle replacement age, drive both historical sizing and forward scenarios. Multivariate regression with scenario overlays yields the 2025-2030 forecast, and expert panels review variable trajectories before we freeze each outlook.
Data Validation & Update Cycle
Outputs pass variance checks against independent traffic, fleet, and trade data, followed by two-step analyst peer review. Reports refresh annually, with interim revisions when material events, such as regulatory fee hikes or fleet supply shocks, trigger re-validation.
Why Mordor's North America Vehicle Rental Baseline Commands Confidence
Published estimates often diverge because firms pick different rental channels, price assumptions, and refresh cadences.
Readers need clarity on why numbers vary and which baseline can be trusted.
Benchmark comparison
| Market Size | Anonymized source | Primary gap driver |
|---|---|---|
| USD 47.38 B (2025) | Mordor Intelligence | - |
| USD 76.00 B (2024) | Regional Consultancy A | Counts leasing and peer-to-peer fleets |
| USD 54.50 B (2024) | Global Consultancy B | Derives value from global share rather than regional fleet data |
| USD 18.90 B (2023) | Trade Journal C | Focuses only on airport rentals, excludes online bookings |
The comparison shows that when fleet boundaries, booking channels, and pricing logic are aligned, Mordor's baseline sits squarely between aggressive and conservative views, giving decision-makers a balanced figure that links transparently to observable variables and repeatable steps.
Need A Different Region or Segment?
Customize Now
Key Questions Answered in the Report
What is driving the fastest growth in rentals?
Online bookings and on-airport locations are expanding quickest, with digital channels growing at a 13.84% CAGR and airport sites at 13.26% through 2031.
How significant are electric vehicles in rental fleets?
Battery-electric models represented 13.79% of fleets in 2026 and are forecast to grow at a 14.42% CAGR, supported by United States and Canadian incentives.
Which vehicle class is gaining share the fastest?
SUVs and crossovers are projected to expand at a 10.68% CAGR, outpacing economy and luxury categories.
Are subscription rentals becoming mainstream?
Subscription and long-term rentals still account for one-fifth of transaction days but are advancing at 13.35% CAGR as consumers seek flexible access.
How concentrated is the competitive landscape?
Enterprise, Avis Budget, and Hertz collectively hold about 72% of airport revenue, indicating moderate concentration but rising digital disruption.


