
Market Overview
| Study Period | 2021 - 2031 |
|---|---|
| Forecast Data Period | 2026 - 2031 |
| Base Year Market Size (2025) | USD 50.87 Billion |
| Market Size (2026) | USD 52.58 Billion |
| Market Size (2031) | USD 62.07 Billion |
| Growth Rate (2026 - 2031) | 3.37 % |
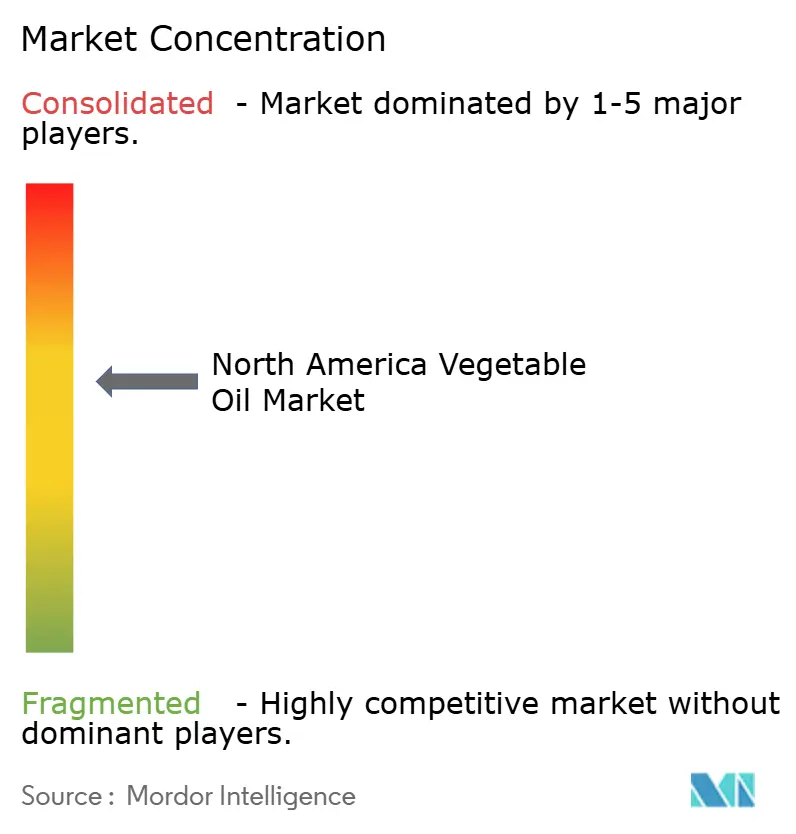
| Market Concentration | Medium |
Major Players *Disclaimer: Major Players sorted in no particular order Image © Mordor Intelligence. Reuse requires attribution under CC BY 4.0. | |
North America Vegetable Oil Market Analysis by Mordor Intelligence
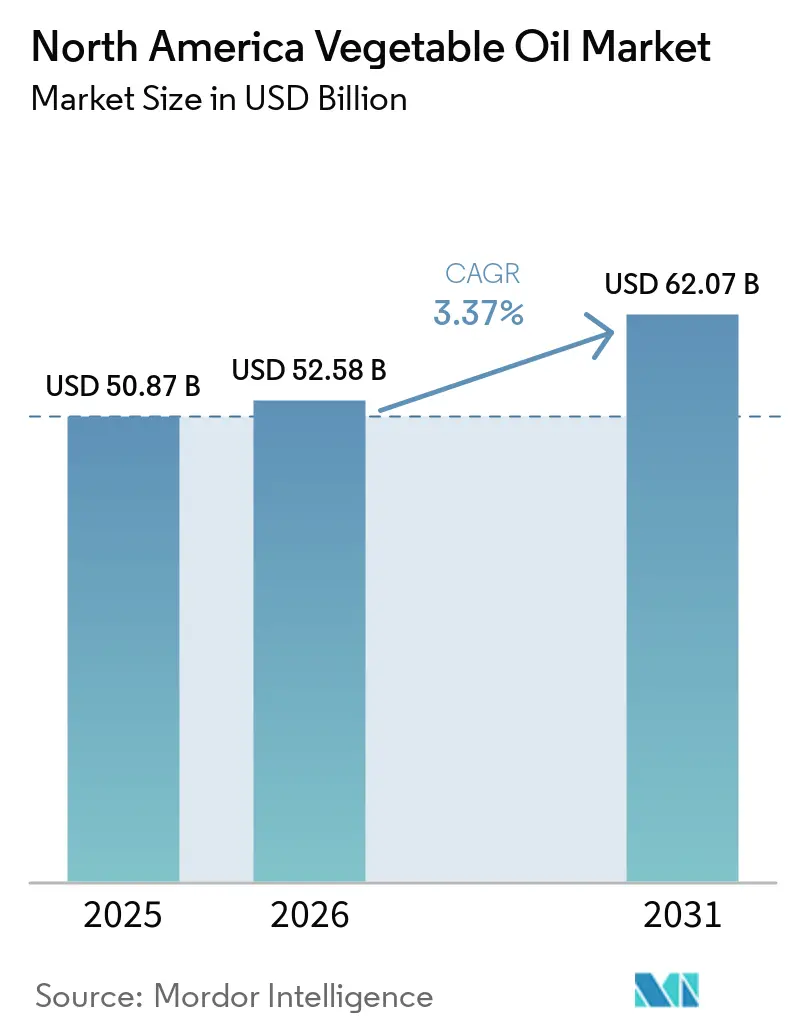
The North American vegetable oil market size was valued at USD 50.87 billion in 2025 and estimated to grow from USD 52.58 billion in 2026 to reach USD 62.07 billion by 2031, at a CAGR of 3.37% during the forecast period (2026-2031). The market's expansion is driven by several factors, including comprehensive government policies that actively promote renewable diesel production, substantial capital investments flowing into food processing infrastructure, and increasing consumer preference for premium organic variants. The implementation of biofuel mandates has fundamentally altered feedstock allocation patterns, directing significant volumes toward energy production, while the food manufacturing sector maintains consistent demand through the proliferation of plant-based convenience products. The well-established trade partnership between the United States and Canada continues to ensure reliable rapeseed oil supply chains, while Mexico's growing reliance on imports adds a new dimension to market demand dynamics. The competitive landscape maintains a moderate intensity, characterized by established manufacturers strategically expanding their crushing operations while specialized oil producers successfully develop and occupy premium market segments.
Key Report Takeaways
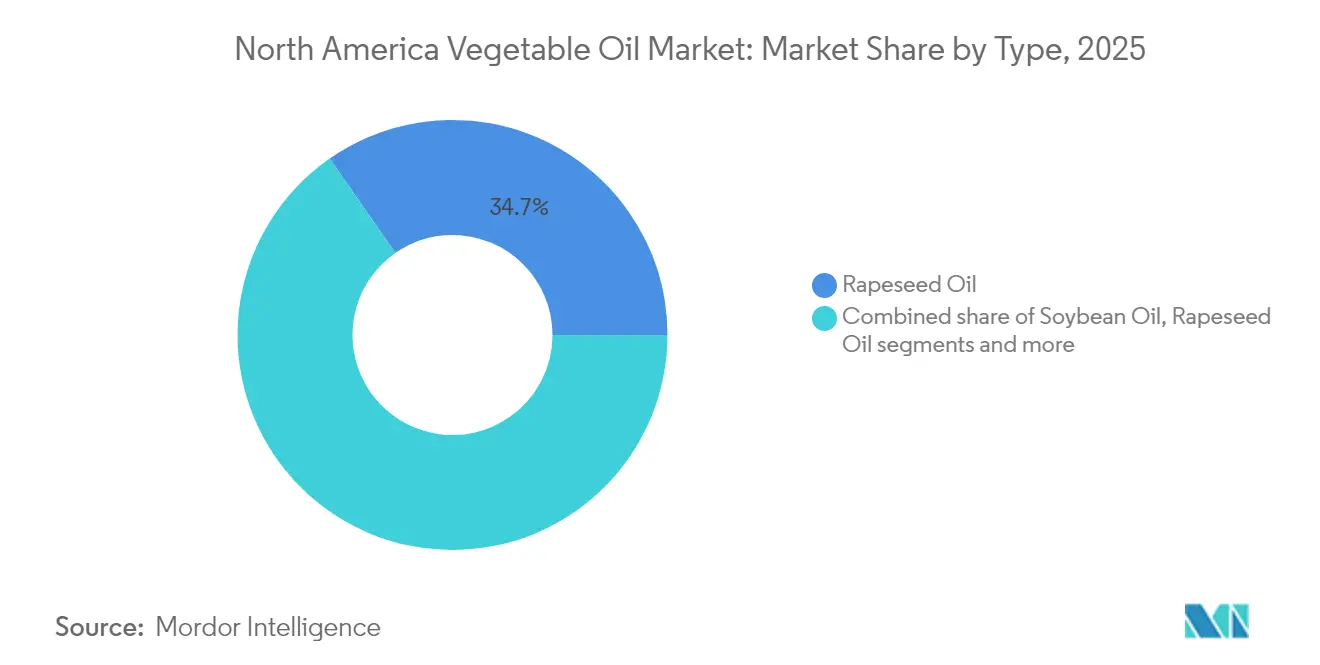
- By type, rapeseed oil held 34.68% of the North America vegetable oil market share in 2025; palm oil is forecast to post the fastest 4.21% CAGR through 2031.
- By nature, the conventional segment accounted for 79.05% share of the North America vegetable oil market size in 2025, whereas organic oils are set to grow at a 4.58% CAGR to 2031.
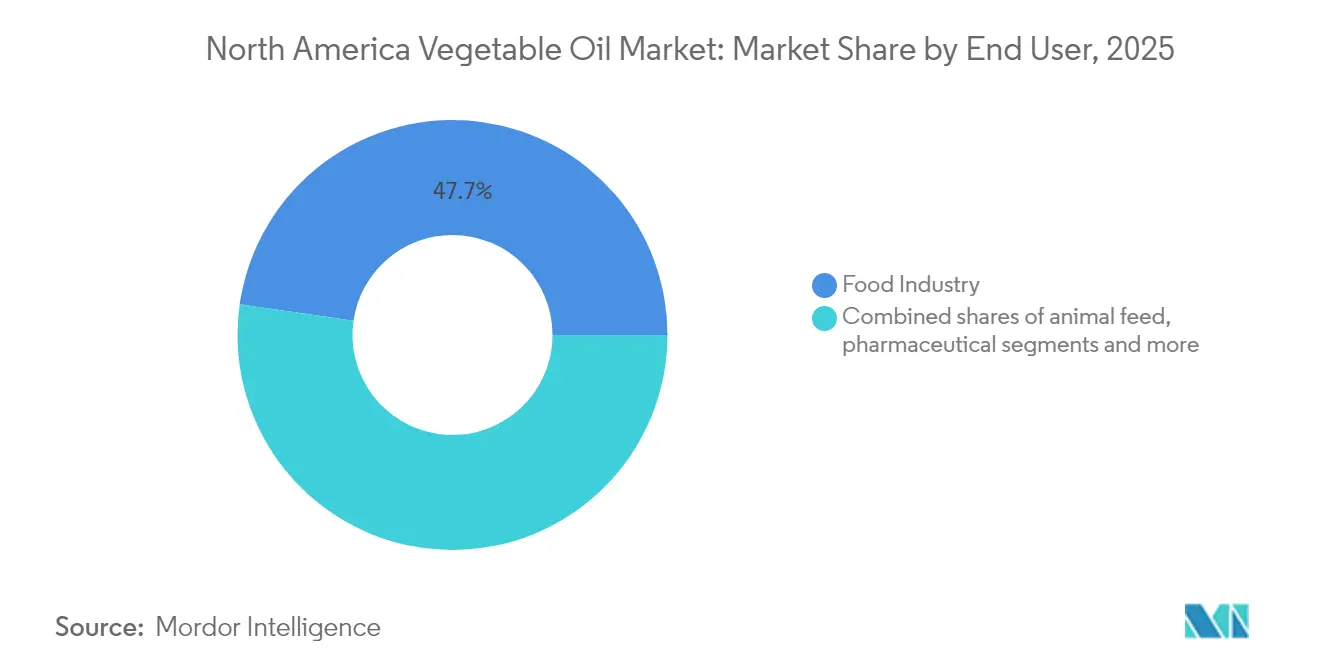
- By end user, food-industry applications commanded 47.72% of demand in 2025, while biofuels are advancing at a 4.19% CAGR through 2031.
- By geography, the United States captured 77.56% revenue in 2025; Mexico is projected to be the fastest-growing country with a 4.86% CAGR to 2031.
Note: Market size and forecast figures in this report are generated using Mordor Intelligence’s proprietary estimation framework, updated with the latest available data and insights as of 2026.
North America Vegetable Oil Market Trends and Insights
Drivers Impact Analysis*
| Driver | (~) % Impact on CAGR Forecast | Geographic Relevance | Impact Timeline |
|---|---|---|---|
| Expansion of food processing and packaged food sectors | +0.8% | North America, with strongest impact in United States and Canada | Medium term (2-4 years) |
| Growth in biodiesel and renewable energy mandates boosting oil demand | +1.2% | United States dominant, Canada secondary, Mexico emerging | Short term (≤ 2 years) |
| Increased use of vegetable oils in cosmetics and pharmaceuticals | +0.4% | North America, concentrated in urban markets | Long term (≥ 4 years) |
| Rising demand for non-GMO and organic oil variants | +0.6% | United States and Canada, premium market segments | Medium term (2-4 years) |
| Fueling consumer awareness of unsaturated fats and omega-3 benefits | +0.5% | North America, health-conscious demographics | Long term (≥ 4 years) |
| Product diversification with specialty oils such as high-oleic sunflower oils | +0.3% | North America, foodservice and industrial applications | Medium term (2-4 years) |
| Source: Mordor Intelligence | |||
Expansion of Food Processing and Packaged Food Sectors
The food processing industry's continuous expansion remains a significant driver of vegetable oil demand throughout North America. Processed food manufacturers depend on stable, functional oils to ensure their products maintain quality and appeal to consumers through extended shelf life periods. The United States has demonstrated substantial export performance in processed vegetables, with Canada and Mexico emerging as the primary export destinations [1]. The sector's evolution is particularly evident in the plant-based food segment, where companies are making substantial investments to expand production capabilities, particularly in dairy alternatives such as oatmilk. This industrial transformation reflects broader consumer preferences shifting toward processed convenience foods, where vegetable oils play an essential role in maintaining texture, flavor stability, and preservation qualities. The packaged food sector's increasing emphasis on clean-label ingredients has generated robust demand for non-GMO and organic oil variants, establishing distinct premium market segments within the industry. In response to both regulatory requirements and growing consumer health awareness, processing companies are actively transitioning to high-oleic sunflower and canola oils as alternatives to partially hydrogenated oils.
Growth in Biodiesel and Renewable Energy Mandates Boosting Oil Demand
Renewable energy policies are fundamentally transforming North American vegetable oil markets by establishing consistent demand through regulatory frameworks. The U.S. Renewable Fuel Standard mandates a minimum 50% reduction in lifecycle greenhouse gas emissions for biomass-based diesel, making vegetable oils essential feedstocks for meeting federal and state environmental targets [2]. California's Low Carbon Fuel Standard has significantly influenced the market, implementing a 20% credit cap on soy and canola-based renewable diesel credits to balance food and fuel production needs [3]. These regulations have spurred substantial infrastructure development, with renewable diesel production capacity expected to increase by 100 million gallons between 2024 and 2025, reaching 5.2 billion gallons. The 2025 implementation of the Clean Fuel Production Tax Credit (45Z), which offers incentives up to USD 1 per gallon based on carbon intensity for domestically produced fuels, may reduce imports while increasing local vegetable oil demand. Canadian canola oil has gained strategic importance after EPA approval of renewable fuel pathways, with U.S. imports accounting for 91% of Canada's canola oil exports in 2023.
Increased Use of Vegetable Oils in Cosmetics and Pharmaceuticals
The cosmetics and pharmaceutical industries are experiencing a significant transformation in their ingredient sourcing strategies, with vegetable oils emerging as a crucial component in their formulations. This shift is primarily driven by heightened consumer awareness and demand for natural ingredients, coupled with evolving regulatory frameworks that emphasize safer product formulations. The FDA has established specific guidelines for vegetable oil derivatives in food-grade applications, particularly focusing on oleic acid derived from tall oil fatty acids, which serves multiple functions as lubricants, binders, and defoaming agents. These regulations meticulously outline requirements for resin acid content and unsaponifiable matter. Within the pharmaceutical sector, manufacturers are increasingly incorporating glycerides and polyglycides from hydrogenated vegetable oils as excipients in dietary supplement formulations, adhering to rigorous purity standards that include maintaining lead content below 0.1 mg/kg and meeting specific ester content thresholds [4]. A notable development in this space is the adoption of high-oleic sunflower oil as a sustainable alternative to palm oil in cosmetic applications, offering comparable functionality while addressing environmental concerns, despite requiring additional formulation considerations due to its lower oxidative stability. This evolving landscape reflects a broader industry movement toward clean beauty and pharmaceutical manufacturing practices, where companies must balance regulatory compliance, sustainability commitments, and consumer preferences for natural, traceable ingredients.
Rising Demand for Non-GMO and Organic Oil Variants
Consumer awareness regarding genetic modification and organic production methods continues to reshape premium market segments within the North American vegetable oil market, where organic olive oil demonstrates substantial growth in sales volume during the specified period, while the broader extra virgin olive oil category experiences a decline. Despite the predominant presence of genetically modified canola in North America, Non-GMO canola oil maintains its premium market position through rigorous identity preservation programs and recognized third-party certifications such as Non-GMO Project Verified, attracting both health-conscious consumers and food manufacturers seeking clean-label ingredients. The inherent non-GMO characteristics of sunflower oil, stemming from its genetic transformation complexities and the industry's steadfast commitment to GM-free production, establish it as a premium alternative to conventional soybean and canola oils in applications where non-GMO attributes are essential. The organic products market demonstrates consistent growth, with higher-income and educated consumers fueling the demand for premium oil variants, despite significant price premiums compared to conventional alternatives, while major retail establishments, including prominent chains like Walmart, continue to expand their organic private-label portfolios, and specialty retailers leverage organic and non-GMO positioning to distinguish themselves in the competitive marketplace.
Restraints Impact Analysis*
| Restraint | (~) % Impact on CAGR Forecast | Geographic Relevance | Impact Timeline |
|---|---|---|---|
| Environmental concerns related to large-scale oil crop cultivation and deforestation | -0.4% | Global supply chains affecting North American imports, particularly palm oil | Long term (≥ 4 years) |
| Regulatory challenges and changing food safety and labeling requirements | -0.3% | North America, with strongest impact in United States due to FDA regulations | Short term (≤ 2 years) |
| Risk of adulteration and quality control issues | -0.2% | North America, affecting imported oils and domestic processing | Medium term (2-4 years) |
| Complexity in traceability and certification for sustainable sourcing | -0.3% | North America, particularly affecting premium and organic segments | Medium term (2-4 years) |
| Source: Mordor Intelligence | |||
Environmental Concerns Related to Large-Scale Oil Crop Cultivation and Deforestation
Environmental sustainability concerns are impacting vegetable oil market growth, particularly affecting palm oil imports and increasing demand for domestic alternatives with lower environmental impact. The global vegetable oil market, which grew approximately 5% annually over the past decade, has contributed to tropical deforestation through palm and soybean oil expansion. The EU Deforestation Regulation (EUDR), which prohibits products from land deforested after December 31, 2020, is transforming global supply chains and influencing North American import patterns, despite primarily targeting European markets. While consumer and corporate sustainability commitments increase demand for certified sustainable oils, adoption remains moderate, with only 56% of downstream actors meeting RSPO certification targets in 2022. North American food manufacturers and retailers face challenges in balancing cost, functionality, and sustainability requirements in their supply chains.
Regulatory Challenges and Changing Food Safety and Labeling Requirements
The North American vegetable oil industry is experiencing a transformative period as regulatory requirements reshape operational practices and cost structures. The FDA's Food Traceability Rule, set to take effect on January 20, 2026, introduces comprehensive documentation requirements, including 24-hour traceability data access, Critical Tracking Events documentation, and Traceability Lot Code assignments. This regulatory framework extends to allergen management, where processors must maintain detailed records of protein removal processes and source identification in ingredient lists, despite exemptions for highly refined oils. The FSMA Preventive Controls regulations further mandate robust food safety measures, requiring manufacturers to implement thorough hazard analyses and preventive controls. These regulatory demands have created a distinct market dynamic where larger companies with substantial compliance resources maintain a competitive advantage, while smaller processors face increasing operational pressures. The situation is particularly challenging for organizations operating with legacy IT systems, as the stringent 24-hour data access requirement necessitates significant technological upgrades to maintain market viability and compliance.
*Our forecasts treat driver/restraint impacts as directional, not additive. The impact forecasts reflect baseline growth, mix effects, and variable interactions.
Segment Analysis
By Type: Rapeseed Oil Dominance Amid Palm Oil Acceleration
The vegetable oil market demonstrates a clear leadership position for rapeseed oil, which currently commands a substantial 34.68% market share in 2025. This dominance is primarily attributed to robust Canadian production capabilities and increasing U.S. biofuel applications. The strength of this market position is further reinforced by the deep trade integration between the United States and Canada, with Canadian exports accounting for 91% of U.S. canola imports in 2024. This trade relationship gained additional momentum following the EPA's strategic decision in December 2022 to approve canola oil for renewable diesel feedstocks. The industry's confidence in this market is exemplified by Louis Dreyfus Company's significant investment in its Yorkton, Saskatchewan facility, where the annual canola crush capacity will increase to exceed 2 million metric tons.
In parallel market developments, palm oil has emerged as the most dynamic segment, achieving a notable growth rate of 4.21% CAGR through 2031. This growth trajectory is primarily driven by palm oil's competitive cost structure and superior functional properties in food manufacturing applications, although sustainability concerns continue to influence some manufacturers to explore alternative options. The soybean oil segment maintains its significant market position through substantial domestic infrastructure development, with crushing capacity expanding by approximately 23% over a three-year period to accommodate renewable diesel demand. However, this rapid expansion has raised concerns about potential industry overcapacity, as highlighted in recent CoBank analysis reports.

By Nature: Conventional Segment Leadership with Organic Momentum Building
The conventional segment maintains its dominant position with a 79.05% market share in 2025, underpinned by well-established supply chains and significant cost advantages. These advantages enable manufacturers to efficiently serve mass-market food applications and industrial uses, making conventional products the preferred choice for price-sensitive consumers and businesses operating at scale.
In contrast, the organic segment is experiencing notable growth, advancing at a CAGR of 4.58% through 2031. This growth is primarily fueled by increasing consumer willingness to invest in premium products and retailers' strategic expansion of organic private-label offerings. The market demonstrates a clear division between cost-conscious buyers of conventional products and consumers who accept premium pricing for organic alternatives, driven by health and environmental considerations. The organic certification requirements introduce additional supply chain complexities and result in substantial cost differences, with organic variants commanding prices 2-10 times higher than conventional alternativAes, particularly evident in specialty products such as sunflower lecithin.
By End User: Food Industry Dominance Challenged by Biofuel Growth
The food industry maintains a substantial 47.72% market share in 2025, encompassing three primary segments: food processing, foodservice/HoReCa, and retail. These segments continue to shape traditional vegetable oil consumption patterns in the market. Within this dominant category, food processing has established itself as the largest subsegment, experiencing significant growth due to the expansion of the packaged foods sector. The increasing demand for plant-based products has further strengthened this position, as manufacturers require specialized oil formulations to achieve optimal texture, stability, and extended shelf life in their products.
The biofuels segment has emerged as a transformative force in the market, demonstrating robust growth at 4.19% CAGR through 2031. This growth is primarily driven by policy initiatives that have created sustained consumption levels, operating independently of traditional food market cycles. The implementation of the U.S. Renewable Fuel Standard and regional programs, such as California's Low Carbon Fuel Standard, has fundamentally altered the market landscape. These regulatory frameworks have elevated biofuels from a peripheral application to a central demand driver, with industry projections indicating renewable diesel production capacity will reach 5.2 billion gallons by 2025.
Geography Analysis
The United States continues to dominate the North American vegetable oil market, holding a projected 77.56% market share in 2025. This leadership is underpinned by well-integrated supply chains that span oilseed production, processing, and end-use applications, including the renewable diesel sector. The country’s position is further reinforced by supportive policy frameworks such as the Renewable Fuel Standard and state-level clean fuel programs, which ensure steady demand for vegetable oil feedstocks. Soybean oil consumption for biofuels reached 12.5 billion pounds during the 2022/23 marketing year. Additionally, the shift from blender's to producer's credits in January 2025 is expected to boost domestic demand while reducing biofuel imports, driving higher vegetable oil consumption. Infrastructure investments, such as CHS's USD 60 million soybean oil refining expansion in Minnesota and new crush facilities adding over 200 million bushels of annual capacity across the Midwest, reflect strong market confidence. Furthermore, FDA traceability regulations effective January 2026, requiring 24-hour traceability data provision, are likely to benefit larger U.S. processors with advanced technological capabilities.
Mexico is emerging as the fastest-growing segment in the North American vegetable oil market, with a projected CAGR of 4.86% through 2031. This growth is driven by increasing import dependence, necessitated by domestic production challenges and climate-related crop failures. In the first quarter of 2024, Mexican soybean oil imports surged by 263%, as drought conditions significantly reduced domestic corn production to 23.3 million tonnes, marking the lowest level since 2014. Similarly, bean production fell to approximately 688,000 tonnes, further amplifying the need for higher imports of oilseeds and processed oils. These factors highlight Mexico's growing reliance on imports to meet its domestic demand, positioning it as a key growth area in the region.
Canada remains a vital supplier in the North American vegetable oil market, despite facing challenges such as projected sales declines of 3.8% and volume decreases of 8.3% in 2025, following a period of growth driven by biofuel demand. Between 2020 and 2024, Canadian canola oil exports to the U.S. increased by 94%, with Canada accounting for 91% of U.S. canola imports. The EPA's approval of canola oil for biofuel tax credits has shifted U.S. consumption toward industrial applications, which now represent over 50% of total use. However, uncertainties surrounding eligibility for the U.S. Clean Fuel Production Credit (45Z) under the new administration and delays in Canadian biofuel projects pose challenges for the sector. Despite these hurdles, long-term confidence in cross-border trade remains evident, as highlighted by Louis Dreyfus Company's expansion of its Yorkton facility, which has increased canola crushing capacity to over 2 million metric tons. However, Canada's 60% reliance on U.S. markets for grain and oilseed milling sales exposes it to potential trade policy risks.
Regulatory Landscape
Regulation in North America is shaped by food safety, labeling, and renewable fuel programs that influence vegetable oil formulation choices and feedstock allocation. In the United States, FDA actions and FSMA compliance requirements are a central operating constraint, with the FDA Food Traceability Rule taking effect on January 20, 2026, requiring 24-hour access to key traceability records and lot-code level documentation for covered foods. This raises compliance demands across refining, bottling, and ingredient supply chains. Separately, the FDA finalized the revocation of authorization for brominated vegetable oil (BVO) in food, effective August 2024, reinforcing reformulation needs for affected beverage applications and tightening scrutiny on certain oil-derived ingredients.
Alongside food rules, federal and state clean-fuel policies continue to steer large volumes of soybean and canola oils toward renewable diesel. The Renewable Fuel Standard and California's Low Carbon Fuel Standard influence carbon-intensity driven economics and trade flows. In Canada, Health Canada maintains the List of Permitted Food Additives through ongoing updates, while the Food and Drug Regulations (including B.09.010) require vegetable fats and oils used in cooking, salad, or table oils to be declared by common name, supporting clearer labeling practices for multi-oil blends and specialty products moving through cross-border supply chains.
Competitive Landscape
The North American vegetable oil market maintains a balanced competitive environment where established agribusiness leaders hold significant market share while creating space for specialized companies and innovative market entrants. Industry giants such as Archer Daniels Midland, Cargill, and Bunge have built robust business models centered on comprehensive supply chain networks that connect oilseed procurement, processing operations, and distribution channels. These companies have strategically positioned themselves in the renewable diesel feedstock market, fundamentally altering the competitive landscape and creating new business opportunities.
The industry is witnessing substantial business partnerships and technological advancements that are reshaping market dynamics. A notable example is Bunge's USD 800 million collaboration with Chevron for oilseed processing operations in Louisiana, representing how traditional processing companies are forming strategic alliances with energy corporations to capitalize on the expanding biofuel market. In the technology space, companies like Anderson International are implementing advanced processing solutions, including high-shear extrusion systems that maximize oil extraction from high-oleic sunflower seeds through innovative drainage cage designs. The market is also experiencing significant expansion from regional processors, particularly in the Midwest, where multiple new soybean crush facilities are under development, adding more than 200 million bushels to annual processing capacity. However, financial analysts at CoBank have expressed concerns about potential market oversaturation, as capacity growth may exceed sustainable demand levels.
The competitive environment is increasingly influenced by regulatory requirements, particularly the FDA traceability regulations scheduled for implementation in January 2026. These requirements mandate continuous data accessibility and detailed supply chain documentation, creating a business advantage for larger organizations with sophisticated information technology infrastructure. This regulatory framework may present operational challenges for smaller market participants who have not yet developed comprehensive technological capabilities, potentially affecting their competitive position in the market.
North America Vegetable Oil Industry Leaders
-
Archer Daniels Midland Company
-
Cargill Incorporated
-
Bunge Limited
-
Wilmar International Ltd.
-
Louis Dreyfus Company
- *Disclaimer: Major Players sorted in no particular order
Market Opportunities and Future Outlook
Mandate-driven biofuel demand and parallel investment in crushing and refining capacity are creating room for suppliers that can secure traceable, domestic-origin feedstocks and maintain consistent food-grade supply continuity. In June 2026, the U.S. EPA finalized Renewable Volume Obligations for 2026-2027, indicating a step-up in biomass-based diesel feedstock demand for 2026 versus 2025. At the same time, the Clean Fuel Production Credit (45Z), effective January 2026, raises the value of verified supply chains and carbon-accounted sourcing. USDA indicators also point to more raw material moving through the chain, with April 2026 soybean crush at 6.55 million tons (218 million bushels) versus 6.07 million tons (202 million bushels) in April 2025, and April 2026 canola seed crush at 202,906 tons versus 161,022 tons in April 2025.
For food and ingredients, the main opportunities center on premiumization and compliance-enabled product differentiation. Demand for non-GMO and organic oils, along with specialty performance oils such as high-oleic types used by food manufacturers and personal care formulators, aligns with tighter ingredient scrutiny and increasing traceability expectations. This tends to favor processors that can document identity preservation and sustainability attributes at scale. Mexico's rising import reliance also supports growth in regional trading, bulk handling, and packaging formats for industrial buyers, particularly when suppliers can deliver stable specifications and consistent availability despite competing biofuel pull in the United States and Canada.
Recent Industry Developments
- May 2026: Louis Dreyfus Company launched a regenerative agriculture program in Saskatchewan in partnership with PepsiCo, focused on canola. The initiative improves traceability and sustainability credentials for a key North American vegetable oil feedstock and supports differentiated supply for food manufacturers.
- February 2025: Coast Packing Company began construction on a USD 60 million edible fats and oils refinery and packaging facility in Amarillo, Texas, with an opening planned for summer 2026. The project adds regional refining and packaging capacity aimed at retail and commercial channels, improving supply flexibility for edible fats and oils used in food applications.
- September 2024: Bunge began construction on a USD 225 million expansion of its tropical and specialty oils refinery in Avondale, Louisiana, designed to triple throughput to 6,000 standard rail cars per year with commissioning scheduled for end-2025. The expansion increases North American processing capacity for imported and specialty oils and supports larger-scale supply into food manufacturing and industrial customers.
Research Methodology Framework and Report Scope
Market Definition and Coverage
This market covers the value of vegetable oils sold in North America for food and non-food uses, measured at the point where refined, blended, or packaged oil is supplied to end users or downstream channels.
Scope exclusions: We exclude animal fats, butter, and dairy-based fats, and we also exclude oilseed meals and other by-products that are not sold as vegetable oil.
Segmentation Overview
- By Type
- Palm Oil
- Soybean Oil
- Rapeseed Oil
- Sunflower Oil
- Peanut Oil
- Coconut Oil
- Olive Oil
- Other Types
- By Nature
- Conventional
- Organic
- By End User
- Food Industry
- Food Processing Industry
- Margarine and Spreads
- Snacks Foods
- Ready Meals
- Others
- Foodservice/HoReCa
- Retail
- Food Processing Industry
- Animal Feed
- Pharmaceutical
- Biofuels
- Beauty and Personal Care
- Others
- Food Industry
- By Geography
- United States
- Canada
- Mexico
- Rest of North America
Data Sources, Market Sizing, and Validation
Desk Research
Desk work starts by grounding the model in traceable supply and demand signals across the United States, Canada, and Mexico. We rely on public statistics and reference tables such as USDA oilseeds and oils balances, US Census Bureau manufacturing and trade tables, Statistics Canada industrial and trade releases, and Mexico INEGI production indicators (with customs series used where relevant). When trade context matters, we also review sources such as UN Comtrade and tariff schedules to keep product mapping consistent.
After the core data is framed, we layer in company annual reports, investor presentations, and sustainability or capacity announcements to understand shifts in crushing, refining, and imports. We also use patent databases to spot process changes that can influence yields or product mix, and an import-export shipment-level database is referenced selectively to sanity check trade direction and major route changes. The desk sources listed here are illustrative, and many other public datasets and documents are also reviewed for data collection, clarification, and cross-checking.
Primary Interviews and Surveys
Primary work is used to pressure test the desk model, especially where public data lags or categories are blended. We speak with processors, refiners, distributors, large food manufacturers, foodservice buyers, and industry advisors across North America, so assumptions on product mix, pricing behavior, and substitution can be confirmed and adjusted during the interview process.
Distribution of primary research fieldwork respondents
| Company type | Respondent position |
|---|---|
| Top tier: 36% | CXOs: 17% |
| Mid tier: 46% | Functional/Unit leaders: 34% |
| Smaller Players: 18% | Managers: 49% |
Market-Sizing & Forecasting
The sizing starts with a top-down build where production, crush, and trade data are used to reconstruct the North America availability pool for key vegetable oils, and then the pool is converted into value using observed price benchmarks and mix assumptions. To keep the totals practical, we corroborate results using selective bottom-up approximations, such as sampled volume by oil type multiplied by average selling prices from channel checks, and then we adjust where gaps show up.
A few inputs that matter in this market include oilseed crush volumes, import dependence for certain oils, shifts in food versus industrial use, changes in foodservice demand, and relative pricing between soybean, canola, sunflower, and palm oils. Because substitution is common, we track spread movements and how quickly buyers switch blends, and then we translate that into mix changes in the model. For forecasting, we run scenario analysis based on a short list of drivers agreed by interviewees, including expected crush capacity utilization, trade policy signals, and likely price normalization from recent volatility. Where a bottom-up checkpoint cannot cover a niche oil or a small country flow, the gap is handled through proportional allocation using trade codes and usage shares validated in interviews.
Data Validation & Update Cycle
Outputs are checked against independent signals like reported crush totals, import and export direction, and stated capacity moves, before a final number is signed off. If an oil type grows faster than the related supply signal, or if price movements look out of line with common benchmarks, we recheck the inputs and trigger follow-up calls.
Reviews happen in steps, with model logic inspected first and assumptions reviewed next, and then results are compared across countries for reasonableness. Reports are refreshed annually, with interim updates made when material events occur, such as large policy changes, supply disruptions, or major capacity additions. Before delivery, a final pass is completed so the published figures reflect the latest available public data and validated assumptions.
Mordor Intelligence's North America Vegetable Oil Market Size Compared Against Other Published Estimates
Published market numbers for vegetable oil in North America can look far apart because the underlying scope choices are not always the same, and because pricing and mix assumptions can be handled differently. Differences also show up when one study leans more on retail cooking oil sales, while another leans on bulk industrial volumes, which can change the value total quickly.
The main gap comes from whether industrial uses and bulk trade-linked volumes are counted as part of the market, where Mordor Intelligence treats the total value as refined and supplied vegetable oil across both food and non-food demand pools, with prices aligned to the year-specific mix by oil type. Some other estimates also apply a single average price across the region, or they extend the scope into adjacent fats and specialty oils, which can inflate or compress the size depending on the year selected.
Benchmark comparison
| Source | Market Size | Gaps in Research Methodology |
|---|---|---|
| Mordor Intelligence | USD 50.87 B (2025) | |
| Regional Consultancy A | USD 93.74 B (2025) | Often folds in a wider edible oils basket and applies a broader revenue definition that can include retail markups and adjacent categories beyond vegetable oil, which lifts the value level. |
| Trade Journal B | USD 21.50 B (2024) | Typically centers on consumer cooking oil sales only, thereby leaving out bulk food manufacturing and industrial demand, and it may use a narrower channel-based price set. |
The spread in the table is mostly explained by what gets included and where pricing is applied in the value chain. When scope is kept consistent to vegetable oil supplied in the region and mix and pricing are refreshed to match the base year, the result is easier to trace back to clear volume and price drivers and to replicate over time.
Key Questions Answered in the Report
What is the current value of the North America vegetable oil market?
The market is valued at USD 52.58 billion in 2026 and is projected to reach USD 62.07 billion by 2031.
Which oil type leads sales in the region?
Rapeseed (canola) oil holds the largest 34.68% share of regional sales, supported by integrated U.S.–Canadian supply chains.
How fast is vegetable-oil demand from biofuels growing?
Biofuel applications are expanding at a 4.19% CAGR through 2031, outpacing growth in food, feed and industrial uses.
Why are organic and non-GMO oils gaining popularity?
Higher-income consumers seek clean-label and sustainability assurances, pushing organic oil revenues to a projected 4.58% CAGR.
Which country will grow fastest through 2031?
Mexico is forecast to record a 4.86% CAGR as drought-related crop shortfalls heighten import reliance on soybean and palm oils.