
North America Urban Security Screening Market Size and Share
Market Overview
| Study Period | 2020 - 2031 |
|---|---|
| Forecast Data Period | 2026 - 2031 |
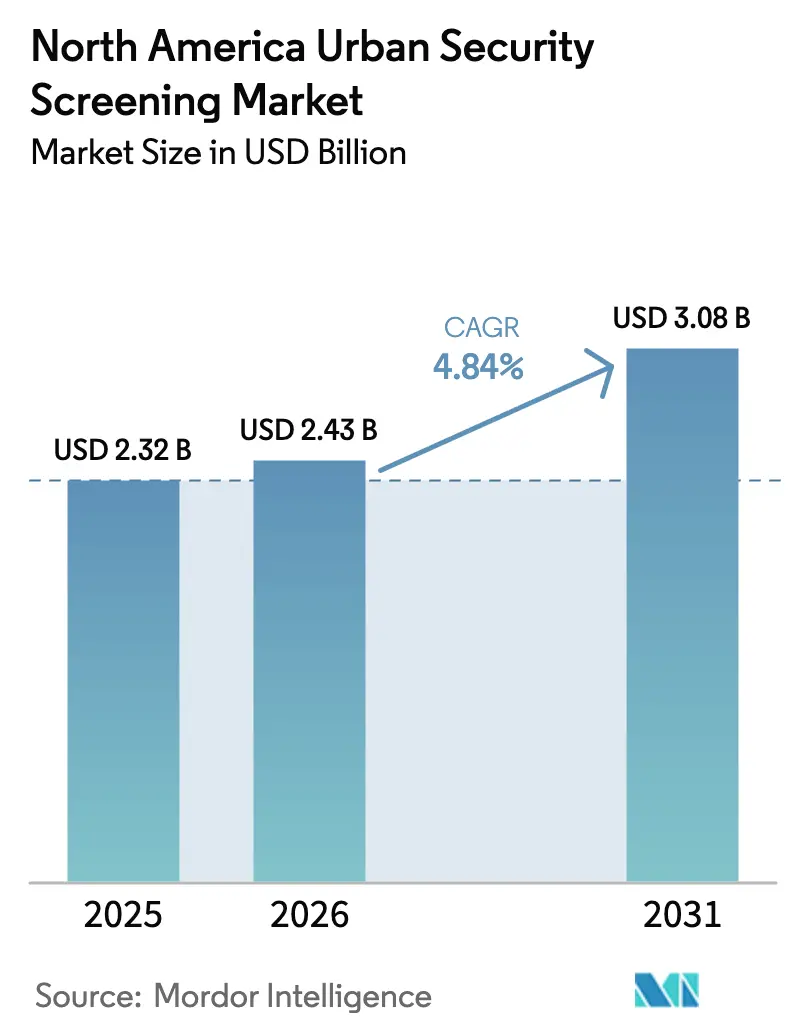
| Base Year Market Size (2025) | USD 2.32 Billion |
| Market Size (2026) | USD 2.43 Billion |
| Market Size (2031) | USD 3.08 Billion |
| Growth Rate (2026 - 2031) | 4.84% CAGR |
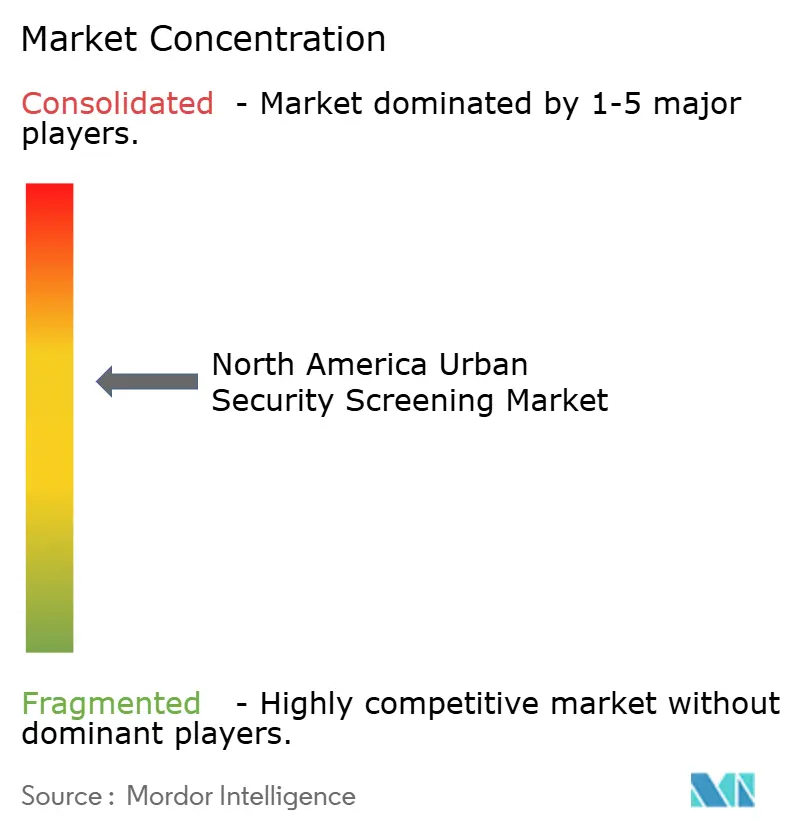
| Market Concentration | Medium |
Major Players *Disclaimer: Major Players sorted in no particular order Image © Mordor Intelligence. Reuse requires attribution under CC BY 4.0. | |
North America Urban Security Screening Market Analysis by Mordor Intelligence
The North America urban security screening market size was valued at USD 2.32 billion in 2025 and estimated to grow from USD 2.43 billion in 2026 to reach USD 3.08 billion by 2031, at a CAGR of 4.84% during the forecast period (2026-2031). Growing demand for threat-focused solutions rather than large-scale hardware roll-outs is guiding purchase decisions, while artificial intelligence (AI) now dictates competitive differentiation. Transportation hubs, federal facilities, and data-rich enterprises are directing budgets toward multi-sensor systems that cut false alarms without slowing foot traffic, as illustrated by the Transportation Security Administration’s (TSA) computed-tomography roll-out across 430 U.S. checkpoints in late 2024. Enterprises are also shifting to flexible, subscription-based analytics that stretch capital budgets and embed continuous updates. Meanwhile, component shortages and geopolitical frictions continue to lengthen equipment lead times, nudging buyers toward suppliers with diversified production footprints. Supply-side vendors that can verify robust cybersecurity architectures are gaining preference as screening devices become networked assets.
Key Report Takeaways
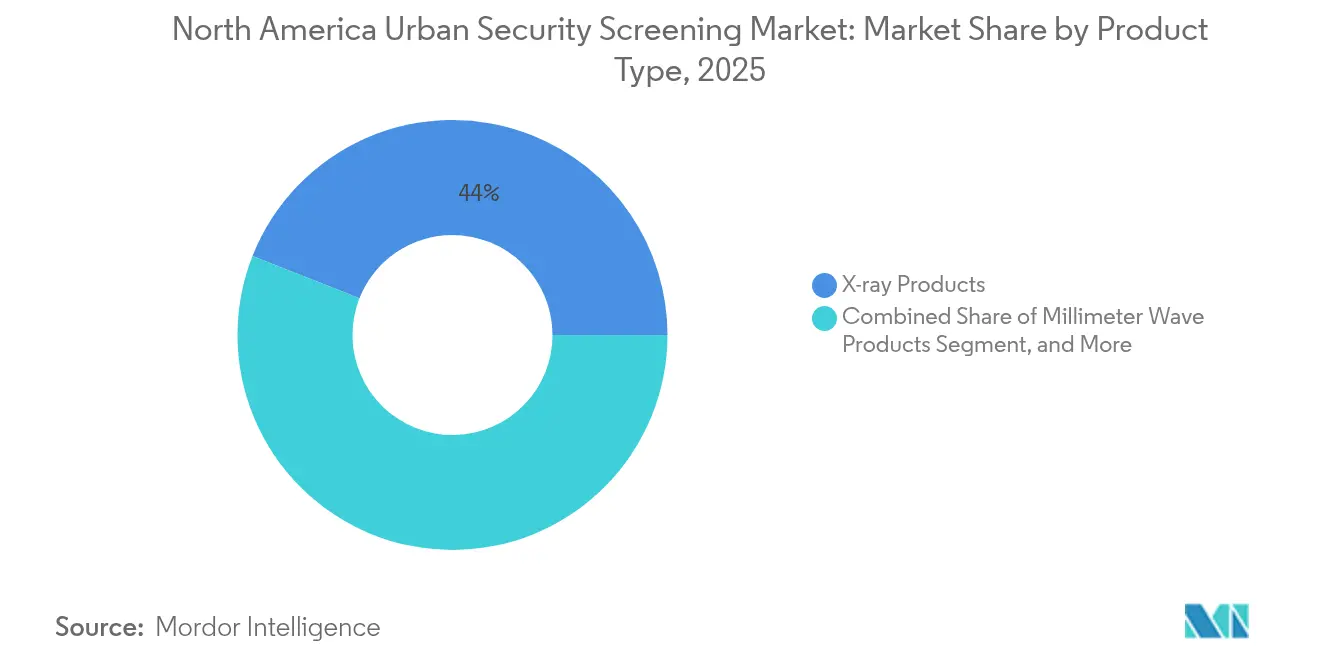
- By product type, X-ray products led with 44.02% of the North America urban security screening market share in 2025; AI-powered multi-sensor systems are projected to expand at a 6.21% CAGR through 2031.
- By end-user industry, the transportation segment held 32.35% revenue share of the North America urban security screening market in 2025, while data centers are poised to accelerate at a 6.49% CAGR to 2031.
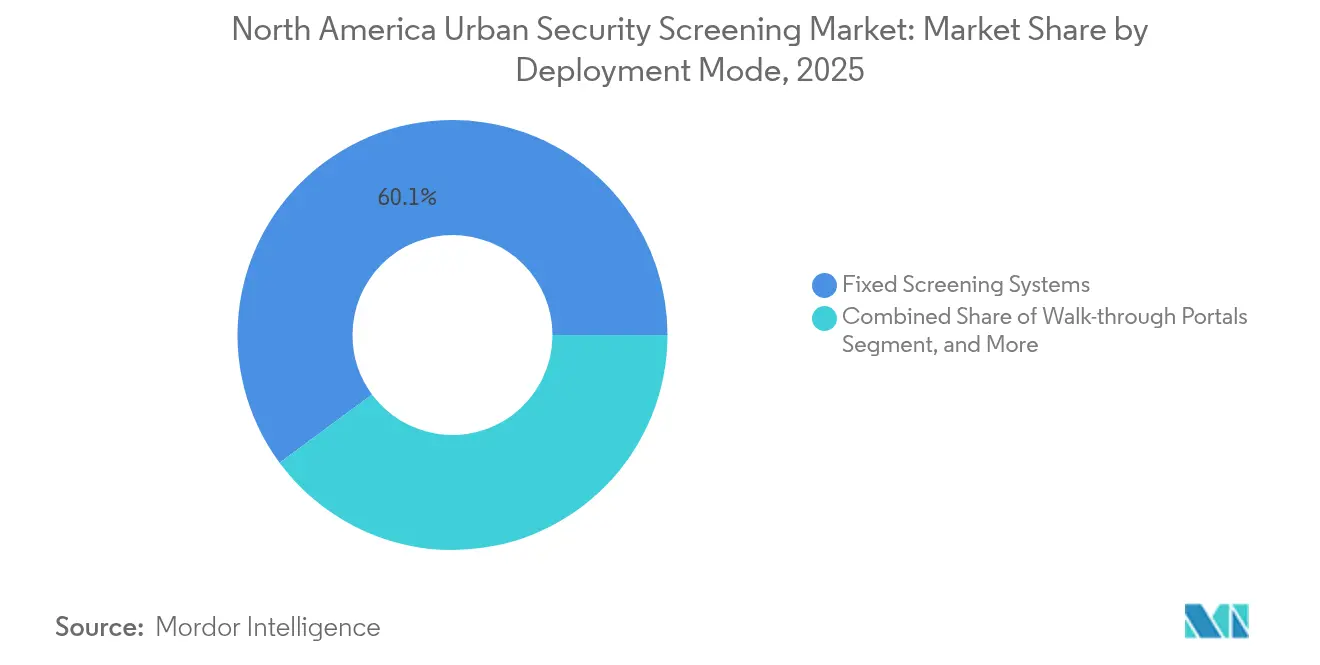
- By deployment mode, fixed screening systems accounted for 60.12% share of the North America urban security screening market size in 2025, and portable or handheld devices are on track for a 5.82% CAGR through 2031.
- By technology, conventional imaging captured a 53.92% share of the North America urban security screening market in 2025, whereas terahertz imaging is advancing at a 5.92% CAGR through 2031.
- By country, the United States held an 81.95% share of the North America urban security screening market in 2025, and Mexico is expected to post the fastest 6.01% CAGR during the forecast period.
Note: Market size and forecast figures in this report are generated using Mordor Intelligence’s proprietary estimation framework, updated with the latest available data and insights as of 2026.
North America Urban Security Screening Market Trends and Insights
Drivers Impact Analysis*
| Driver | (~) % Impact on CAGR Forecast | Geographic Relevance | Impact Timeline |
|---|---|---|---|
| Increasing automation in security screening to detect advanced threats | +1.2% | North America, with concentrated impact in US federal facilities | Medium term (2-4 years) |
| Upsurge in terror activities across the region | +0.8% | Global, with heightened focus on transportation hubs and government buildings | Short term (≤ 2 years) |
| Increasing government initiatives on security inspection in schools and colleges | +0.6% | US and Canada, with state-level implementation variations | Long term (≥ 4 years) |
| Increasing government initiatives for smart cities | +0.5% | Major metropolitan areas across North America | Long term (≥ 4 years) |
| Rapid adoption of AI-based analytics reducing false alarms | +0.9% | North America, with early adoption in high-traffic facilities | Medium term (2-4 years) |
| Integration of touchless biometric screening driven by hygiene norms | +0.4% | North America, with emphasis on corporate and healthcare facilities | Medium term (2-4 years) |
| Source: Mordor Intelligence | |||


Increasing Automation in Security Screening to Detect Advanced Threats
The Department of Homeland Security allocated USD 45 million in 2024 to automate threat recognition, signaling a decisive pivot toward machine-driven detection.[1]Department of Homeland Security, “Automated Threat Recognition Research Awards,” dhs.gov Automated systems now identify chemical traces in 3 seconds versus 30 seconds for manual analysis, cutting operator training costs by 40%. CT algorithms embedded in shoe scanners allow passengers to keep their footwear on, speeding lane throughput. AI models that self-learn from new threat data reduce the need for engineering updates. TSA’s automated-screening-lane standards are pushing private venues to adopt similar capabilities, ensuring sustained demand across public and commercial sites.
Upsurge in Terror Activities Across the Region
The Federal Bureau of Investigation recorded a 23% jump in domestic terrorism investigations in 2024.[2]Federal Bureau of Investigation, “Domestic Terrorism Investigations 2024,” fbi.gov Organizations are therefore layering perimeter screening with interior surveillance for holistic protection. Budget allocations have migrated from reactive barricades to predictive analytics that flag anomalous behavior. Demand for mobile screening vehicles has surged as firms position checkpoints farther from critical assets to counter vehicle-borne explosives. Insurers now request documented security processes before extending coverage, reinforcing market demand.
Increasing Government Initiatives on Security Inspection in Schools and Colleges
Several U.S. states earmarked funds in 2025 for campus screening upgrades, including walk-through portals fitted with threat analytics. Districts value systems that can distinguish between everyday objects and weapons, thereby minimizing student inconvenience. Vendor partnerships with educational authorities are shifting procurement toward managed-service contracts, easing maintenance burdens on school boards. Canadian provinces are piloting AI-enabled bag scanners that send alerts directly to campus security apps, an approach expected to gain traction over the next four years. These initiatives widen the addressable base of the North America urban security screening market.
Increasing Government Initiatives for Smart Cities
Municipal authorities linking traffic management, public safety cameras, and security screening into unified control centers are opening new tenders for connected scanners. Edge-compute architectures that process data locally comply with stringent privacy bylaws. Interoperability standards adopted by city planners favor vendors that offer open-API screening devices. As urban development programs unlock federal grants, integrators are bundling screening hardware with IoT-enabled street furniture, creating recurring analytics revenue.
Restraints Impact Analysis*
| Restraint | (~) % Impact on CAGR Forecast | Geographic Relevance | Impact Timeline |
|---|---|---|---|
| Supply chain issues caused by geopolitical scenario and the COVID-19 pandemic | -0.7% | Global supply chains affecting North American deployments | Short term (≤ 2 years) |
| High installation and maintenance costs | -0.5% | North America, particularly affecting small to medium enterprises | Medium term (2-4 years) |
| Public privacy concerns over advanced imaging technologies | -0.3% | US and Canada, with regulatory compliance requirements | Long term (≥ 4 years) |
| Limited cybersecurity safeguards in networked screening devices | -0.4% | North America, with emphasis on critical infrastructure protection | Medium term (2-4 years) |
| Source: Mordor Intelligence | |||
Supply Chain Issues Caused by Geopolitical Scenario and the COVID-19 Pandemic
Export restrictions on advanced imaging components announced in 2024 pushed lead times from 12 weeks to 20 weeks.[3]Bureau of Industry and Security, “Export Administration Regulations Updates,” bis.doc.gov Semiconductor shortages forced manufacturers to re-engineer boards around readily available chipsets. Firms are carrying 15-25% higher inventory to buffer delays, inflating working capital needs. OSI Systems expanded U.S. manufacturing to hedge geopolitical risk, a trend expected to tighten margins yet stabilize availability. Buyers increasingly choose vendors with multi-region assembly lines, influencing competitive positioning within the North America urban security screening market.
High Installation and Maintenance Costs
A single Liberty Defense HEXWAVE unit costs USD 150,000-200,000, and annual service fees equal 12-15% of the purchase price. Facility retrofits, operator certification, and software licenses can double the five-year ownership cost. To mitigate sticker shock, manufacturers promote leasing and subscription models that convert capital outlays into operating expenses. Mid-market customers appreciate bundled uptime guarantees, yet premium technical support remains unavoidable due to complex sensor suites.
*Our forecasts treat driver/restraint impacts as directional, not additive. The impact forecasts reflect baseline growth, mix effects, and variable interactions.
Segment Analysis
By Product Type: AI Integration Drives Technology Evolution
X-ray equipment maintained 44.02% of the North America urban security screening market share in 2025, thanks to entrenched standards in aviation, logistics, and public venues. The segment’s maturity results in robust resale networks and trained operator pools. Even so, the North America urban security screening market is pivoting toward capability-rich AI-powered multi-sensor systems, which are expected to rise at a 6.21% CAGR through 2031. Vendors embed convolutional neural networks that classify threat signatures in milliseconds, shrinking manual intervention. Metal detectors continue to secure stadium perimeters, while millimeter-wave scanners gain traction where radiation exposure concerns limit X-ray usage. Radiation detection units ride on heightened radiological threat awareness among government agencies. Trace detection models expand into narcotics and chemical warfare agent discovery, widening addressable demand.
Incorporating AI into legacy X-ray machines extends asset life and delivers analytics without large capital swaps. Smiths Detection rolled out a CT shoe scanner that integrates with existing lanes and reduces divestiture time. Meanwhile, open architecture interfaces permit third-party analytics overlays, encouraging best-of-breed ecosystems. This modularity sustains hardware sales while shifting value creation toward software subscriptions. Consequently, product lines that converge X-ray, trace, and radiation sensors into a unified console are seeing faster purchase cycles.


By End-User Industry: Data Centers Lead Growth Acceleration
Transportation facilities controlled 32.35% revenue in 2025, reflecting regulatory mandates and continuous passenger flows. Yet data centers headline growth with a projected 6.49% CAGR. Physical breaches jeopardize uptime and compliance obligations under frameworks such as ISO 27001, catalyzing investment in biometrics and AI detectors. A Johnson Controls survey noted that 67% of data facilities recorded unauthorized access attempts in 2024. Corporate campuses also allocate funds to visitor management solutions that merge identity verification with screening gates.
Mailrooms have evolved from simple tunnel X-rays to integrated chemical sensors after headline package incidents. Warehouse and logistics operators favor mobile scanners that relocate with loading patterns, underscoring the North America urban security screening market’s shift toward flexibility. Government buildings remain steady purchasers, although budget ceilings push agencies to evaluate the total cost of ownership rigorously. Law-enforcement sites demand contraband-capable devices that withstand rugged usage. Stadiums and event venues opt for portable portals to deal with seasonal spikes, cementing the case for rental and managed-service models.
By Deployment Mode: Mobility Gains Strategic Importance
Fixed systems held a 60.12% share in 2025 and remain the backbone for airports and courthouses. However, portable and handheld devices are set to register a 5.82% CAGR through 2031 as organizations value rapid redeployment during threat escalations. The North America urban security screening market size for mobile devices is boosted by Department of Homeland Security specifications that emphasize small-form chemical analyzers for field teams. Walk-through portals now incorporate sensor fusion, differentiating between hand tools and lethal weapons to curb alarms.
Vehicle-mounted platforms address border zones and petrochemical plants that require flexible checkpoints. UVeye’s under-vehicle imaging, deployed at North American sites in 2024, demonstrated minimal civil-works requirements and quick roll-out. Even permanent sites choose modular frames to future-proof investments. The adoption of 5G modems inside mobile units allows real-time upload of scan images to command centers, providing instant escalation paths.
By Technology: Conventional Systems Face AI Disruption
Conventional imaging technologies accounted for 53.92% of the North America urban security screening market share in 2025, yet terahertz imaging is poised for a 5.92% CAGR. Terahertz systems locate ceramics, liquids, and plastics without depicting anatomical features, easing privacy concerns in schools. Toshiba’s 2024 millimeter-wave radar advances boosted throughput by lifting scan speed from 0.5 seconds to 0.2 seconds. Meanwhile, AI-based threat detection is migrating from an add-on to a baseline functionality.
Machine-learning upgrades extend the life cycles of legacy equipment, letting operators upload new neural-network weights without board changes. RFID and IoT tagging create event logs that integrate screening alerts with access-control decisions. Standardization work by the International Electrotechnical Commission is harmonizing performance criteria, enabling multi-vendor environments. This evolution broadens vendor competition yet anchors value in software capability rather than hardware alone.
Geography Analysis
The United States underpins the North America urban security screening market with its 81.95% share in 2025. Federal commitments, exemplified by the USD 781 million computed-tomography deployment across 430 TSA checkpoints, guarantee baseline demand. Corporate sectors mirror government investments by adopting predictive algorithms that maintain security while lowering staffing overheads. Ongoing Department of Homeland Security research grants ensure a pipeline of next-generation capabilities.
Canada’s growth reflects targeted modernization. The Canada Border Services Agency is piloting facial recognition at land crossings, complementing the Canadian Air Transport Security Authority’s biometric gates. Privacy laws steer buyers toward edge-processing scanners. Provincial variance adds procurement complexity, yet vendors that tailor configurations to local statutes gain footholds. Smart-city pilots in Toronto and Vancouver integrate screening data with urban analytics dashboards, amplifying use cases.
Mexico is recording the fastest 6.01% CAGR. Border-industrial corridors require robust inspection systems to protect supply-chain continuity. Government directives now pair cybersecurity standards with physical screening requirements, promoting integrated acquisitions. As free-trade zones expand, customs authorities push for standardized protocols that accelerate throughput while detecting contraband. Local manufacturing plants also deploy portable scanners to mitigate intellectual-property theft. Combined, these drivers unlock sustained potential within the North America urban security screening market.
Regulatory Landscape
In the United States, the Transportation Security Administration (TSA) sets and enforces passenger and property screening requirements under 49 USC 44901, which frames baseline technical and operational expectations for checkpoint systems and the vendors that supply them. TSA guidance such as the Checkpoint Requirements and Planning Guide and the agency's Open Architecture Roadmap is pushing buyers and integrators toward interoperable solutions, while federal qualification practices, including Qualified Product List approaches for Advanced Imaging Technology, act as a gatekeeper for deployment in regulated aviation environments.
Policy actions are also widening the compliance surface beyond airports. The SAFER SKIES Act, signed on December 18, 2025 (codified under 6 USC 124n), established a tiered framework authorizing eligible state, local, tribal, and territorial entities to conduct counter-UAS operations, reinforcing demand for integrated security approaches at urban venues and critical infrastructure where screening systems sit within broader protection programs. On the cybersecurity side, federal requirements tied to FISMA and NIST 800-53/800-82 increasingly show up in procurement language as screening devices become network-connected assets. TSA budget priorities highlighted in its FY2026 justification, including CT machines and biometrics funding lines, further reinforce modernization pressures across the region.
Value Chain Analysis
The value chain starts with component and subsystem suppliers, including imaging detectors, X-ray sources, compute modules, and embedded cybersecurity, and moves to OEMs that design and manufacture screening devices such as X-ray, millimeter wave, trace and chemical detection, and AI-enabled multi-sensor platforms. Software providers then supply threat-detection analytics, device management, and integration layers. System integrators and facility engineering partners adapt equipment to site constraints, including power, shielding, network segmentation, and lane design. Service organizations complete the loop through calibration, preventive maintenance, software updates, and operator training, which can be material to total lifecycle cost in urban deployments.
Public-sector processes, especially for aviation and federally influenced programs, strongly shape procurement and deployment. TSA uses tools such as its Checkpoint Requirements and Planning Guide to standardize checkpoint design inputs and deployment planning, while its Open Architecture Roadmap promotes interoperability that affects how OEMs expose data interfaces and how integrators assemble multi-vendor systems. Formal solicitations and contracting pathways, including programs posted via SAM.gov such as screening equipment deployment services efforts, create a structured path from requirements definition to installation and sustainment. Qualification mechanisms, including TSA lists for approved technologies, influence which products move from pilots into scaled rollouts.
Competitive Landscape
The competitive fabric remains moderately fragmented. Incumbents such as Smiths Detection and OSI Systems leverage established certifications and after-sales networks. Evolv Technologies and Liberty Defense differentiate through AI-centric platforms promising lower false positives and faster deployment.[4]Evolv Technologies, “2024 Performance Update,” evolvtechnology.com The strategic shift from one-time hardware sales to subscription analytics is rebalancing revenue streams. Patent filings covering AI threat-classification climbed 34% in 2024, reflecting intensified R&D.
Vendor strategies emphasize vertical integration. OSI Systems’ USD 81 million vehicle-inspection contract illustrated scale benefits in winning public tenders. Simultaneously, mid-market opportunities entice niche suppliers offering plug-and-play devices bundled with managed services. Standards harmonization by the International Electrotechnical Commission narrows hardware variation, pushing firms to compete on software features such as adaptive algorithms and secure cloud links.
Supply-chain resilience emerges as a selling point. Manufacturers boosting North American assembly assure buyers of timely fulfillment amid geopolitical turbulence. Cyber-hardening of firmware, along with independent penetration tests, is now mandatory in many bid documents. Players that provide secure update mechanisms and zero-trust architectures gain a competitive lift. Overall, evolution toward software-defined value is reshaping rivalry within the North America urban security screening market.
North America Urban Security Screening Industry Leaders
3DX-Ray Ltd. (Image Scan Holdings PLC)
Astrophysics Inc.
Bruker Corporation
CEIA SpA
Evolv Technologies Holdings Inc.
- *Disclaimer: Major Players sorted in no particular order

Market Opportunities and Future Outlook
One clear whitespace is the expansion of screening beyond federally regulated airport checkpoints into high-throughput urban venues that prioritize frictionless entry, supported by subscription analytics and operational workflows. Evolv Technologies' multi-year venue contracts and renewals for systems at Crypto.com Arena (Los Angeles) and TD Garden (Boston) point to stadium and large-venue adoption shifting from trial deployments to standardized, multi-year operating models that combine hardware with ongoing software and service layers. This venue-led pattern also feeds adjacent opportunities in corporate campuses and mixed-use facilities, where buyers seek similar throughput and staffing efficiency but need configurable privacy and cybersecurity controls.
Modernization programs tied to federal procurement practices also open room for vendors that can meet open-architecture integration requirements and federal cyber controls while delivering measurable throughput improvements. TSA priorities outlined in its FY2026 budget justification, including CT machines, biometrics, and checkpoint automation funding lines, keep technical roadmaps aligned to CT-based imaging and identity-linked screening. That focus then carries into non-aviation segments adopting operational concepts such as automated threat recognition and lane automation. On the government demand side, large DHS-linked awards, including the June 23, 2026 Department of Homeland Security contract awarded to Astrophysics Inc. (USD 110.6 million), reinforce the scale of public-sector procurement and provide a pathway for new capabilities, certifications, and manufacturing readiness to diffuse into broader urban use cases, including cargo, mailroom screening, and critical infrastructure access points.
Recent Industry Developments
- June 2026: 3DX-Ray Ltd's AXIS CXi mailroom screening system was selected to protect a government facility in Lithuania. The deployment shows AI-enabled mailroom capability in critical infrastructure and supports the company's government-contract trajectory.
- April 2026: Astrophysics Inc received TSA approval for its Multi-View CT cargo scanning system, the first TSA-approved CT solution for palletized cargo on ACSTL. The regulatory milestone supports broader deployment in the US cargo security market.
- April 2026: 3DX-Ray Ltd's sale of ThreatScan LSC portable X-ray inspection system to a critical national infrastructure customer in the Middle East. The expansion widens the portable screening footprint in high-security environments and reinforces a software-integrated hardware strategy.


Research Methodology Framework and Report Scope
Market Definition and Coverage
This market covers revenue generated from urban security screening solutions used to detect and deter threats in public and semi-public spaces across North America, including equipment, supporting software, and related services sold for screening workflows.
Scope exclusions: Military battlefield systems, pure cybersecurity tools, and general video surveillance that is not used for screening and access-check workflows are excluded.
Segmentation Overview
- By Product Type
- X-ray Products
- Millimeter Wave Products
- Metal Detectors
- Radiation Detection Products
- Chemical and Trace Detection Products
- AI-Powered Multi-Sensor Systems
- By End-User Industry
- Corporate Buildings
- Mailroom Screening
- Warehouse and Logistics
- Government Buildings
- Transportation
- Data Centers
- Law Enforcement
- Stadiums and Large Venues
- Other End-User Industries
- By Deployment Mode
- Fixed Screening Systems
- Portable / Handheld Screening Devices
- Walk-through Portals
- Vehicle-mounted Screening Units
- By Technology
- Conventional Imaging
- Artificial Intelligence-based Threat Detection
- Machine Learning Enhanced Analytics
- Terahertz Imaging
- RFID and IoT Integration
- By Country
- United States
- Canada
- Mexico
Data Sources, Market Sizing, and Validation
Desk Research
Desk research was used to build the baseline demand picture and to set realistic ranges for deployment and replacement cycles across the United States, Canada, and Mexico. We referenced public procurement and policy signals that shape screening adoption in urban settings, then reviewed technology and performance direction so we did not assume uniform upgrade rates.
Sources typically used include publicly available materials such as TSA publications and budget justifications, US DHS and FEMA program pages, US Bureau of Transportation Statistics for passenger and facility throughput indicators, Statistics Canada releases for infrastructure and public safety spending cues, and standards guidance from bodies such as NIST. These were complemented with company filings, investor presentations, reputable press, patent databases for technology intensity, and an import-export shipment-level database for directional checks on equipment movement. The sources listed here are illustrative and not exhaustive, and many other public and paid references were used for data collection, validation, and clarification.
Primary Interviews and Surveys
Primary work was used to test what is actually being purchased and replaced, and how pricing moves when capabilities shift (for example, AI-assisted detection and multi-sensor setups). We spoke with a mix of manufacturers, channel partners, installers, and end users such as transit operators, venue operators, and public facility security teams, keeping coverage balanced across the United States, Canada, and Mexico.
Distribution of primary research fieldwork respondents
| Company type | Respondent position | Region |
|---|---|---|
| Top tier: 27% | CXOs: 15% | |
| Mid tier: 55% | Functional/Unit leaders: 41% | |
| Smaller Players: 18% | Managers: 44% |
Market-Sizing & Forecasting
Sizing was built using a top-down approach where public venue counts and throughput indicators were used to reconstruct an addressable screening demand pool, which was then adjusted by observed adoption and refresh patterns for different urban sites. To keep totals realistic, the results were cross-checked with selective bottom-up approximations like sampled price per lane or checkpoint, typical unit mixes, and channel feedback on annual shipment momentum.
Key inputs used in the model included (as examples) checkpoint or lane density at high-traffic locations, replacement cycles for walkthrough and imaging equipment, the share of upgrades shifting to advanced screening configurations, service and maintenance attach rates, and average selling price movement as software features expand. Where direct unit visibility was limited, gaps were handled using conservative penetration ranges that were reviewed with interviewees, and then normalized so country totals aligned with procurement and infrastructure signals.
For forecasting, scenario analysis was used so different budget and threat-readiness conditions could be expressed without forcing a single aggressive path. Assumptions on upgrade timing, price progression, and service share were refined with primary feedback, and then applied consistently across the forecast window.
Data Validation & Update Cycle
Validation was done through multiple checks, starting with whether implied spending per site looked reasonable and then moving to country-level reconciliation against independent signals like procurement announcements, public funding programs, and replacement cadence indicators. Outliers were flagged, assumptions were revisited, and follow-up calls were triggered when a variable moved outside the agreed range.
Before sign-off, the model and written conclusions go through step-by-step analyst review so arithmetic, scope logic, and year-to-year transitions are consistent. Reports are refreshed annually, and interim updates are made when material events occur that can change budgets, deployment pace, or pricing. Right before delivery, a final pass is completed so the numbers reflect the latest available information.
Mordor Intelligence's North America Urban Security Screening Market Sizing Compared With Other Published Estimates
Published market sizes for urban security screening in North America can vary because the counted products and end locations are not always the same, and because the base year and pricing assumptions are refreshed at different times. Differences also show up when one estimate leans more on shipment proxies while another leans on installed base and replacement cycles.
The main gap comes from whether airport checkpoint equipment and broader perimeter security spend are folded into the same bucket, where Mordor Intelligence counts urban screening only when it is tied to people or item screening workflows in public and semi-public facilities, with service revenue included only when it is directly attached to those deployments.
Benchmark comparison
| Source | Market Size | Gaps in Research Methodology |
|---|---|---|
| Mordor Intelligence | USD 2.32 B (2025) | |
| Trade Journal A | USD 3.10 B (2025) | Uses a wider definition that blends general security screening with airport upgrades and adjacent perimeter security spend, which inflates the counted demand pool for urban locations. |
| Regional Consultancy B | USD 1.75 B (2024) | Relies more on conservative procurement-only tracking and excludes recurring service and software-related revenue, and it also uses an earlier base year with limited price progression. |
The spread in the table is mostly explained by scope and what gets counted as screening versus broader security, followed by timing differences in base year pricing. By keeping inputs tied to observable facility demand signals and by documenting how service and software are attached to deployments, the approach stays repeatable and easier to reconcile when new procurement or upgrade waves occur.


Key Questions Answered in the Report
What is the current value of the North America urban security screening space and where is it headed by 2031?
Spending reached USD 2.43 billion in 2026 and is forecast to rise to USD 3.08 billion by 2031 on the back of a 4.84% CAGR.
Which product category is posting the swiftest expansion?
AI-powered multi-sensor systems are projected to advance at a 6.21% CAGR through 2031, outpacing all other product lines.
Where are buyers channeling the largest share of budgets today?
Transportation facilities still absorb the leading 32.35% revenue share, supported by federal mandates such as TSA’s computed-tomography roll-out.
Which end-user group is predicted to accelerate fastest over the next five years?
Data centers are expected to grow at a 6.49% CAGR as operators strengthen physical defenses against rising cyber-physical threats.
How are supply-chain disruptions shaping procurement strategies?
Extended lead times and component shortages are prompting organizations to favor vendors with North American assembly, diversify supplier lists, and adopt subscription models that lower upfront outlays.
Which country is likely to post the highest growth rate within the region?
Mexico is set for the fastest 6.01% CAGR through 2031, driven by infrastructure modernization, industrial security needs, and cross-border trade requirements.
Page last updated on:






