
Market Overview
| Study Period | 2021 - 2031 |
|---|---|
| Forecast Data Period | 2026 - 2031 |
| Base Year Market Size (2025) | USD 11.58 Billion |
| Market Size (2026) | USD 12.81 Billion |
| Market Size (2031) | USD 21.2 Billion |
| Growth Rate (2026 - 2031) | 10.62 % |
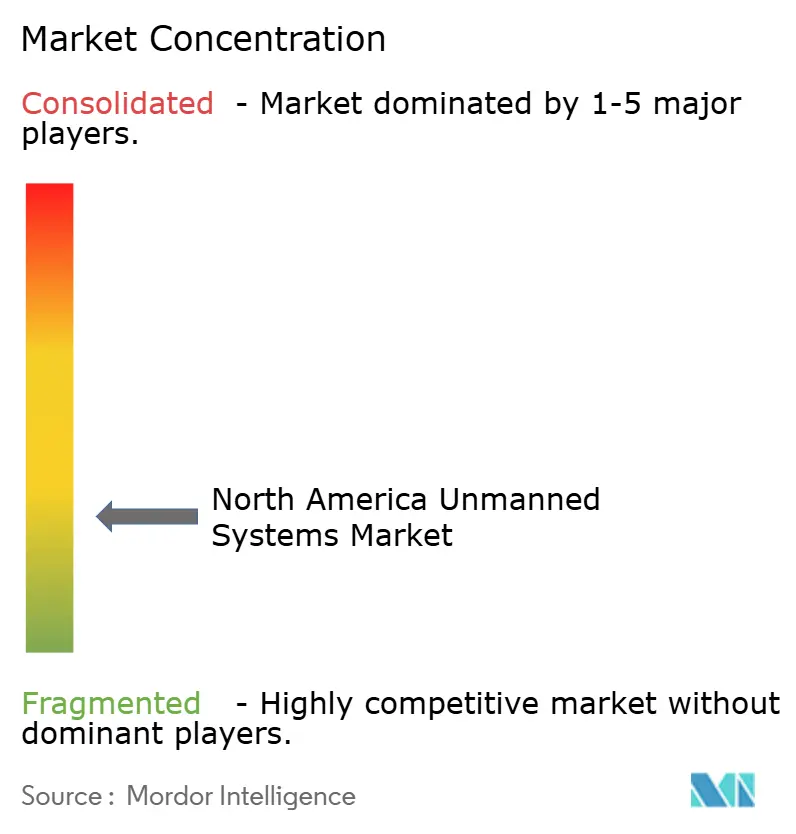
| Market Concentration | Low |
Major Players *Disclaimer: Major Players sorted in no particular order Image © Mordor Intelligence. Reuse requires attribution under CC BY 4.0. | |
North America Unmanned Systems Market Analysis by Mordor Intelligence
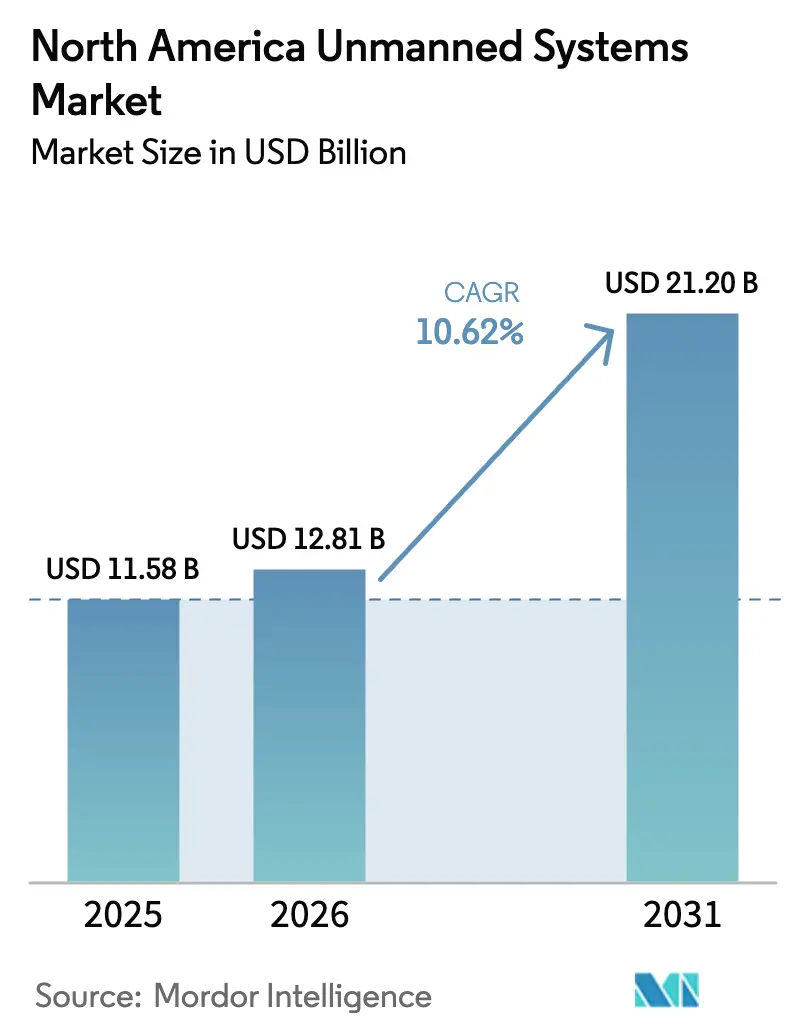
The North American unmanned systems market size was valued at USD 11.58 billion in 2025 and estimated to grow from USD 12.81 billion in 2026 to reach USD 21.20 billion by 2031, at a CAGR of 10.62% during the forecast period (2026-2031). Sustained defense procurement, rapid progress toward beyond-visual-line-of-sight (BVLOS) regulations, and falling autonomy costs continue to shape demand. The US Department of Defense’s USD 10.1 billion FY 2025 request for uncrewed platforms, Transport Canada’s BVLOS rules effective November 2025, and expanding drone-as-a-service offerings collectively increase addressable opportunities across military, civil, and commercial domains. Technology miniaturization and edge-AI integration lower total ownership costs, while supply-chain diversification efforts seek to mitigate chip shortages and foreign component risk. Privacy, data-governance fragmentation, and counter-UAS acquisition delays remain the principal headwinds to market scalability.
Key Report Takeaways
- By platform type, unmanned aerial vehicles led with 59.62% revenue share in 2025; unmanned aerial platforms also post the fastest growth at an 11.42% CAGR through 2031.
- By application, military ISR accounted for 40.72% of the North America unmanned systems market share in 2025, whereas commercial logistics and delivery are expected to climb at a 12.28% CAGR to 2031.
- By end-user, the defense and homeland security segment held 46.55% share of the North America unmanned systems market size in 2025, but service providers register the highest projected CAGR at 12.66% through 2031.
- By geography, the United States dominated with an 86.55% share in 2025, while Canada represents the fastest-growing country, advancing at an 10.95% CAGR to 2031.
Note: Market size and forecast figures in this report are generated using Mordor Intelligence’s proprietary estimation framework, updated with the latest available data and insights as of 2026.
Market Trends and Insights
Drivers Impact Analysis of North America Unmanned Systems Market*
| Driver | (~) % Impact on CAGR Forecast | Geographic Relevance | Impact Timeline |
|---|---|---|---|
| Multi-domain defense modernization accelerating unmanned systems procurement | +2.8% | United States defense installations | Medium term (2-4 years) |
| Commercial drone integration expanding across agriculture and logistics sectors | +2.1% | US farm belt, Canadian remote communities | Long term (≥ 4 years) |
| Regulatory progress enabling large-scale beyond-visual-line-of-sight operations | +1.9% | United States and Canada | Short term (≤ 2 years) |
| Cost reductions in AI autonomy and edge processing driving broader adoption | +1.7% | North America technology hubs | Medium term (2-4 years) |
| Rising demand for AUVs in offshore energy and subsea inspection missions | +1.2% | US Gulf Coast, Canadian offshore regions | Long term (≥ 4 years) |
| Public safety and emergency response agencies scaling drone-based operations | +0.9% | Urban centers across North America | Short term (≤ 2 years) |
| Source: Mordor Intelligence | |||
Multi-domain defense modernization accelerating unmanned systems procurement
Rising multi-domain requirements underpin robust US military spending, as illustrated by the USD 10.1 billion FY 2025 uncrewed-vehicle budget request, which is USD 1 billion higher than the prior year. Consolidated Army programs such as Future Tactical UAS and Launched Effects aim to boost cross-domain interoperability, while the Navy’s purchase of 49 additional unmanned surface vehicles underscores maritime demand growth. Investments exceeding USD 500 million in counter-drone systems reflect an evolving threat environment and reinforce fleet modernization priorities. The DoD’s Replicator program—tasked with fielding thousands of attritable autonomous aircraft—signals an accelerated shift toward large-volume, low-cost systems. These combined initiatives cement defense spending as the chief pillar supporting the North American unmanned systems market.
Commercial drone integration expanding across agriculture and logistics sectors
Registered commercial drones in the United States more than doubled between 2019 and 2024, reaching 842,000 units, and projections indicate a fleet of 1.1 million by 2028.[1] FAA approvals for multi-drone swarm operations enable a single pilot to command heavier payload platforms, widening agricultural use cases such as precision spraying and crop analytics. Logistics adoption follows suit—Walmart’s Dallas–Fort Worth operation already covers 1.8 million residents, and industry forecasts anticipate 808 million commercial drone deliveries annually by 2034. The synergy between agriculture and logistics drives producers like MightyFly to develop 100-pound-payload cargo drones capable of 600-mile missions. Together, these milestones validate expanding civilian demand in the North American unmanned systems market.
Regulatory progress enabling large-scale BVLOS operations
Congress has mandated the FAA to issue final BVLOS rules by March 2026, a milestone expected to remove today’s operational waiver bottlenecks. Canada advances even faster; Transport Canada’s regulations, effective November 2025, authorize routine BVLOS flights for aircraft up to 150 kilograms over sparsely populated zones.[2] The coming FAA Part 108 framework shifts oversight toward corporate rather than individual credentials, streamlining approvals for logistics networks. Early adopters such as the Elk Grove Police Department already report more than 1,000 BVLOS missions, validating efficiency gains. Harmonization talks within ICAO aim to ensure North American rules align with forthcoming international standards, reinforcing regulatory clarity that benefits the North American unmanned systems market.
Cost reductions in AI autonomy and edge processing driving broader adoption
Advances in edge computing allow AI pilots to run locally, as demonstrated by Shield AI’s autonomous flights on the Kratos MQM-178 with onboard processing. Component miniaturization trims size, weight, and power requirements; eliminating a single pound from a drone is estimated to save USD 30,000 over its lifecycle. Deloitte projects parcel-delivery costs to fall from USD 60 to USD 4 per package by 2030, driven by AI navigation improvements and extended battery life. Defense initiatives such as Project Maven illustrate how automated video analytics shorten threat-detection cycles, underscoring the operational benefit of cheaper, smarter autonomy. Falling hardware and software costs expand the addressable user base throughout the North American unmanned systems market.
Restraints Impact Analysis of North America Unmanned Systems Market*
| Restraint | (~) % Impact on CAGR Forecast | Geographic Relevance | Impact Timeline |
|---|---|---|---|
| Inconsistent privacy and data governance regulations hindering scalability | -1.4% | United States and Canada | Medium term (2-4 years) |
| Sensor and chip supply-chain vulnerabilities impacting production timelines | -1.1% | Entire North America | Short term (≤ 2 years) |
| Delayed counter-UAS acquisitions slowing unmanned system fielding | -0.8% | US military installations, critical infrastructure sites | Short term (≤ 2 years) |
| Acoustic emission restrictions limiting underwater vehicle deployment | -0.3% | US and Canadian coastal waters, marine protected areas | Long term (≥ 4 years) |
| Source: Mordor Intelligence | |||
Inconsistent privacy and data-governance regulations hindering scalability
Fragmented state-level privacy laws in the United States and differing federal-provincial rules in Canada increase compliance costs and constrain multi-jurisdictional operations. Community concerns about sensor-enabled surveillance complicate public safety deployments despite proven emergency-response gains. Unaligned data-retention mandates further restrict cross-border logistics flights and delay nationwide drone-as-first-responder programs. Until uniform standards emerge, governance uncertainty will weigh on expansion plans across the North American unmanned systems market.
Sensor and chip supply-chain vulnerabilities impacting production timelines
Semiconductor shortages, trade restrictions, and dependency on overseas suppliers threaten the timely delivery of high-performance processors and imaging sensors. The potential US ban on Chinese-origin drones illustrates the fragility of existing supply chains and forces manufacturers to re-engineer components. North Dakota’s state agency replacement scheme evidences operational disruption when non-compliant platforms must be retired. Companies are, therefore, investing in domestic fabs and multi-sourcing strategies; however, lead-time volatility is likely to persist into the near term and suppress output across the North American unmanned systems market.
*Our forecasts treat driver/restraint impacts as directional, not additive. The impact forecasts reflect baseline growth, mix effects, and variable interactions.
North America Unmanned Systems Market Segment Analysis
By Type:
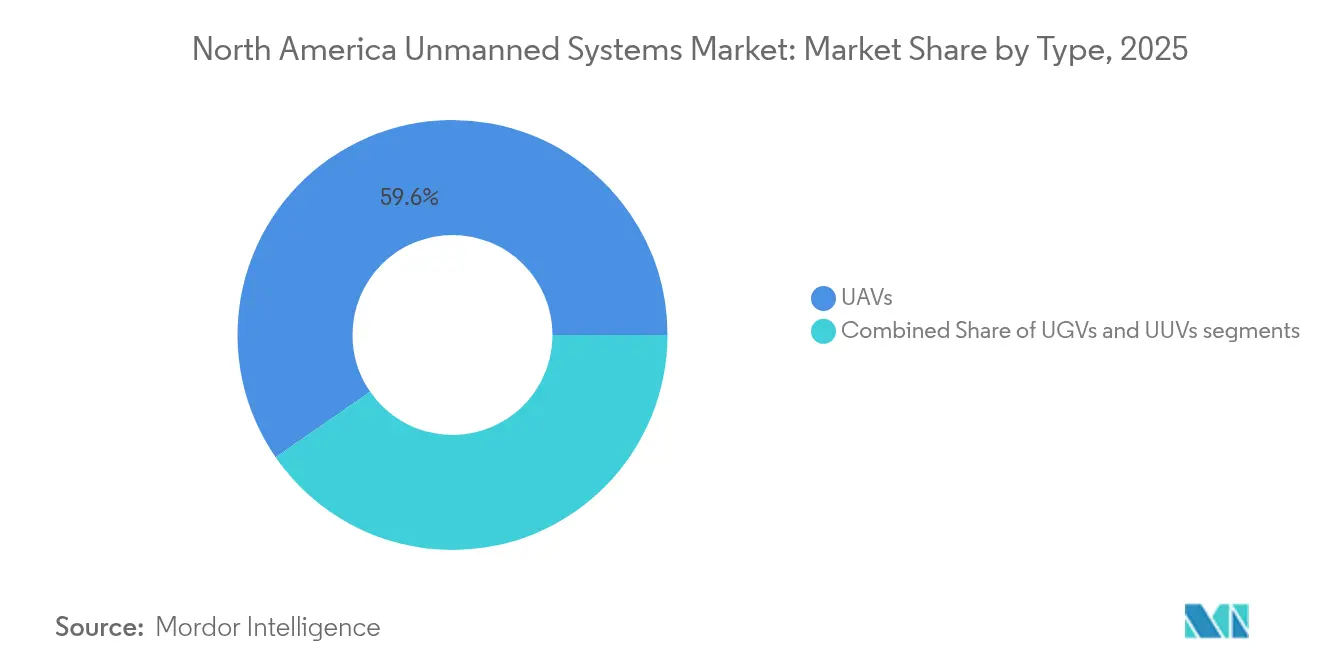
Aerial Platforms Drive Market LeadershipUnmanned aerial vehicles (UAVs) held 59.62% of 2025 revenue and are forecast to expand at an 11.42% CAGR through 2031. Their dominance spans nano-class quadcopters for reconnaissance to large fixed-wing cargo drones such as MightyFly’s Cento, which carries 100 lbs across 600 miles. The North American unmanned systems market size for UAV applications primarily contributes to overall growth. Unmanned ground vehicles supplement battlefield logistics and explosive-ordnance disposal, while programs retrofitting Black Hawk helicopters for autonomous logistics illustrate how aerial autonomy permeates rotorcraft fleets.
Unmanned underwater vehicles (UUVs) record the smallest unit volumes but benefit from oil-and-gas inspection demand and naval interest in seabed domain awareness. Freedom AUV’s recent US Navy trials and Anduril’s Rhode Island production facility targeting 200 AUVs per year confirm rising subsea investment. Cross-domain technology transfer is increasing; sonar-enabled deep learning in UUVs and GPS-denied navigation in UAVs share AI algorithms, enabling platform convergence and reinforcing the North American unmanned systems market expansion.

By Application:
Military Dominance Gives Way to Commercial ExpansionMilitary ISR missions generated 40.72% of 2025 revenue, underpinned by sustained federal budgets and border-security operations such as the Texas Department of Public Safety’s 51,674 drone flights. Yet commercial logistics and delivery are projected to outpace all other segments at a 12.28% CAGR to 2031, as BVLOS approvals and edge-AI efficiencies push unit economics toward profitability. The North American unmanned systems market size allocated to logistics platforms is set to rise sharply.
Agricultural and natural-resource management also registers rapid uptake after FAA permissions for swarm operations let one operator supervise multiple heavy-lift sprayers, triggering production scale-ups by US OEMs. Industrial inspection uses thermal, LiDAR, and hyperspectral payloads for infrastructure maintenance, while emergency-response agencies leverage BVLOS fleets to cut incident-arrival times. Across every end-use, onboard AI increasingly handles data fusion, enabling real-time insights that accelerate decision cycles.
By End-User:
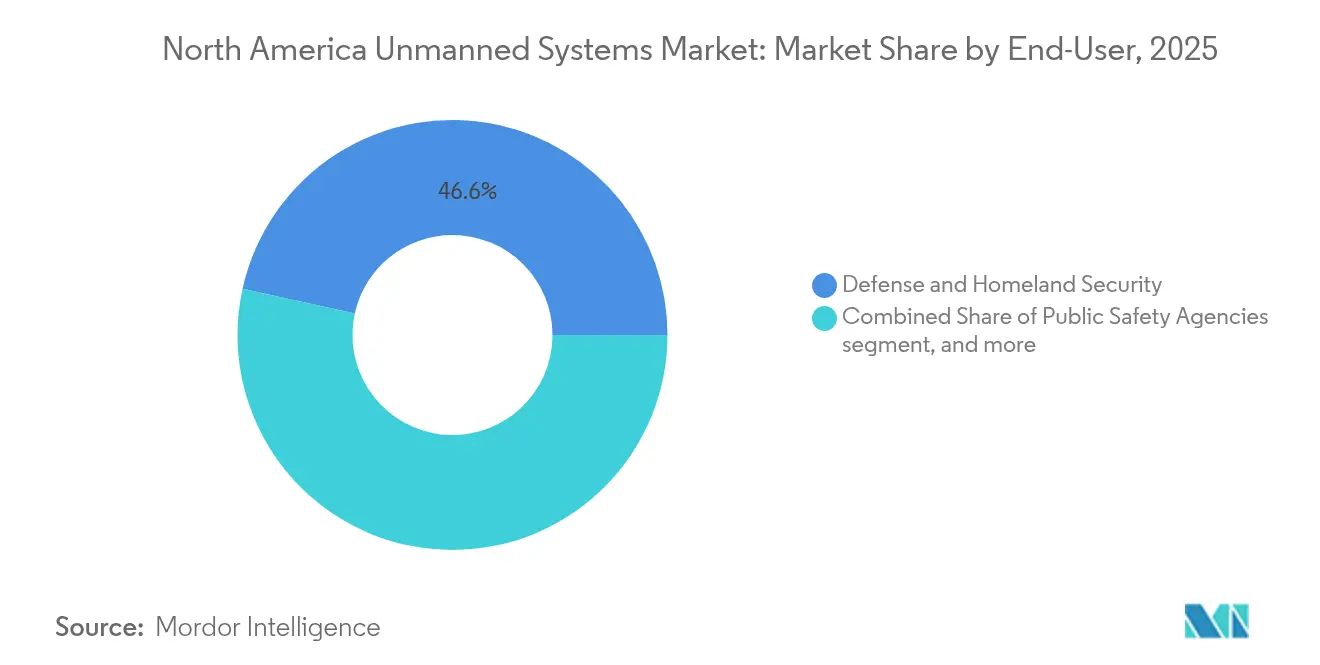
Service Providers Emerge as Growth LeadersDefense and homeland-security customers controlled 46.55% of 2025 spending, buttressed by programs such as the Coast Guard’s cutter-based UAS roll-out and the Navy’s enlarged unmanned surface-vehicle fleet. However, drone-as-a-service operators exhibit the fastest growth trajectory at a 12.66% CAGR, indicating a shift toward subscription-based access that minimizes capital outlay for adopters. Their rise redefines the North American unmanned systems market, moving value capture from hardware sales to recurring services.
Public-safety agencies increasingly procure turnkey DFR (drone-as-first-responder) systems; Elk Grove’s citywide BVLOS authorization exemplifies operational maturity. Industrial firms in energy and telecom favor outsourced inspection contracts that bundle platform, pilot, analytics, and compliance support. In parallel, private security, surveying, and environmental-monitoring firms use similar service models, expanding market breadth.
Geography Analysis
United States Unmanned Systems Market
The United States accounted for 86.55% of 2025 spending, anchored by the Department of Defense’s USD 10.1 billion budget, mature test-site infrastructure, and a pipeline of more than 200 M&A deals that accelerated domestic capability consolidation. Large-scale deployments span border security, parcel delivery, and emergency response, with one state agency fielding 368 aircraft and 325 pilots for border operations. The forthcoming FAA Part 108 BVLOS framework is expected to unlock commercial use cases further, sustaining the lead of the North America unmanned systems market in the United States.
Canada Unmanned Systems Market
Canada is projected to grow at an 10.95% CAGR to 2031, catalyzed by progressive BVLOS rules enacted in November 2025 and a CAD 2.5 billion Arctic RPAS procurement that begins production in 2025. The Calgary Police Service’s adoption of drones for traffic reconstruction and vast remote regions that benefit from unmanned logistics creates fertile ground for expansion. Harmonization dialogues with the United States aim to facilitate cross-border flights, integrating Canadian operators more tightly into the broader North America unmanned systems market.
Mexico Unmanned Systems Market
Mexico remains nascent yet strategically important given its border with the United States and diverse terrain suited to precision agriculture, infrastructure inspection, and humanitarian response applications. Domestic regulations continue to evolve, but increasing media coverage of AI-enabled drones suggests rising stakeholder interest. As North American rules converge, Mexico is likely to tap into supply-chain synergies and service-provider models that have proven successful elsewhere in the region.
Regulatory Landscape
In the United States, the FAA remains the primary civil regulator for UAS operations, with waiver-based pathways expanding alongside rulemaking. In April 2026, the FAA published its process for Section 927 waiver authority created by the FAA Reauthorization Act of 2024, providing an additional mechanism to approve higher-complexity operations while broader BVLOS policy work progresses toward a mandated final BVLOS rule deadline by March 2026. Federal Register actions in 2026 continued to formalize fixed-site airspace restrictions for unmanned aircraft near designated facilities, reinforcing that operational scale-up is paired with security-driven constraints.
Canada advanced with enabling BVLOS rules and event-driven security controls. Transport Canada rules effective November 2025 allow routine BVLOS flights for aircraft up to 150 kilograms over sparsely populated areas, and 2026 updates to aeronautical guidance and the creation of RPAS restricted airspace for FIFA World Cup 2026 sites in Toronto and Vancouver show active management of complex operations. On the security and counter-UAS side, Bill C-15 received Royal Assent on March 26, 2026 to authorize Transport Canada to permit specific entities to interdict drones presenting security risks, while in the United States, a July 2026 interim final rule by the Department of Justice and Department of Homeland Security moved to codify the SAFER SKIES Act framework for SLTT counter-UAS operations.
Value Chain Analysis
The North America unmanned systems value chain spans component suppliers (processors, imaging sensors, motors, batteries, communications links), platform OEMs (UAV/UGV/UUV airframes and propulsion integration), autonomy and mission-software providers (edge AI, navigation, data fusion), payload and ground-control vendors, and downstream integrators and service providers (training, compliance, maintenance, analytics, and drone-as-a-service). Defense procurement and vetted pathways such as the Blue UAS vetting approach influence design choices upstream, pushing OEMs toward traceable, secure bills of materials and domestic or allied sourcing for sensitive electronics.
Supply-chain resilience and production scaling are increasingly executed through domestic manufacturing partnerships, depot-level production, and automation initiatives. In June 2026, Tobyhanna Army Depot started operating a new brushless motor assembly line with an initial goal of 200,000 motors and capacity cited at up to 1,500 motors per day, addressing a critical subcomponent bottleneck for high-volume drones. In July 2026, Carnegie Foundry and Carnegie Mellon University announced the Autonomous Systems Manufacturing Platform (ASMP) to help manufacturers automate production and scale capacity, while Saxon Unmanned selecting IGCS International and Lacks Enterprises in May 2026 for high-volume U.S. manufacturing illustrate how OEMs are building compliant, repeatable production pathways. Persistent constraints highlighted in the report context, including sensor and chip availability and foreign-component risk, continue to shape supplier qualification, inventory strategy, and vertical integration decisions.
Competitive Landscape
Competition is fragmented on the civilian side but shows measured consolidation in defense niches, evidenced by more than 200 mergers and acquisitions transactions recorded in 2023. AeroVironment’s USD 4.1 billion acquisition of BlueHalo merged aerial vehicle expertise with electronic warfare assets, signaling a trend toward multi-capability portfolios.[4] Larger primes and venture-backed challengers compete to integrate edge AI and autonomy; Shield AI’s flight-proven software stack on Reaper-class aircraft highlights best-in-class performance.
Service-based players such as Ondas-Volatus leverage the Optimus System to provide persistent border-surveillance-as-a-service, illustrating alternative growth vectors beyond manufacturing. Anduril’s Rhode Island AUV plant, targeting 200 annual units, shows how vertical integration and scalable production can disrupt traditional naval suppliers. Supply-chain resilience now differentiates contenders; firms diversifying away from single-source chips gain bidding advantages on defense contracts that mandate domestic content.
Technological convergence, BVLOS compliance expertise, and robust supplier networks determine competitive standing. Companies that blend hardware, software, analytics, and regulatory services are positioned to capture recurring revenue streams and shape the future trajectory of the North America unmanned systems market.
North America Unmanned Systems Industry Leaders
-
Lockheed Martin Corporation
-
Teledyne FLIR LLC (Teledyne Technologies Incorporated)
-
L3Harris Technologies, Inc.
-
General Atomics
-
Northrop Grumman Corporation
- *Disclaimer: Major Players sorted in no particular order
North America Unmanned Systems Market Companies Covered in this Report
- The Boeing Company
- Lockheed Martin Corporation
- Northrop Grumman Corporation
- General Atomics
- L3Harris Technologies, Inc.
- General Dynamics Corporation
- Elbit Systems Ltd.
- Teledyne FLIR LLC (Teledyne Technologies Incorporated)
- AeroVironment, Inc.
- SZ DJI Technology Co. Ltd.
- Anduril Industries, Inc.
- Kratos Defense & Security Solutions, Inc.
- Skydio, Inc.
- Shield AI, Inc.
- Textron Systems Corporation (Textron Inc.)
- Oceaneering International, Inc.
- Kongsberg Gruppen ASA
- Saab AB
- QinetiQ Group
Market Opportunities and Future Outlook
Defense-led programs and contracting actions open near-term whitespace for attritable systems, loitering munitions, and counter-UAS. In 2026, the US Army awarded AeroVironment next-generation Switchblade variants for delivery (February 2026) and a production contract for the P550 electric VTOL UAS for Long Range Reconnaissance (July 2026). The Army also issued an IDIQ award to Neros for FPV-class systems in June 2026, expanding procurement signals across both precision effects and reconnaissance-oriented platforms. These awards reinforce opportunities for vendors of compliant subcomponents, secure datalinks, mission software, and rapid manufacturing capacity aligned with federal sourcing and security requirements.
On the civil and commercial side, BVLOS regulation progress and the growth of drone-as-a-service models expand addressable use cases in logistics, public safety, inspection, and remote operations. Transport Canada BVLOS rules effective November 2025, plus municipal public safety BVLOS activity cited in the report context, support packaged offerings that bundle aircraft, pilots, analytics, and compliance services. At the same time, tightening federal procurement security requirements in the United States, including the OMB memorandum implementing the American Security Drone Act with agency policy updates due by May 20, 2026, creates a distinct opportunity for vendors that can document cybersecurity posture, data governance, and non-high-risk supply chains across fleets deployed for government and critical-infrastructure missions.
Recent Industry Developments in North America Unmanned Systems Market
- July 2026: Lockheed Martin MORFIUS X-Rotor, an airborne high-power microwave counter-drone system positioned for defeating large drone swarms. The announcement highlighted a shift toward scalable, lower-cost-per-engagement counter-UAS options as Group 1-3 threats proliferate, supporting faster fielding of reusable effects alongside kinetic interceptors.
- June 2026: L3Harris Technologies received an order from the US Army to deliver VAMPIRE counter-unmanned systems, expanding deployment and integration at the tactical edge.
- January 2025: The US Air Force awarded Firestorm Labs a contract to deliver small unmanned aerial systems alongside support services and R&D, underscoring continued defense pull for scalable, mission-tailored sUAS and accelerating opportunities for production ramp, autonomy upgrades, and sustainment services.
North America Unmanned Systems Market Report Scope and Research Methodology
Market Definition and Coverage
For this study, the North America unmanned systems market is defined as revenues from unmanned platforms sold for use across defense, civil, and public-safety missions in the region, including the core vehicle and mission-critical payload and control elements that are procured with it.
Scope exclusions: We exclude crewed platforms, general IT services not tied to a specific unmanned program, and downstream activities such as operator staffing and non-technical consulting.
Segments Covered in This Report
- By Type
- Unmanned Aerial Vehicles (UAVs)
- Unmanned Ground Vehicles (UGVs)
- Unmanned Underwater Vehicles (UUVs)
- By Application
- Military ISR
- Civil and Law-Enforcement
- Commercial Logistics and Delivery
- Agriculture and Natural-Resources
- Industrial Inspection and Maintenance
- By End User
- Defense and Homeland Security
- Public Safety Agencies
- Enterprise and Industrial Operators
- Service Providers (Drone-as-a-Service)
- By Geography
- United States
- Canada
- Mexico
Data Sources, Market Sizing, and Validation
Desk Research
We start with desk research to lock the boundary and build a clean fact base for demand drivers in the United States, Canada, and Mexico. Common inputs include defense budget exhibits and program documents, public procurement award notices, and aviation and maritime rules that shape where unmanned platforms can be deployed.
For public and non-paywalled sources, we leaned on materials such as U.S. Department of Defense budget documents, FAA rulemaking and UAS integration updates, U.S. Government Accountability Office program reviews, U.S. Customs and trade statistics for relevant equipment categories, and association publications for drones and robotics. We then cross-checked with company filings, investor presentations, and reputable press coverage to confirm program timing, delivery ramps, and typical pricing bands. Where needed, we also used paid subscriptions for company financials and intelligence, patent databases, and contracts and tenders screening to strengthen the model inputs. These desk research sources are illustrative only, and many other public references were used to collect, validate, and clarify data points.
Primary Interviews and Surveys
Primary work was used to validate what desk research could not show clearly, especially the split between new platform buys, upgrades, and spares, and how adoption differs by mission type. We spoke with a mix of platform suppliers, payload and subsystem providers, systems integrators, and end users across defense and civil agencies, and we used follow-ups to resolve gaps around procurement cycles, delivery timing, and price movement assumptions.
Distribution of primary research fieldwork respondents
| Company type | Respondent position |
|---|---|
| Top tier: 32% | CXOs: 13% |
| Mid tier: 50% | Functional/Unit leaders: 27% |
| Smaller Players: 18% | Managers: 60% |
Market-Sizing & Forecasting
Sizing was built using a top-down and bottom-up approach, where program spend and procurement signals were first reconstructed by platform type and mission, and then reconciled with supply-side checks. Because many unmanned programs move in batches, we modeled demand using procurement cycle timing, expected delivery quantities, and typical unit values, and then converted these into annual market value.
Key inputs used in the model include defense and homeland security budgets and procurement plans, fleet expansion and replacement rates by platform class, civil and public-safety adoption triggers tied to regulatory allowances, average selling price movement by payload complexity, and the pace of autonomy and sensor upgrades that drive retrofit spending. Where public data was patchy, gaps were handled by using ranges from interviews and then narrowing them through consistency checks against known contract values, visible production capacity, and import patterns for relevant components.
For forecasting, we used scenario analysis anchored to budget outlooks and mission demand, and then refined the growth path using simple regression-style relationships between procurement funding, platform deliveries, and price progression. The final trajectory was adjusted only after interview feedback converged on realistic timing for new awards, delivery schedules, and price pressure from scaled manufacturing.
Data Validation & Update Cycle
Before finalizing, we compare the model outputs against independent signals such as major contract award totals, budget line-item movement, and observable fleet deployment milestones, and then investigate any outsized year-over-year jumps. If a variance cannot be explained by a known procurement event, the inputs are re-checked and, when needed, respondents are re-contacted to confirm what changed.
The results also go through multi-step analyst reviews where assumptions, calculations, and currency conversions are checked for consistency across countries and platform types. Reports are refreshed annually, and interim updates are made when material events occur, such as a major program cancellation, a new regulatory rule that unlocks civil use cases, or a step change in defense funding. Right before delivery, we run a final pass to ensure the latest public releases and validated market signals are reflected.
Mordor Intelligence's North America Unmanned Systems Market Size Measured Against Other Published Estimates
Published market sizes for unmanned systems in North America can look far apart because the boundary is not uniform, and sources do not always separate platform procurement from adjacent services and software. Timing also matters because some figures use older budget baselines or blend historical averages into the current year.
The benchmark table shows a meaningful spread, and in Mordor Intelligence's model the number is tied to procurement of unmanned aerial, ground, and sea platforms across the United States, Canada, and Mexico, instead of folding in broad drone services revenue or non-platform robotics spending. Differences also come from how fast prices are assumed to change as payload complexity rises, and whether the forecast case reflects a steady program cadence or an aggressive step-up in awards and deliveries.
Benchmark comparison
| Source | Market Size | Gaps in Research Methodology |
|---|---|---|
| Mordor Intelligence | USD 11.58 B (2025) | |
| Industry Association A | USD 9.90 B (2025) | Counts mainly aerial platforms and public-safety deployments, and it tends to omit unmanned sea systems and several defense-led ground vehicle programs, which pulls the total down. |
| Global Consultancy B | USD 15.80 B (2025) | Uses a wider revenue boundary that blends platform procurement with related drone services and broader autonomy software spend, and it applies faster price uplift assumptions in the base year. |
Reading the table together, the lower estimate aligns with narrower platform coverage, while the higher estimate reflects a broader revenue basket and more optimistic price progression. Our approach stays traceable because each annual value can be walked back to procurement drivers, platform mix, and pricing assumptions that were checked through interviews and public program signals.
Key Questions Answered in the Report
What is the current value of the North America unmanned systems market?
The market is valued at USD 12.81 billion in 2026.
How fast is the market expected to grow?
It is forecasted to rise at a 10.62% CAGR, reaching USD 21.20 billion by 2031.
Which platform type dominates revenue?
Unmanned aerial vehicles (UAVs) lead with 59.62% of 2025 revenue and also post the quickest growth.
Why is Canada the fastest-growing country market?
Progressive BVLOS regulations effective November 2025 and Arctic surveillance programs underpin its 10.95% CAGR.
What restraints could slow adoption?
Varied privacy laws and semiconductor supply-chain vulnerabilities are the most significant short-term hurdles.
How are service-provider models reshaping demand?
Drone-as-a-service offerings allow customers to access hardware, pilots, and analytics on subscription terms, driving the highest end user CAGR at 12.66%.