
Market Overview
| Study Period | 2020 - 2031 |
|---|---|
| Forecast Data Period | 2026 - 2031 |
| Base Year Market Size (2025) | USD 3.68 Billion |
| Market Size (2026) | USD 3.92 Billion |
| Market Size (2031) | USD 5.17 Billion |
| Growth Rate (2026 - 2031) | 5.69 % |
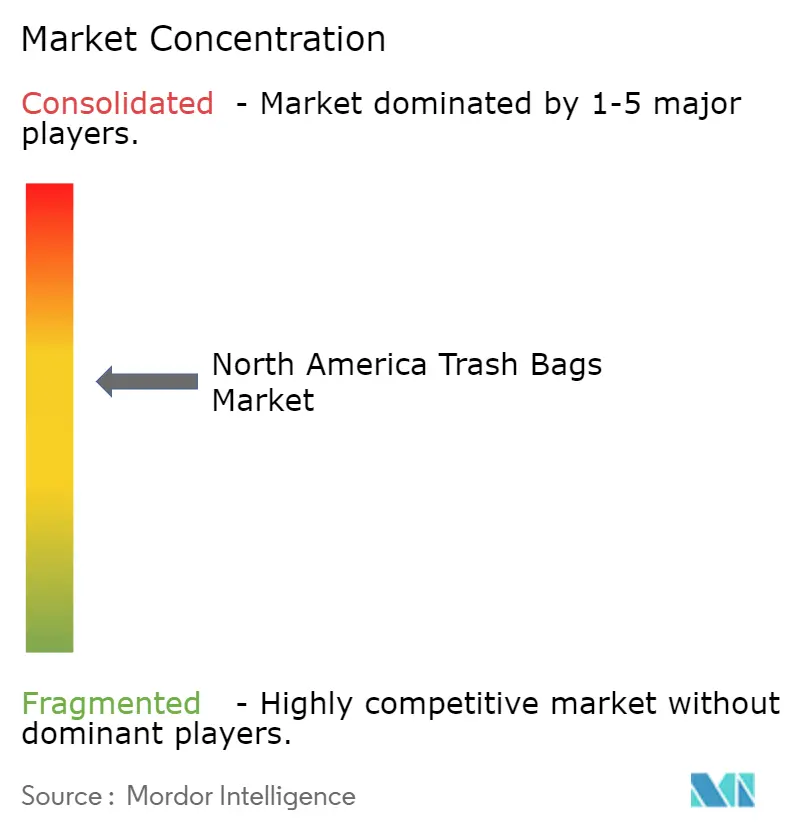
| Market Concentration | Medium |
Major Players *Disclaimer: Major Players sorted in no particular order Image © Mordor Intelligence. Reuse requires attribution under CC BY 4.0. | |
North America Trash Bags Market Analysis by Mordor Intelligence
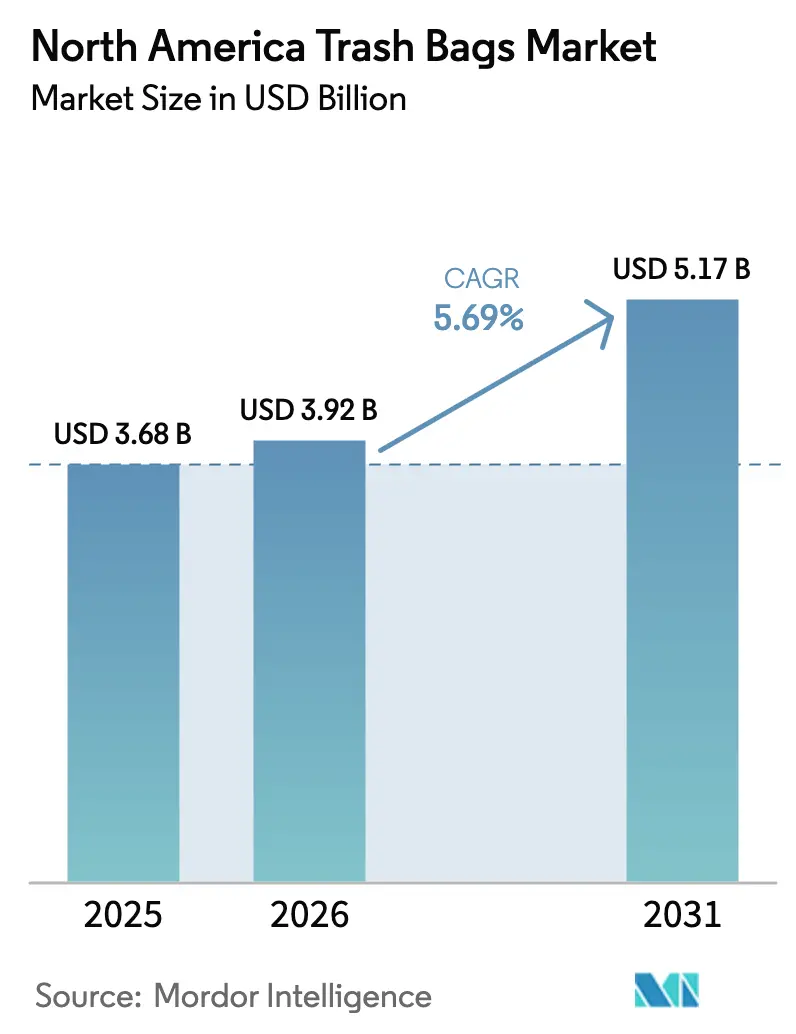
The North America trash bags market size is projected to expand from USD 3.68 billion in 2025 and USD 3.92 billion in 2026 to USD 5.17 billion by 2031, registering a CAGR of 5.69% between 2026 to 2031. Strong state landfill-diversion mandates, Fortune 500 zero-waste commitments, and rising parcel volumes from e-commerce operations are lifting liner consumption across households, offices, fulfillment centers, and construction sites. Color-coded and ASTM D6400-certified bags are moving quickly through retail shelves as California, New York, and Massachusetts enforce 50% diversion thresholds that favor premium compostable SKUs. Corporate facilities are shifting toward high-clarity, recycled-content liners that withstand rigorous sorting protocols, while pay-as-you-throw programs in more than 7,000 U.S. municipalities spur steady demand for municipally branded bags. Together, these trends position converters that can balance performance, sustainability, and cost to win long-term supply contracts in the North America trash bags market.
Key Report Takeaways
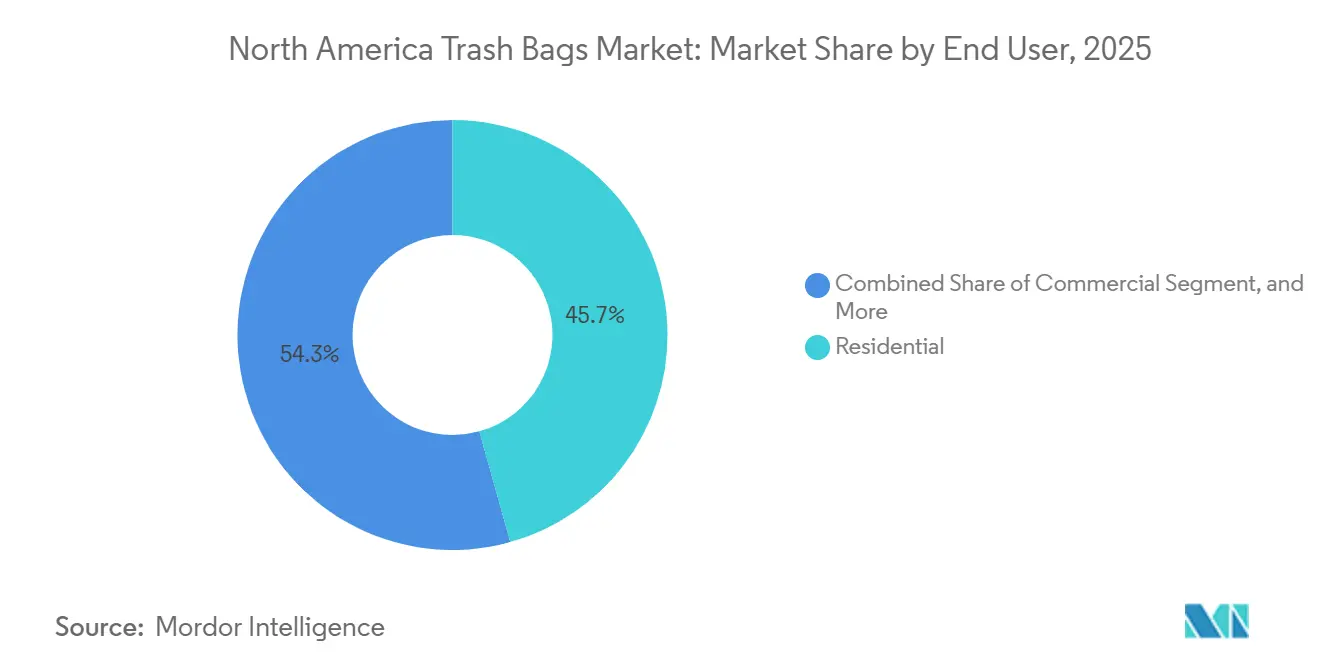
- By end user, residential captured 45.67% of the North America trash bags market share in 2025, while the industrial segment is advancing at a 6.03% CAGR through 2031.
- By product type, low-density polyethylene led with 41.23% share in 2025, whereas biodegradable and compostable variants are growing at a 7.12% CAGR to 2031.
- By capacity, 8-30 gallon kitchen bags held 37.55% share in 2025, and 30-55 gallon contractor bags are projected to expand at a 5.87% CAGR over 2026-2031.
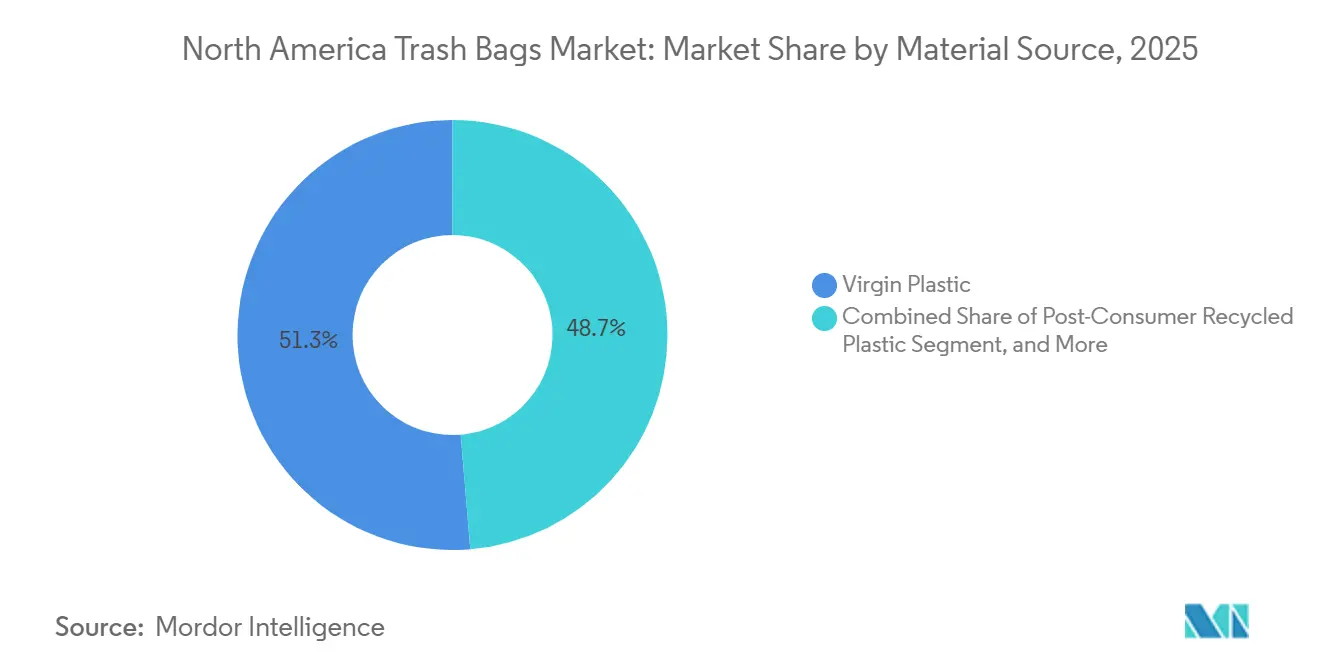
- By material source, virgin plastic accounted for 51.32% share in 2025, yet bio-based resins are on track for a 7.07% CAGR through 2031.
- By sales channel, offline retail secured 70.29% share in 2025, while online platforms are pacing ahead with a 6.43% CAGR to 2031.
- By geography, the United States dominated with 63.84% share in 2025, whereas Mexico is the fastest-growing country at a 6.07% CAGR to 2031.
Note: Market size and forecast figures in this report are generated using Mordor Intelligence’s proprietary estimation framework, updated with the latest available data and insights as of 2026.
Market Trends and Insights
Drivers Impact Analysis of North America Trash Bags Market*
| Driver | (~) % Impact on CAGR Forecast | Geographic Relevance | Impact Timeline |
|---|---|---|---|
| Residential waste-stream expansion and state landfill-diversion targets | +1.8% | United States, Canada | Long term (≥ 4 years) |
| Corporate zero-waste pledges from Fortune 500 facilities | +1.4% | United States, Canada, Mexico | Medium term (2-4 years) |
| Rapid e-commerce packaging turnover elevating commercial trash volume | +1.2% | United States, Canada, Mexico | Short term (≤ 2 years) |
| Municipal pay-as-you-throw programs accelerating bag consumption | +1.0% | United States, Canada | Medium term (2-4 years) |
| High-clarity recycled-content resins enabling premium pricing | +0.7% | United States, Canada | Long term (≥ 4 years) |
| Adoption of antimicrobial liners in healthcare and foodservice | +0.5% | United States, Canada, Mexico | Medium term (2-4 years) |
| Source: Mordor Intelligence | |||
Residential Waste-Stream Expansion and State Landfill-Diversion Targets
Household waste in the United States reached 292 million tons in 2024, and population inflows into metropolitan areas are pushing per-capita disposal rates higher. California SB 1383 and comparable rules in New York and Massachusetts now obligate municipalities to collect organics separately, creating locked-in demand for ASTM D6400-compliant compostable liners.[1] Municipal purchasing departments increasingly specify multi-layer bags with color cues that prevent cross-contamination during curbside pickup. Converters are answering with new coextrusion lines that embed pigment bands without compromising recyclability, a capital shift that favors incumbents already spending more than USD 5 million each year on R&D. As similar diversion targets propagate to Canadian provinces, the North America trash bags market gains a durable growth runway anchored in regulatory certainty.
Corporate Zero-Waste Pledges from Fortune 500 Facilities
More than 180 Fortune 500 companies now target TRUE or UL zero-waste certification, which requires diversion rates above 90% and segregation into at least five material streams.[2] To streamline audits, plants are shifting to clear liners that let sorters verify contents without opening bags, cutting contamination and labor time at Procter and Gamble’s Lima, Ohio, site by 12% in 2025. General Motors embedded RFID tags in 60-gallon translucent bags to trace waste back to production cells, enabling targeted operator training and fewer mis-sorted loads. Jan-san distributors report 20-30% price premiums for these feature-rich SKUs, creating margin headroom for converters that master additive dosing and inline printing. The expanding corporate pledge universe therefore secures a durable premium tier within the North America trash bags market.
Rapid E-Commerce Packaging Turnover Elevating Commercial Trash Volume
North American fulfillment centers processed 18.3 billion parcels in 2025, generating roughly 4.2 million tons of cardboard, stretch film, and void-fill that require daily clearance to meet fire codes.[3] Amazon’s Bessemer, Alabama, hub alone consumes about 22,000 contractor-grade bags per week to handle packaging waste from same-day and next-day orders. Walmart mandates at least 30% post-consumer content in bags used across its e-commerce network under the Project Gigaton initiative. To secure recycled feedstock, Inteplast commissioned a USD 75 million wash line capable of turning 150 million lb of post-consumer film into pellet feed for trash-bag extrusion. High parcel velocity thus translates directly into sustained contractor-bag demand and underpins recycled-content investment in the North America trash bags market.
Municipal Pay-As-You-Throw Programs Accelerating Bag Consumption
Pay-as-you-throw (PAYT) ordinances operated in 7,142 U.S. municipalities at the close of 2025, up from 6,890 a year earlier, and each program requires households to buy branded liners that embed disposal fees. Worcester, Massachusetts, logged a 34% rise in certified-bag sales and a 19% drop in landfill tonnage within 12 months of launching PAYT, proving that price signals nudge consumer behavior. Portland, Maine, pairs 15- and 30-gallon bags at differential price points, steering residents toward right-sized disposal and boosting small-capacity unit volumes. Bid documents often insist on domestic production, recycled-content floors, and ISO-verified tear strength, raising barriers for low-grade imports. As more towns adopt PAYT to defer landfill costs, dependable baseline demand accrues to regional converters in the North America trash bags market.
Restraints Impact Analysis of North America Trash Bags Market*
| Restraint | (~) % Impact on CAGR Forecast | Geographic Relevance | Impact Timeline |
|---|---|---|---|
| Volatile polyethylene and bioplastic feedstock prices | -1.1% | United States, Canada, Mexico | Short term (≤ 2 years) |
| Single-use-plastic bans and extended producer responsibility laws | -0.9% | Canada, United States | Medium term (2-4 years) |
| Retail SKU cannibalization from reusable tote initiatives | -0.4% | United States, Canada | Long term (≥ 4 years) |
| Logistics emissions scrutiny curbing import of low-grade liners | -0.3% | United States, Canada | Medium term (2-4 years) |
| Source: Mordor Intelligence | |||
Volatile Polyethylene and Bioplastic Feedstock Prices
LDPE spot prices swung between USD 0.52 and USD 0.68 per lb in 2025 after hurricane disruptions and cracker outages on the Gulf Coast.[4] Without pass-through clauses, private-label converters absorb those spikes, eroding margins that typically run below 12%. Bioplastic inputs proved even choppier, with polylactic-acid resin climbing from USD 1.85 to USD 2.31 per lb as Midwest drought cut dextrose yields. Mid-tier firms now carry 60-90 days of inventory to hedge volatility, tying up working capital that could fund coextrusion upgrades or lab testing. Sudden cost jumps therefore sap near-term profitability across the North America trash bags market.
Single-Use-Plastic Bans and Extended Producer Responsibility Laws
Canada’s Single-Use Plastics Prohibition Regulations bar checkout bags under 75 microns unless they contain at least 20% post-consumer resin, removing a source of repurposed liners for household trash.[5] New York’s statewide plastic-bag ban curtailed grocery checkout supply by roughly 90%, driving a 14% drop in store-bought trash-bag units as consumers reused thicker totes. British Columbia and Ontario now require producers to pay 100% of municipal recycling costs, adding up to CAD 0.06 (USD 0.05) per bag in eco-fees that spur lightweighting. Compliance teams must track dozens of local exemptions, increasing SKU proliferation and inventory risk. Collectively, these measures crimp volume growth and squeeze margins in the North America trash bags market.
*Our forecasts treat driver/restraint impacts as directional, not additive. The impact forecasts reflect baseline growth, mix effects, and variable interactions.
North America Trash Bags Market Segment Analysis
By End User:
Industrial Momentum Outpaces Household DemandThe residential segment captured 45.67% of the North America trash bags market share in 2025, benefiting from widespread curbside programs that keep weekly kitchen-bag purchases steady. Industrial users are forecast to expand at a 6.03% CAGR through 2031, lifting their portion of the North America trash bags market size as federally funded bridge, road, and water-system upgrades create debris streams that require heavy-duty liners. Contractors specify 30-55 gallon bags engineered to resist puncture forces above 400 psi, and procurement teams pay premiums of 25-35% for products verified to ASTM performance standards. Commercial offices, retail locations, and hospitality venues accounted for roughly 32% of 2025 volume, with occupancy rebounding to 68% and supporting demand for janitorial liners that often feature antimicrobial additives.
Foodservice operators within the commercial bracket favor bags certified to NSF antimicrobial protocols, a niche that drew USD 18 million in venture funding during 2025. Industrial facilities also turn to transparent liners embedded with RFID tags so zero-waste auditors can trace contamination to specific workcells, an innovation that secures long-term contracts despite price premiums. Residential demand remains stable yet faces gradual substitution from reusable containers distributed under city give-away schemes. Overall, the industrial end user is set to contribute the largest incremental revenue to the North America trash bags market size over the forecast horizon.

By Product Type:
Compostable Lines Lead Growth CurveLow-density polyethylene (LDPE) retained 41.23% of 2025 sales, sustained by tooling familiarity and the ability to incorporate up to 40% post-consumer resin without gauge drift. High-density polyethylene (HDPE) maintains relevance in warehouse and contractor settings where stiffness and moisture barriers are prized, but its advance lags LDPE and compostables. Biodegradable and compostable liners are projected to grow at a 7.12% CAGR, the fastest among product types, as California SB 1383 and similar rules legally obligate organics-collection bags to meet ASTM D6400 or EN 13432 standards.
Polylactic acid and starch-blend formulations cost 50-80% more than LDPE yet enjoy captive purchasing in regulated jurisdictions, steadily enlarging their slice of the North America trash bags market share. Conventional HDPE faces incremental erosion where retailers and municipalities forge plastic-reduction agreements with environmental groups. Still, LDPE’s flexibility, seal strength, and cost advantage preserve its leadership in household and light-commercial channels, ensuring a balanced but shifting product-type mix through 2031.
By Capacity:
Contractor Bags Capture Infrastructure UpswingKitchen-sized 8-30 gallon liners held 37.55% of the North America trash bags market share in 2025, reflecting their ubiquity in routine household disposal cycles. These bags typically feature drawstring closures, odor-neutralizing additives, and two- or three-layer structures that balance performance with price. Contractor-grade 30-55 gallon liners are on track for a 5.87% CAGR, riding a non-residential construction spend that climbed to USD 1.03 trillion in 2025.
Warehouses and renovation crews prefer 3.0-mil bags with reinforced gussets, a specification that drove a 14% uptick in 45-55 gallon sales at industrial distributors during the first half of 2025. Drum liners above 55 gallons support manufacturing clean-outs and bulk waste transfers, while bathroom bag sizes under 8 gallons grow slowly in hospitality and healthcare. The capacity mix is therefore tilting toward contractor and drum sizes, underscoring how infrastructure funding and fulfillment-center expansion add volume to the North America trash bags market size.
By Material Source:
Recycled And Bio-Based Content Gains TractionVirgin LDPE and HDPE together commanded 51.32% of shipments in 2025 thanks to consistent melt-flow rates that ensure clarity and seal integrity. Post-consumer recycled (PCR) pellets accounted for 28% of supply, a share buoyed by the commissioning of a USD 75 million wash line that feeds 150 million pounds of PCR into extrusion each year. Hybrid blends pairing virgin and recycled resin serve private-label buyers who need tight gauge tolerance without paying full virgin premiums.
Bio-based resins are forecast to post a 7.07% CAGR as corporate Science Based Targets initiative commitments spur brand owners to specify polylactic-acid or polyhydroxyalkanoate liners. NatureWorks added 150 million pounds of PLA capacity in 2025 to support ASTM-certified compostable bags, signaling confidence in the segment’s upside. Cost remains a hurdle, PLA trades above USD 2 per pound, but municipalities with mandatory organics programs create price-insensitive demand that gradually diversifies feedstock sourcing across the North America trash bags market share.
By Sales Channel:
Digital Subscriptions Win Steady Household ReplenishmentOffline retail, covering grocery, mass merchandise, and hardware, retained 70.29% of 2025 sales as shoppers dropped liners into carts during weekly trips, often choosing private-label multipacks priced up to 25% below national brands End-cap displays and instant-redeem coupons keep unit velocity high, and in-store sample stations educate consumers on drawstring and odor-control upgrades.
Online platforms are climbing at a 6.43% CAGR, leveraging Subscribe and Save models that shave 5-15% off list prices and guarantee doorstep replenishment every four to eight weeks. Direct-to-consumer compostable brands bypass slotting fees and reinvest savings in social-media advertising, while jan-san portals service bulk purchasers with technical data sheets and pallet pricing. Offline will remain dominant through 2031, yet incremental channel share continues to migrate online, reflecting the convenience premium that households and small businesses place on automated ordering within the North America trash bags market size.
Geography Analysis
United States Trash Bags Market
The United States generated 63.84% of the North America trash bags market size in 2025, powered by 7,000-plus pay-as-you-throw programs that require residents to buy municipally branded liners. State landfill-diversion rules in California, New York, and Massachusetts mandate compostable or color-coded bags, giving converters with ASTM certifications a pricing edge. Infrastructure Investment and Jobs Act funds pour into bridge and rail projects, lifting contractor-bag demand, while Amazon’s 1,100-site fulfillment grid drives commercial volume. Single-use-plastic bans create SKU complexity yet open margin room for premium compostables that meet local thresholds.
Mexico Trash Bags Market
Mexico is projected to post a 6.07% CAGR to 2031, the fastest among regional peers. The 2024 General Law for the Prevention and Integral Management of Waste requires municipalities over 500,000 residents to implement color-coded source separation by 2027, instantly enlarging the addressable base for certified bags. Mexico City already obliges commercial kitchens to use compostable liners for organics, and foreign direct investment in waste-management infrastructure reached USD 1.8 billion in 2025. Informal recycling networks temper penetration in lower-income districts, but rapid urbanization in Monterrey and Guadalajara offsets that drag.
Canada Trash Bags Market
Canada supplied roughly 12% of 2025 revenue, anchored by extended producer responsibility frameworks that push compliance costs onto manufacturers and require recycled-content minimums. British Columbia mandates 35% post-consumer content by 2026, while Ontario’s full-producer-pay model adds CAD 0.04 (USD 0.03) per bag in fees, motivating lightweighting and larger gauge precision. Cold winters complicate compostable logistics, yet Toronto and Vancouver pilots show early success with BPI-certified liners, positioning bio-based suppliers for gradual gains. These divergent provincial rules diversify the regulatory landscape but collectively reinforce the sustainability theme guiding the North America trash bags market share outlook.
Regulatory Landscape
Trash-bag specifications across North America are increasingly shaped by organics diversion, recycled-content mandates, and single-use plastic rules that affect how consumers source liners. In the United States, state and local landfill-diversion frameworks, such as California SB 1383, are driving procurement of ASTM D6400-certified compostable liners and color-coded source-separation systems. Pay-as-you-throw (PAYT) programs in more than 7,000 municipalities also reinforce demand for municipally branded bags with defined performance and labeling requirements.
In Canada, Environment and Climate Change Canada enforces the Single-Use Plastics Prohibition Regulations, and the Federal Court of Appeal upheld the listing of Plastic Manufactured Items on Schedule 1 of the Canadian Environmental Protection Act on January 30, 2026, reinforcing federal authority for plastics restrictions. Provincial extended producer responsibility frameworks, including British Columbia content requirements and Ontario producer-pay models, add eco-fees and lightweighting pressure that flow into trash-bag resin selection, gauge control, and documentation expectations for national brands and private-label suppliers.
Value Chain Analysis
The value chain runs from resin and additive suppliers (LDPE/HDPE, PCR pellets, and compostable resins such as PLA) to film extrusion and converting (blown film, coextrusion, printing, and drawstring and closure components), then distribution through offline retail, online subscriptions, and jan-san and institutional channels. End uses span residential, commercial, and industrial settings, with end-of-life pathways varying by municipality, including landfill, recycling pilots, and organics systems where applicable.
Vertically integrated producers such as Novolex (eight resin-extrusion plants, fourteen film-blowing sites, and twenty-two converting lines) and Inteplast (mechanical recycling capacity feeding PCR back into extrusion) reduce exposure to resin volatility and support fixed-spec, recycled-content bids for corporate and municipal buyers. Brand owners and large converters embed data and verification through standardized labeling and environmental accounting, including ISO 14040/14044-aligned life cycle assessments and on-pack disposal guidance programs such as How2Recycle, alongside TCFD- and GRI-aligned reporting for Scope 3 transparency. This shifts bargaining power toward suppliers that can provide consistent PCR quality, traceability, and documented performance (tear strength, puncture resistance, and compostability certifications), while retailers, municipalities, and Fortune 500 facilities enforce tighter specifications through bid documents and audit-driven procurement.
Competitive Landscape
Reynolds Consumer Products and The Clorox Company together control about 35% of regional revenue via the Hefty and Glad franchises, securing premium shelf space and consistent brand recall. Both groups leverage national advertising budgets to defend price premiums while incrementally raising recycled-content targets.
Novolex tilts the field through vertical integration: eight resin-extrusion plants, 14 film-blowing sites, and 22 converting lines enable private-label bids that undercut national brands by 20-30% yet still deliver gross margins above 18%. Inteplast Group combines cracker capacity with a USD 75 million mechanical recycling plant that feeds 150 million lb of PCR pellets into trash-bag lines, letting it offer fixed-price contracts insulated from LDPE spot swings.
Niche players Aluf Plastics and Heritage Bag Company differentiate with antimicrobial and odor-control chemistries carrying NSF certifications, winning healthcare and foodservice accounts worth tens of millions annually. Berry Global introduced AI-guided thickness monitors that trimmed off-spec scrap by 14%, illustrating how process controls can lift returns even in commodity segments. Patent filings in multi-layer films, bio-based additives, and RFID-embedded liners climbed 22% from 2024-2025, signaling that technology innovation, not just resin cost, will shape competitive edges in the North America trash bags market.
North America Trash Bags Industry Leaders
-
Reynolds Consumer Products Inc. (Hefty)
-
Novolex Holdings LLC
-
Inteplast Group Corporation
-
Cosmoplast Industrial Company LLC
-
International Plastics Inc.
- *Disclaimer: Major Players sorted in no particular order
North America Trash Bags Market Companies Covered in this Report
- Reynolds Consumer Products Inc. (Hefty)
- The Clorox Company (Glad Products Company)
- Novolex Holdings LLC
- Inteplast Group Corporation
- Riverside Paper Co. Inc.
- Cosmoplast Industrial Company LLC
- International Plastics Inc.
- Poly-America L.P.
- Four Star Plastics Inc.
- Neway Packaging Corporation
- All American Poly Corp.
- Aluf Plastics Inc.
- Petoskey Plastics Inc.
- Heritage Bag Company
- Crown Poly Inc.
- WasteZero Inc.
- Matrix Packaging LLC
- Elkay Plastics Co. Inc.
- Interplast Packaging LLC
- Super Bag Corp.
- RollPak Corp.
- Boulder Bag Company
Market Opportunities and Future Outlook
Compostable and certified organics liners fill a gap where organics-diversion mandates exist, and procurement language typically references standards such as ASTM D6400 and color-coding to reduce contamination. California SB 1383-style programs and Mexico's 2024 waste framework that expands color-coded source separation by 2027 in large municipalities create conditions where bag performance, labeling, and certification determine eligibility, supporting premium SKUs in retail and institutional channels. Walmart's 30% post-consumer content requirement for bags used across its e-commerce network under Project Gigaton also illustrates demand for recycled-content liners at scale.
PCR-integrated and auditable liner programs broaden the addressable opportunity as corporate zero-waste targets and retailer sustainability programs translate into minimum PCR thresholds and traceability at the facility level. Acquisitions of reusable packaging companies such as OZZI and paper-based product manufacturers such as American Twisting diversify portfolios beyond traditional single-use film, while Novolex Eco-Products leverages BPI-certified materials for food service applications tied to organics waste diversion targets.
Recent Industry Developments in North America Trash Bags Market
- May 2026: Novolex Holdings LLC appointed Marco Hilty, Ph.D., as President of the International, Industrial & Beverage Business Unit. The move places oversight of international and industrial and beverage operations under one leader. It accelerates growth across key channels and strengthens portfolio execution.
- May 2026: Novolex - Appointed Marco Hilty, Ph.D., as President of the International, Industrial & Beverage Business Unit. The appointment signals continued emphasis on expanding international and industrial and beverage businesses. The change strengthens cross-border collaboration and accelerates expansion plans.
- February 2026: Reynolds Consumer Products - Initiated a category organizational realignment starting Q1 2026, consolidating waste bags into one business segment and food bags/storage into another to increase operational efficiencies and innovation focus. The realignment concentrates focus on core categories and sharpens product and process development across the waste bag segment.
North America Trash Bags Market Report Scope and Research Methodology
Market Definition and Coverage
In this study, we define the North America trash bags market as the value of trash bags and bin liners sold for household and commercial waste collection across the United States, Canada, and Mexico, counted at the point of sale into each end-use channel.
Scope exclusions: We exclude rigid waste bins, industrial bulk liners sold as non-bag packaging, and municipal waste collection services that are not a bag product sale.
Segments Covered in This Report
- By End User
- Residential
- Commercial
- Industrial
- By Product Type
- Low-Density Polyethylene (LDPE) Bags
- High-Density Polyethylene (HDPE) Bags
- Biodegradable and Compostable Bags
- By Capacity (Gallons)
- Less than 8 Gal (Bathroom)
- 8 - 30 Gal (Kitchen)
- 30 - 55 Gal (Contractor)
- Above 55 Gal (Industrial Drum Liners)
- By Material Source
- Virgin Plastic
- Post-Consumer Recycled Plastic
- Hybrid (Recycled + Virgin)
- Bio-Based Resins
- By Sales Channel
- Offline Retail (Grocery, Mass Merchandiser)
- Online Retail
- Jan-San and Institutional Distribution
- By Country
- United States
- Canada
- Mexico
Data Sources, Market Sizing, and Validation
Desk Research
Desk research set the foundation for volume drivers and regulatory context, and it helped us sanity check pricing direction in the trash bags market across the United States, Canada, and Mexico. We typically reviewed public sources such as U.S. Environmental Protection Agency materials on municipal solid waste, Statistics Canada datasets on waste generation and management, and Mexico waste and environment publications from relevant federal agencies.
To connect demand to real consumption patterns, we used trade and tariff references (for example, U.S. ITC resources and UN Comtrade tables) to understand resin and finished goods flows, plus standards bodies and association sites that describe compostable and recycled-content claims. Company filings, investor presentations, and reputed press were used to map product mix shifts and channel exposure. We also used a paid subscription for company financials and a shipment-level trade database selectively to validate revenue splits and import dependence. These examples are not exhaustive, and many other public sources were also used for data collection, validation, and clarification.
Primary Interviews and Surveys
Primary work was used to confirm how trash bags are priced and bought in North America, and to pressure test assumptions that desk sources cannot show clearly, such as recycled-content premiums, channel margins, and the pace of compostable adoption. We spoke with a mix of converters, resin-linked packaging participants, distributors and retailers, and large end users across residential, commercial, and institutional buying, and then re-contacted sources when a data point looked inconsistent across countries.
Distribution of primary research fieldwork respondents
| Company type | Respondent position |
|---|---|
| Top tier: 28% | CXOs: 21% |
| Mid tier: 50% | Functional/Unit leaders: 31% |
| Smaller Players: 22% | Managers: 48% |
Market-Sizing & Forecasting
For sizing, we start with a top-down demand pool built from waste generation signals and household and commercial usage patterns, then translate that into bag consumption using typical bag-per-week and replacement frequency assumptions by end-use. After the first cut, we corroborate the results with selective bottom-up checks, such as rolling up a sampled set of supplier revenues, channel sell-in splits, and an average selling price times volume build for common bag sizes.
In this market, the inputs that often move the estimate include municipal solid waste volumes and diversion targets, penetration of pay-as-you-throw programs that require specific bags, the mix shift between drawstring and flat seal formats, and the recycled-content and compostable share trends that change price points. We also track resin-linked pricing pressure because it affects ASP movement. When a bottom-up check has gaps, we bridge them using conservative channel coverage factors and import-export indicators, and then adjust only if multiple signals point the same way. Forecasts were developed using scenario analysis, where resin cost paths, sustainability policy enforcement, and retail and institutional demand growth are varied and aligned to what interviewees consider realistic for the next cycle.
Data Validation & Update Cycle
Validation is done in layers so that a single assumption does not drive the final number. We compare outputs against independent signals such as per-capita waste trends, trade movements, and implied bag spend per household and per commercial site, and we investigate any sharp jumps by revisiting the driver and pricing logic.
Before sign-off, another analyst reviews the model structure, key inputs, and the reasonableness of segment splits, and flags outliers for follow-up calls or added desk checks. Reports refresh annually, and interim updates are made when material events occur, such as policy changes, large price swings in key inputs, or major channel shifts. Right before delivery, a final review pass is completed so clients receive the most current view based on the latest available data.
Mordor Intelligence's North America Trash Bags Market Size Measured Against Other Published Estimates
Published market sizes for trash bags in North America can look far apart because each publisher draws the line differently around product types, channels, and what counts as a trash bag sale. Differences also come from how ASPs are updated, whether recycled-content and compostable products are priced as a premium, and how currency timing is handled across the three countries.
Some external numbers expand the scope into adjacent plastic bags and sacks, and sometimes they also blend in broader packaging films. For Mordor Intelligence, the total is restricted to trash bags and bin liners only. The value is tied to channel sell-in pricing that we re-check with interview feedback when resin-linked pricing shifts.
Benchmark comparison
| Source | Market Size | Gaps in Research Methodology |
|---|---|---|
| Mordor Intelligence | USD 3.68 B (2025) | |
| Trade Journal A | USD 2.41 B (2024) | Uses an earlier base year and appears to rely on a narrower tracked basket that underweights institutional and industrial liners, which can suppress the value when ASPs are rising. |
| Regional Consultancy B | USD 4.96 B (2025) | Likely broadens the product scope into nearby plastic bag categories and applies a more aggressive premium for sustainable materials, which can lift totals beyond trash bags and bin liners. |
The spread in the table is mostly explained by scope and base-year timing, followed by how price premiums are applied to recycled-content and compostable offerings. By keeping the model linked to visible demand drivers and cross-checking pricing and channel splits through interviews, we keep the estimate repeatable and easier to reconcile year to year.
Key Questions Answered in the Report
How fast is the North America trash bags market expected to grow between 2026 and 2031?
The market is forecast to expand at a 5.69% CAGR from 2026 to 2031 as landfill-diversion mandates, zero-waste pledges, and e-commerce activity raise liner consumption.
Which capacity segment is advancing the quickest?
Contractor-grade 30-55 gallon bags are projected to record a 5.87% CAGR through 2031 on the back of robust non-residential construction activity.
Why are compostable trash bags gaining share in the region?
State and municipal organics programs require ASTM D6400-certified liners, prompting a 7.12% CAGR for biodegradable and compostable bags through the forecast period.
What role do online channels play in category growth?
Subscription services and same-day delivery partnerships are pushing online sales ahead at a 6.43% CAGR, although offline stores still control most volume.
How are producers addressing resin price volatility?
Vertically integrated players like Inteplast secure supply with in-house cracking and recycling, while others carry extra inventory or negotiate blended-resin formulas to stabilize costs.
Which country will contribute the highest incremental revenue after the United States?
Mexico, projected at a 6.07% CAGR, will generate the largest incremental gains due to new source-separation mandates and expanding municipal collection networks.