
Market Overview
| Study Period | 2020 - 2031 |
|---|---|
| Forecast Data Period | 2026 - 2031 |
| Base Year Market Size (2025) | USD 287.27 Billion |
| Market Size (2026) | USD 300.37 Billion |
| Market Size (2031) | USD 375.44 Billion |
| Growth Rate (2026 - 2031) | 4.56 % |
| Market Concentration | Medium |
Major Players *Disclaimer: Major Players sorted in no particular order Image © Mordor Intelligence. Reuse requires attribution under CC BY 4.0. | |
North America Transportation Infrastructure Construction Market Analysis by Mordor Intelligence
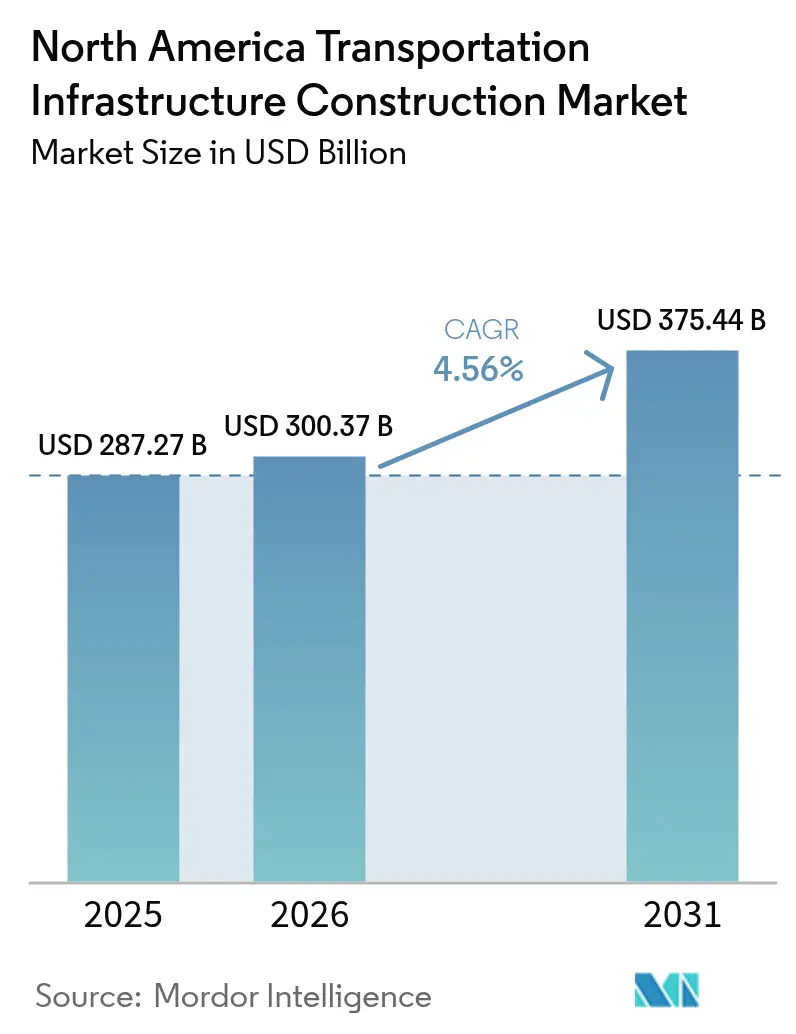
North America Transportation Infrastructure Construction Market size in 2026 is estimated at USD 300.37 billion, growing from 2025 value of USD 287.27 billion with 2031 projections showing USD 375.44 billion, growing at 4.56% CAGR over 2026-2031. The modest but durable growth path reflects sustained federal and provincial appropriations in the United States and Canada alongside a revitalised project pipeline in Mexico. Multi-year surface-transport authorisations, green energy transition goals, and near-shoring–linked trade corridors are widening the addressable opportunity base for contractors, materials suppliers, and technology vendors. At the same time, the share of projects incorporating digital twins, advanced traffic-management systems, and climate-resilient design features continues to rise, creating new value pools beyond traditional civil works. Contractors that align integrated design–build capabilities with workforce development and supply-chain risk management are best positioned to defend margins in the face of lingering cost inflation and labour scarcity.
Key Report Takeaways
- By type, roadways led with a 53.40% share of the North American transportation infrastructure construction market in 2025; railways is forecast to expand at a 5.45% CAGR through 2031.
- By construction activity, new construction captured 69.30% of spending in 2025, and the same segment is projected to grow at a 5.05% CAGR between 2026 and 2031.
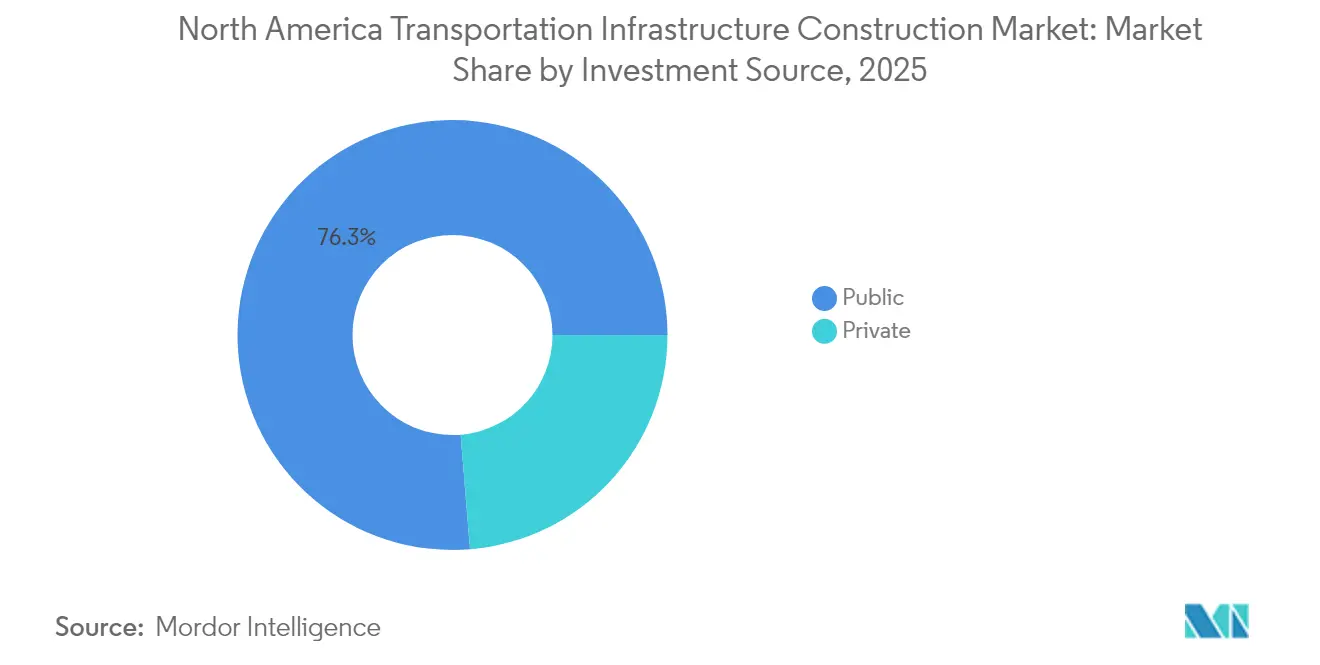
- By investment source, public funding accounted for 76.30% of 2025 expenditures, whereas private capital is expected to advance at a 5.60% CAGR over 2026-2031.
- By country, the United States dominated with 80.50% of the North American transportation infrastructure construction market share in 2025, while Mexico is set to record the fastest growth at 5.85% CAGR during 2026-2031.
Note: Market size and forecast figures in this report are generated using Mordor Intelligence’s proprietary estimation framework, updated with the latest available data and insights as of 2026.
Market Trends and Insights
Drivers Impact Analysis of North America Transportation Infrastructure Construction Market*
| Driver | (~) % Impact on CAGR Forecast | Geographic Relevance | Impact Timeline |
|---|---|---|---|
| Federal and provincial infrastructure stimulus programs | +1.8% | United States, Canada | Medium term (2-4 years) |
| Modernisation of aging bridges, tunnels and transit systems | +1.4% | United States, Canada | Long term (≥ 4 years) |
| Expansion of multimodal freight and passenger corridors | +1.2% | Cross-border North America | Medium term (2-4 years) |
| Rise of electric and autonomous mobility driving smart highways & ITS | +0.9% | Urban United States & Canada | Long term (≥ 4 years) |
| Source: Mordor Intelligence | |||
Federal and Provincial Infrastructure Stimulus Programs Driving Long-Term Transport Investment Across the Region
Unprecedented fiscal support is flowing into highways, bridges, rail and transit. The United States has budgeted more than USD 350 billion for federal highway programs through 2026, with formula allocations and competitive grants already supporting more than 66,000 projects and sustaining nearly 1 million construction jobs.[1]U.S. Department of Transportation – “Infrastructure Investment and Jobs Act Funding” Provinces follow similar paths: Québec’s ten-year plan designates USD 131.2 billion for wide-ranging infrastructure additions, including USD 28.7 billion for road networks and USD 11.6 billion for public transit. Staggered release of funds has produced a counter-cyclical buffer that shelters the construction supply chain from wider economic slowdowns, while multi-year capital plans give contractors line-of-sight on workloads and foster longer equipment-leasing and workforce-training commitments.
Widespread Modernisation of Aging Bridges, Tunnels and Transit Systems to Meet Safety and Capacity Demands
An expanding share of public dollars is earmarked for repairing infrastructure rated structurally deficient. The 2025 Infrastructure Report Card shows 6.7% of U.S. bridges in poor condition, prompting large-scale rehabilitation programs such as the Portal North Bridge upgrade, now three-quarters complete, and New York’s Grand Central Artery restoration.[2]American Society of Civil Engineers – “2025 Infrastructure Report Card” Modernisation extends beyond steel and concrete replacement: asset owners are embedding digital twins, fibre-optic sensing and condition-based maintenance to prolong asset life and cut lifecycle cost. The Metropolitan Transportation Authority’s USD 68.4 billion capital plan prioritises power-system upgrades and flood resilience, signalling a pivot to performance-based asset management instead of piecemeal repairs.
Expansion of Multimodal Freight and Passenger Corridors to Enhance Regional Connectivity and Trade Efficiency
Freight bottlenecks along the United States-Mexico-Canada trade routes are being eased through purpose-built corridors that integrate rail, road and port facilities. Mexico’s Isthmus of Tehuantepec Interoceanic Corridor links 1,189 km of railway with parallel highways and modernised ports to create an alternative to the Panama Canal. In the United States, USD 2.4 billion in recent federal grants funds 122 rail projects that strengthen first- and last-mile links for shippers and commuters. These corridors underpin the USMCA framework by cutting transit times, lowering transport cost and widening inland market access for Canadian exporters. Local economies along new alignments experience secondary benefits such as warehousing, light manufacturing and services cluster formation.
Rise of Electric and Autonomous Mobility Accelerating Deployment of Smart Highways and Intelligent Transport Systems
Shift toward battery-electric fleets and self-driving logistics vehicles is accelerating sensor-heavy infrastructure rollouts. The Advanced Transportation Technology and Innovation program recently awarded USD 96 million for projects including vehicle-to-everything corridors, AI-driven traffic management and automated incident detection. States are layering adaptive signals and edge computing onto heavily travelled arterials, reducing travel time, fuel burn and crash risk. Transit agencies target fleet electrification goals—20% of the New York metropolitan bus fleet will be electric by 2029—spurring parallel investment in charging lanes, substations and grid upgrades. Contractors with software-integration expertise and control-centre build capabilities are differentiating themselves as project scopes extend beyond civil works into communications and cyber-security domains.
Restraints Impact Analysis of North America Transportation Infrastructure Construction Market*
| Restraint | (~) % Impact on CAGR Forecast | Geographic Relevance | Impact Timeline |
|---|---|---|---|
| Chronic shortages of skilled labour in civil and transportation trades | –1.1% | United States, Canada | Medium term (2-4 years) |
| Persistently high construction material prices | –0.7% | United States-focused | Short term (≤ 2 years) |
| Source: Mordor Intelligence | |||
Chronic Shortages of Skilled Labour in Civil and Transportation Trades Increasing Project Delivery Risk
Labour availability remains the principal hurdle for on-time project delivery. Ninety-three percent of contractors report open craft positions, while vocational enrolment declines and retirements accelerate—41% of transportation construction workers reach retirement eligibility by 2031. The industry recorded 248,000 unfilled jobs in April 2025, pressuring wages and elongating bid schedules. Owners are responding with larger contingency allowances, while contractors expand modular fabrication, invest in machine control and widen outreach to under-represented workforce segments. Federal and state apprenticeship incentives are helping, yet the gap between project authorisation and crew mobilisation threatens schedule certainty for megaprojects.
Persistently High Construction Material Prices Undermining Budget Reliability and Delaying Procurement Decisions
Material inflation remains elevated: composite input costs are forecast to rise 5-7% during 2025, led by volatility in structural steel, lumber and electrical gear. Supply chain disruptions and tariff risk compound uncertainty, forcing agencies to include higher escalation clauses and, in some cases, split procurements to lock in prices earlier. The Los Angeles transit authority flagged cost creep as a contributor to scope deferral on several extensions, signalling how price instability can distort prioritisation. Contractors adopt hedging instruments and explore alternative materials, but budget overruns continue to deter marginal projects, creating uneven investment patterns across states and provinces.
*Our forecasts treat driver/restraint impacts as directional, not additive. The impact forecasts reflect baseline growth, mix effects, and variable interactions.
North America Transportation Infrastructure Construction Market Segment Analysis
By Type:
Railways Gain Momentum Amid Modal ShiftSpending on roadways reached USD 153.4 billion in 2025, equating to 53.40% of the North American transportation infrastructure construction market. State and provincial highway programmes fund extensive resurfacing, lane-widening and interchange reconstructions aimed at relieving chronic congestion. Emission-reduction mandates encourage agencies to experiment with warm-mix asphalt, reclaimed pavement and permeable shoulders, broadening material specifications and opening new niches for suppliers.
Railways, which represented 28.70% of 2025 outlays, is slated for a 5.45% CAGR through 2031—the fastest among modal types. Federal passenger-rail grants, freight-operator capital plans and binational high-frequency corridors anchor this momentum. Recent service-quality lapses on congested rail links have prompted urgent investments in signalling, track duplication and grade-separation works. Consequently, the North American transportation infrastructure construction market size allocated to railways is projected to grow steadily, gaining ground on the historically dominant highway segment.


By Construction Type:
Renovation Demand Rises as Infrastructure AgesNew construction commanded 69.30% of 2025 spend, underscoring ongoing demand for greenfield corridors, intermodal hubs and replacement facilities. Multi-year design-build-finance-operate contracts continue to set new benchmarks for schedule certainty and cost predictability, reinforcing owner confidence in private-sector delivery models. Smart sensors embedded during the build phase feed real-time data to asset-management dashboards, compressing commissioning periods and supporting rapid revenue service.
Renovation and upgrade activity, while holding a 30.70% share in 2025, is expanding at a brisk pace due to mandatory bridge-condition reporting and tunnel-safety directives. Owners now couple structural repair with technology retrofits—installing fibre conduits, electronic tolling gantries and advanced CCTV—to prolong asset lifespan and improve revenue capture. The heightened emphasis on resiliency is injecting fresh complexity into renewal scopes, rewarding firms with integrated design and construction management capabilities.
By Investment Source:
Private Capital Accelerates GrowthPublic entities financed 76.30% of the North American transportation infrastructure construction market in 2025 through grant programs, trust-fund disbursements and municipal bonds. The predominance of public funding stems from the public-goods nature of major transport arteries and the need for inter-jurisdictional coordination.
Private investment, accounting for the remaining 23.70% in 2025, is on course for a 5.60% CAGR to 2031—ahead of total-market growth. Pension funds, insurance houses and specialist infrastructure investors are structuring revenue-risk-sharing agreements around toll lanes, electrified intercity rail and data-rich traffic-management platforms. These investors value the long-duration, inflation-linked cash flows typical of mature transportation concessions, thereby broadening the capital stack available to project sponsors and amplifying expansion capacity across the North American transportation infrastructure construction market.
Geography Analysis
United States Transportation Infrastructure Construction Market
The United States remained the powerhouse in 2025, contributing 80.50% of total spending. High-visibility megaprojects—from the re-imagined Hudson River rail tunnel to Texas’ multi-lane interstate upgrades—headline the country’s forward programme. Federal technology grants incentivise deployment of vehicle-to-everything infrastructure, advanced traffic analytics and zero-emission transit fleets, elevating the sophistication of project scopes and raising the skills bar for bidding consortia.
Canada Transportation Infrastructure Construction Market
Canada accounts for a smaller but strategically important share. The federal high-frequency rail initiative linking Québec City to Toronto will modernise 1,000 km of rail corridor, while prairie-province freight-rail upgrades unlock grain-export capacity. Provincial commitments to reduce tailpipe emissions accelerate procurement of fully electric bus rapid-transit networks and smart-signal corridors. These developments ensure that Canada remains a growth contributor within the broader North American transportation infrastructure construction market.
Mexico Transportation Infrastructure Construction Market
Mexico is the regional out-performer, advancing at a 5.85% CAGR on the back of flagship programmes such as Tren Maya and the Isthmus of Tehuantepec corridor. Fiscal constraints necessitate blended-finance structures involving development banks, pension funds and concessionaires. Successful execution of these schemes will relieve logistics chokepoints, attract manufacturing reshoring and deepen the project pipeline feeding the North American transportation infrastructure construction market.
Regulatory Landscape
In the United States, the U.S. Department of Transportation set out near-term funding and policy priorities through its FY 2026 budget request (USD 147.1 billion) and the DOT Strategic Plan FY 2026-2030. At the same time, the surface transportation authorization timeline has become a practical planning anchor as current programs approach expiration on September 30, 2026. Reauthorization activity has progressed, including the introduction of H.R. 8870 (May 2026), which proposes multi-year highway and rail authorizations for 2027-2031 and influences contractor visibility on federal-aid eligibility, grant timing, and project delivery pipelines across road and rail work.
In Canada, federal legislative and regulatory updates in 2026 tightened operating and safety requirements that carry through to construction, commissioning, and handover for rail and cross-border assets. The High-Speed Rail Network Act received Royal Assent on March 26, 2026, streamlining approvals for designated rail construction, while the International Bridges and Tunnels Act regulations were updated (SOR/2026-46, March 25, 2026) and the Railway Personnel Training and Qualifications Regulations were published (SOR/2026-141, July 1, 2026), strengthening training, qualification, and compliance obligations for rail project operators and maintainers. In Mexico, SICT published NOM-037-SICT2-2026 for road barrier protective systems (published May 19, 2026; in force November 15, 2026), establishing a technical standard that affects roadway and urban road packages. Federal concession rules under the Ley de Caminos, Puentes y Autotransporte Federal continue to shape the construction, operation, and maintenance of federal highways and bridges.
Value Chain Analysis
The value chain runs from planning and permitting by public owners and regulators, to engineering and design (including BIM-enabled design-build), procurement of materials and systems, heavy civil construction, and systems integration (ITS, signaling, electrification interfaces), before moving into long-term operations and maintenance handover. In the United States, domestic content compliance under the Build America, Buy America Act has become a procurement gate for federally assisted projects. FHWA finalized actions that remove the general waiver for manufactured products on federal-aid highway projects (effective in 2025), and state DOTs such as WSDOT updated construction requirements to align with BABA and 2 CFR 184, requiring contractors and suppliers to document country-of-origin and adjust sourcing strategies for manufactured components.
Upstream supply is anchored by aggregates, asphalt and cement, structural steel, precast concrete, geosynthetics, and electrical and communications equipment, with logistics relying on multimodal freight (rail, trucking, and inland waterways for oversize loads). Volatile inputs and trade measures have increased the use of price-adjustment clauses and earlier procurement, particularly for long-lead items such as steel and precast elements, which can extend lead times. Mega-corridor work also illustrates the dependency on existing transportation assets, as shown by the Brent Spence Bridge Corridor (USD 4.05 billion), which combines public sponsorship with JV-led delivery (Walsh-Kokosing) and relies on USACE-managed inland waterways and connected freight infrastructure to move heavy equipment and materials.
Competitive Landscape
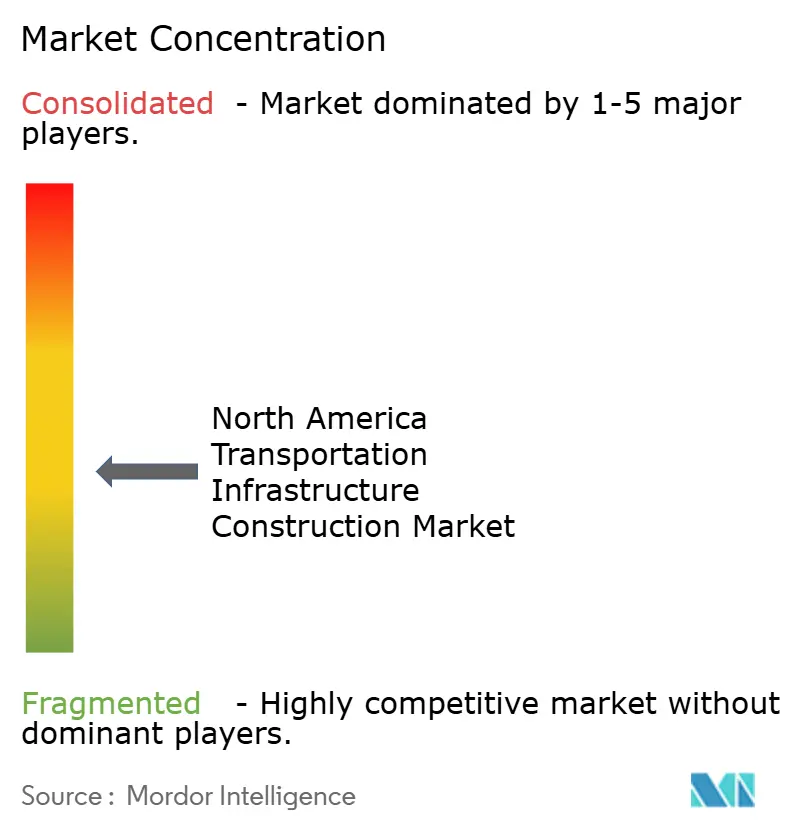
Industry structure is moderately consolidated, with the five largest contractors controlling roughly 45% of revenue. Integrated engineering-procurement-construction firms leverage balance-sheet strength, digital fluency and self-perform capacity to secure multi-billion-dollar packages. Mid-tier players pursue mergers to increase geographic reach and asset-maintenance portfolios, as evidenced by recent asphalt-plant acquisitions aimed at vertical integration.
Technology competencies weigh increasingly on award decisions. Owners now evaluate bidder proficiency in BIM-enabled quantity take-off, drone-based progress tracking and AI-driven safety analytics. Firms able to document reduced rework, improved schedule adherence and lower on-site emissions gain scoring advantages. The North American transportation infrastructure construction market therefore rewards contractors that combine traditional heavy civil expertise with data-engineering capabilities.
Workforce renewal tops corporate risk agendas. Leading contractors partner with community colleges, veterans’ programmes and Indigenous-training initiatives to widen recruitment funnels. Augmented-reality field training, exoskeletons and semi-autonomous earth-moving equipment help improve productivity per labour-hour, partially offsetting crew shortages. Firms that institutionalise such measures are more likely to meet liquidated-damages milestones and protect profit margins.
North America Transportation Infrastructure Construction Industry Leaders
Bechtel Corporation
ACS Group (Dragados & Hochtief)
Fluor Corporation
AECOM
Kiewit Corporation
- *Disclaimer: Major Players sorted in no particular order
North America Transportation Infrastructure Construction Market Companies Covered in this Report
- Bechtel Corporation
- ACS Group (Dragados & Hochtief)
- Fluor Corporation
- AECOM
- Kiewit Corporation
- Skanska AB
- Vinci SA
- SNC-Lavalin Group Inc.
- Granite Construction Inc.
- Tutor Perini Corporation
- PCL Construction Enterprises
- Ferrovial SE
- Parsons Corporation
- Jacobs Solutions Inc.
- HDR Inc.
- Flatiron Construction Corp.
- The Walsh Group
- Zachry Construction Corp.
- Balfour Beatty plc
- Lane Construction Corporation
- WSP Global Inc.
- Black & Veatch
- Lunda Construction Company
- Gilbane Building Company
Read Analysis of North America Transportation Infrastructure Construction Companies

Market Opportunities and Future Outlook
Cross-border freight and trade-corridor capacity is a clear opportunity area, supported by the commissioning of new high-capacity assets and associated approach works. The Gordie Howe International Bridge (USD 6.4 billion) is scheduled to open to traffic on July 27, 2026, creating a new Windsor-Detroit connection that expands throughput and changes traffic allocation across a key US-Canada logistics gateway. This draws in demand beyond the bridge and highway works, extending into border-adjacent roadway connections, safety systems, and operational readiness scope that typically follows major openings.
Funding-program cadence and reauthorization actions are also influencing the addressable pipeline and the mix of work types. In the United States, USD 1.73 billion in FY 2026 BUILD grant awards to 127 projects (with about 77% allocated to road and bridge construction) points to a near-term wave of design, environmental, and early works that then converts into construction packages as grant agreements and final designs mature. Separately, the September 30, 2026 expiration of current surface transportation authorization and the introduction and committee approval activity around H.R. 8870 (BUILD America 250 Act) are sharpening attention on how federal support will be structured after 2026, creating room for contractors and suppliers to navigate formula and discretionary funding pathways, strengthen domestic-content documentation for manufactured products, and combine civil work with technology-heavy scopes such as intelligent transport systems and rail systems integration.
Recent Industry Developments in North America Transportation Infrastructure Construction Market
- June 2026: The California High-Speed Rail Authority board approved a joint venture of Kiewit, Stacy Witbeck, and Herzog for a not-to-exceed USD 3.5 billion track-and-systems contract covering a 119-mile Central Valley corridor. The award concentrates specialized rail systems work (track, signaling-related systems scope, and integration) in a single delivery package and reinforces the role of multi-company JVs for complex rail infrastructure execution.
- April 2026: Maryland and Kiewit Infrastructure Company agreed to end their partnership on the Francis Scott Key Bridge rebuild after a dispute tied to escalating costs, with Kiewit continuing through the end of the year to complete Phase 1 work. The split highlights cost and risk allocation pressure in progressive delivery models and can influence how agencies structure contingencies, escalation clauses, and procurement terms for large bridge programs.
- January 2026: The Los Angeles County Metropolitan Transportation Authority board selected a modified proposal from the Sepulveda Transit Corridor Partners consortium, which includes Bechtel, to advance a fully underground high-capacity rail line concept. The decision advances a major urban rail megaproject into deeper development work and signals continued demand for contractors with tunneling, systems interface, and program management capability.


North America Transportation Infrastructure Construction Market Report Scope and Research Methodology
Market Definition and Coverage
In this methodology, the market covers the value of construction activity tied to transportation infrastructure across North America, including roadways, railways, airports, and ports and inland waterways. It captures spending linked to planning, building, expanding, rehabilitating, and demolition work for publicly accessible assets across the United States, Canada, and Mexico.
Scope exclusions: We exclude rolling stock and transport services, and we also leave out private industrial networks such as proprietary freight yards, depots, and privately owned mining or energy corridors.
Segments Covered in This Report
- By Type
- Roadways
- Railways
- Airways
- Ports and Inland Waterways
- By Construction Type
- New Construction
- Renovation
- By Investment Source
- Public
- Private
- By Country
- United States
- Canada
- Mexico
Data Sources, Market Sizing, and Validation
Desk Research
Desk research was used to set the factual boundaries of transportation infrastructure work and to anchor the demand drivers by country and mode. We reviewed public data sources such as the US Federal Highway Administration (FHWA), the US Bureau of Transportation Statistics (BTS), the US Census Bureau construction spending series, and transportation and infrastructure statistics from Statistics Canada and INEGI in Mexico. For project and funding signals, we also referenced sources such as AASHTO publications, US DOT and Transport Canada program updates, and public tender and procurement disclosures.
To convert these signals into sizing inputs, we relied on a mix of government budget documents, public capital plans, and contractor and owner disclosures in annual reports and investor decks, followed by reputed press coverage for timing checks. Where financial or project details were fragmented, we used paid subscriptions for company financials and intelligence, news and financials, and global contracts and tenders to confirm project starts, award timing, and revisions. The desk sources listed here are illustrative, and we also consulted other public documents to cross-check and clarify data points.
Primary Interviews and Surveys
Primary work focused on validating what is getting built now, what is being delayed, and how price and labor trends are feeding into current contract values. We spoke with a spread of participants, including contractors, engineering and program management teams, materials and equipment-linked suppliers, and public owners across the United States, Canada, and Mexico. We then used these inputs to test mode-wise shares, typical contract structures, and near-term bid activity.
Distribution of primary research fieldwork respondents
| Company type | Respondent position |
|---|---|
| Top tier: 32% | CXOs: 15% |
| Mid tier: 49% | Functional/Unit leaders: 42% |
| Smaller Players: 19% | Managers: 43% |
Market-Sizing & Forecasting
Our sizing approach starts with a top-down build where public budget outlays, multi-year capital plans, and mode-wise spending shares are reconstructed into an annual construction value pool for North America, and then split across the covered infrastructure types. This total is then corroborated using selective bottom-up checks, such as sampling awarded project values from public tenders, checking contractor revenue exposure to transportation works, and running a simple ASP times activity proxy for items like lane-mile upgrades, bridge rehab cycles, and track and station upgrades where data is available.
Several market-specific inputs were used to keep the model grounded, including federal and state or provincial appropriations, the timing of multi-year programs (for example, road and bridge packages), and the split between new construction versus rehabilitation work. We also tracked tender award momentum, labor availability and wage pressure, and key materials cost direction that typically moves bid prices, followed by country mix shifts between the United States, Canada, and Mexico. For forecasting, we used scenario analysis because funding timing, procurement pace, and cost inflation can swing yearly outcomes, and we pressure-tested these assumptions with expert feedback before finalizing the outlook. When bottom-up signals were incomplete for a mode or country, the gap was handled by using validated shares and intensity ratios from comparable programs, then rechecking the implied totals against budget ceilings and award pipelines.
Data Validation & Update Cycle
Outputs are validated through multiple checks so the final numbers stay consistent with what owners are budgeting and what contractors are actually executing. We compare modeled totals against independent signals such as public construction spending series, program obligation rates, and large-project award tracking, then investigate any unusual jumps before sign-off. Assumptions that are most sensitive, like mode-wise mix and price movement, are also reviewed by a second analyst to reduce simple modeling errors.
Reports are refreshed every year, and interim updates are triggered when major policy funding changes, unusually large awards, or sharp cost shifts occur. Before delivery, we run a final pass that rechecks currency conversion timing, confirms any revised government spending tables, and revalidates the near-term pipeline so clients receive an updated view.
Mordor Intelligence's North America Transportation Infrastructure Construction Market Size Measured Against Other Published Estimates
Different published market sizes for transportation infrastructure construction can vary even when the topic sounds identical, because the scope line is often drawn differently across modes and across what counts as construction value. Timing is also a factor, since annual spend can swing with appropriation releases, procurement delays, and the way rehabilitation work is booked versus new build.
In this study, the refresh cadence and currency timing are handled at the year level, and price progression is checked through bid and award behavior before totals are finalized, which is why the 2025 to 2026 step and the forecast run rate may not match older one-time snapshots. This is the same modeling choice applied by Mordor Intelligence.
Benchmark comparison
| Source | Market Size | Gaps in Research Methodology |
|---|---|---|
| Mordor Intelligence | USD 287.27 B (2025) | |
| Trade Journal A | USD 211.80 B (2023) | Uses an earlier base year and tends to mix infrastructure value with broader market framing, while also applying a lower cost escalation path that does not fully reflect recent bid-price movement. |
| Industry Commentary B | USD 288.60 B (2032) | Reports a longer-dated forward value with a different forecast window, and the scope can include adjacent mobility infrastructure items that are not consistently counted as construction activity in transportation capital plans. |
The spread in the table mostly comes from year selection and what is counted inside the construction value pool, especially around rehabilitation versus broader transportation infrastructure themes. By tying the model to annual program funding, award timing, and practical price checks, the estimate stays traceable to repeatable inputs instead of being driven by a single long-range projection.


Key Questions Answered in the Report
What is the current size of the North American transportation infrastructure construction market?
The market is valued at USD 300.37 billion in 2026 and is projected to reach USD 375.44 billion by 2031.
Which segment is growing fastest within the market?
Railways leads growth with a 5.45% CAGR expected between 2026 and 2031, driven by substantial public and private rail investments.
How significant is private financing in regional projects?
Private capital funded 23.70% of 2025 spending and is rising at a 5.60% CAGR over 2026-2031 as public-private partnership models gain wider acceptance.
Why are smart highways important for future infrastructure?
Smart highways integrate sensors, communications and analytics to cut congestion, lower emissions and prepare networks for autonomous and electric vehicles.
What major challenge threatens project schedules?
Skilled-labour shortages persist, with 93% of contractors unable to fill craft positions, causing higher labour costs and potential delays.
Which country is expected to post the highest growth rate?
Mexico is set to record a 5.85% CAGR through 2031, propelled by flagship projects such as Tren Maya and the Isthmus of Tehuantepec Corridor.
Page last updated on:


 Your data is secure and never sold or shared.


