
North America Trade Finance Market Size and Share
Market Overview
| Study Period | 2020 - 2031 |
|---|---|
| Forecast Data Period | 2026 - 2031 |
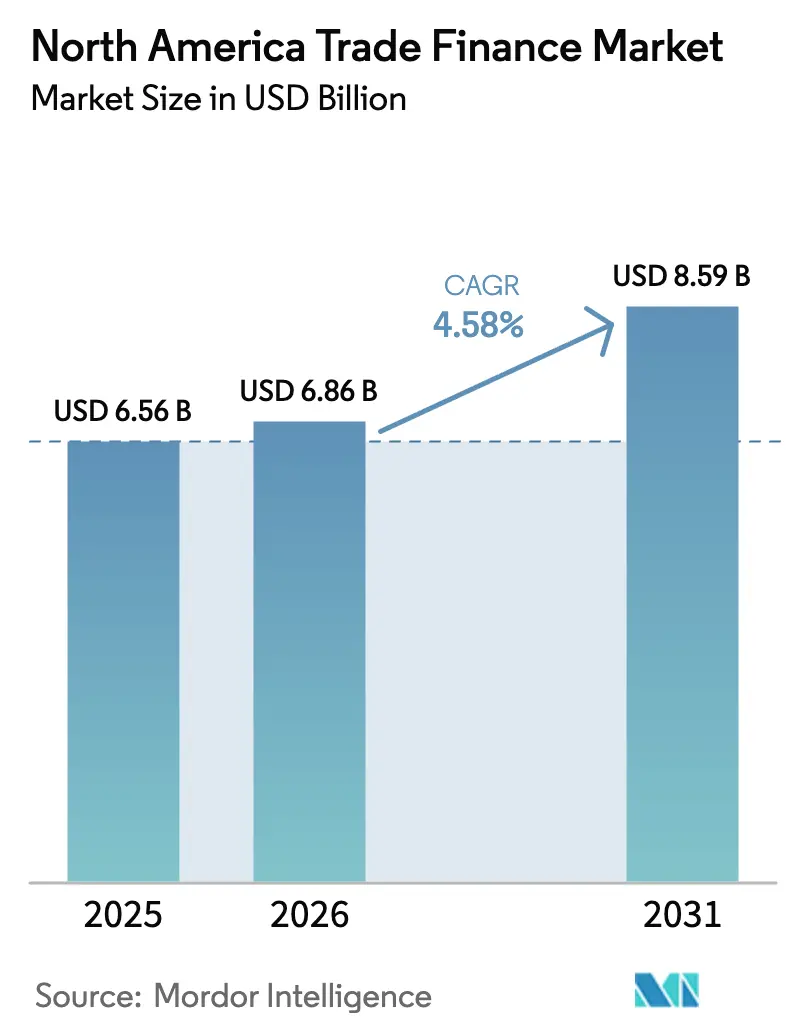
| Base Year Market Size (2025) | USD 6.56 Billion |
| Market Size (2026) | USD 6.86 Billion |
| Market Size (2031) | USD 8.59 Billion |
| Growth Rate (2026 - 2031) | 4.58 % |
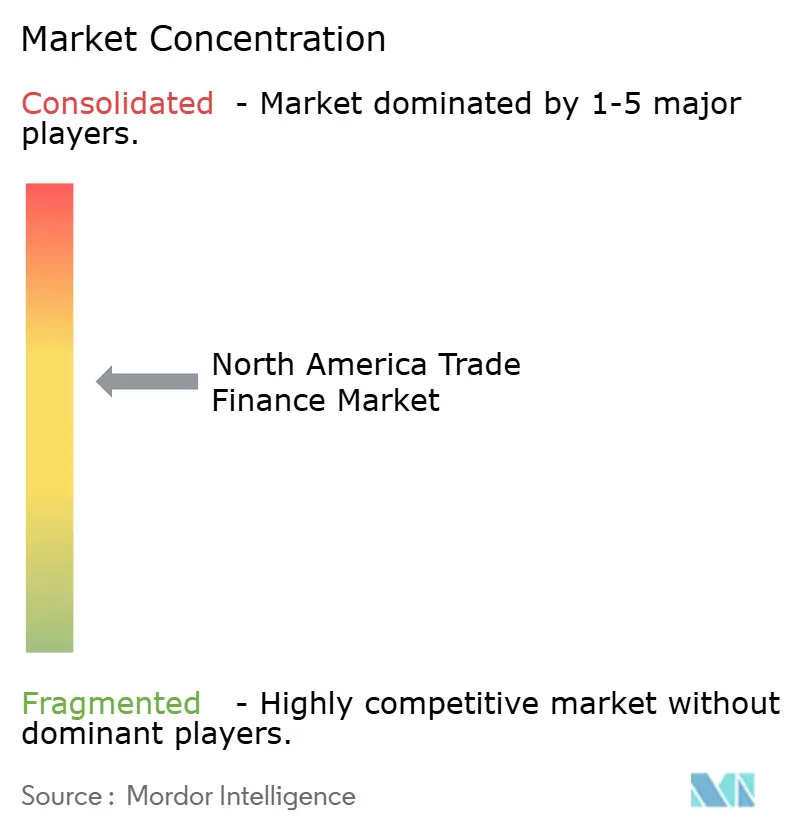
| Market Concentration | Medium |
Major Players *Disclaimer: Major Players sorted in no particular order Image © Mordor Intelligence. Reuse requires attribution under CC BY 4.0. | |
North America Trade Finance Market Analysis by Mordor Intelligence
The North America trade finance market size is expected to grow from USD 6.56 billion in 2025 to USD 6.86 billion in 2026 and is forecast to reach USD 8.59 billion by 2031 at 4.58% CAGR over 2026-2031. Rising cross-border e-commerce, steady nearshoring inflows, and the rapid digitalization of trade documentation are the chief forces behind this expansion. Blockchain-enabled platforms such as JPMorgan’s Kinexys have already processed more than USD 1.5 trillion in notional value, signaling strong demand for real-time, technology-driven settlement. At the same time, USMCA rules of origin and enhanced EXIM programmes are creating new lending opportunities for regional suppliers while tightening compliance requirements. Mexico’s USD 36 billion nearshoring-related FDI in 2023 underscores how production shifts inside North America are boosting local financing needs. Still, AML/KYC costs that reached USD 61 billion in the United States and Canada in 2024 continue to weigh on margins, nudging banks toward AI-based compliance automation[1].
Key Report Takeaways
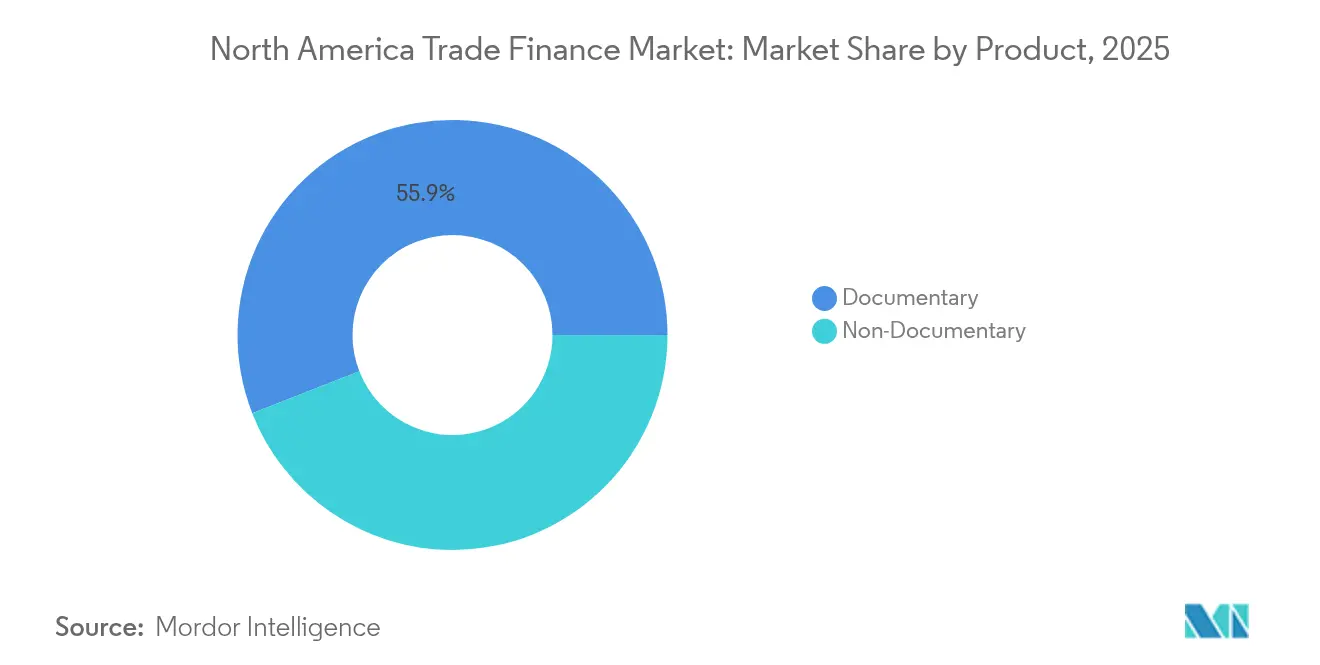
- By product, the documentary segment controlled 55.92% share of the North America trade finance market size in 2025, whereas the non-documentary segment is expected to advance at 5.12% CAGR.
- By service provider, banks held 70.10% of the North America trade finance market share in 2025, while trade finance companies are projected to expand at a 5.68% CAGR through 2031.
- By application, international transactions accounted for 66.55% share of the North America trade finance market size in 2025; domestic trade finance is set to grow at 5.83% CAGR to 2031.
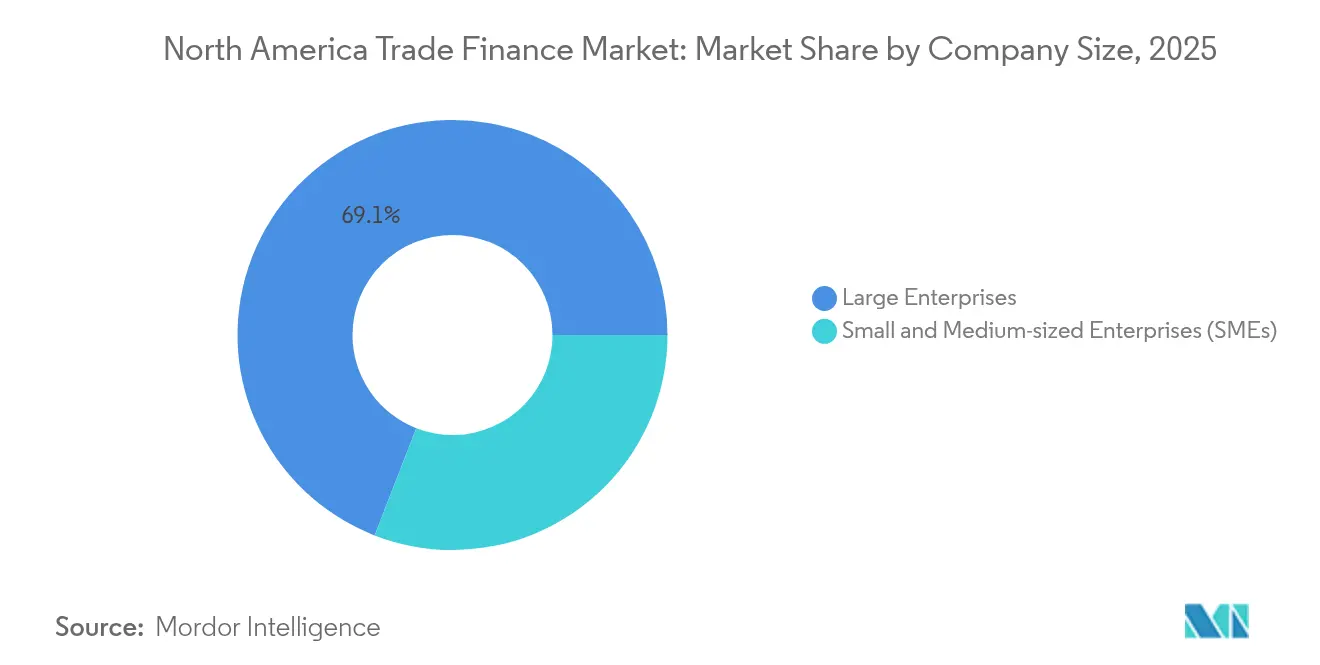
- By company size, large enterprises controlled 69.10% share of the North America trade finance market size in 2025, whereas the SME segment is expected to advance at 6.52% CAGR.
- By country, the United States dominated with 82.15% share of the North America trade finance market in 2025, yet Mexico is the fastest grower at 6.90% CAGR over the forecast period.
Note: Market size and forecast figures in this report are generated using Mordor Intelligence’s proprietary estimation framework, updated with the latest available data and insights as of 2026.
Market Trends and Insights
Drivers Impact Analysis of North America Trade Finance Market*
| Driver | (~) % Impact on CAGR Forecast | Geographic Relevance | Impact Timeline |
|---|---|---|---|
| Cross-border e-commerce expansion | +1.2% | USA–Mexico corridor | Medium term (2-4 years) |
| Digitization and blockchain adoption | +0.9% | Major North American financial centres | Short term (≤2 years) |
| USMCA + EXIM programmes | +0.8% | USA / Canada / Mexico | Long term (≥4 years) |
| Tokenization of trade-finance assets | +0.6% | USA and Canada | Long term (≥4 years) |
| Nearshoring-driven domestic trade | +0.7% | Mexico and southern USA | Medium term (2-4 years) |
| Source: Mordor Intelligence | |||
Cross-border e-commerce expansion
Containerized freight from China to Mexico jumped 59.7% in January 2024, generating immediate demand for inventory finance and embedded payment solutions[2]. Digital payment volumes in the region are set to hit USD 3 trillion in 2024, and platforms such as FedNow are enabling real-time settlement that heightens the need for working-capital tools. Banks are responding with point-of-sale trade finance, illustrated by HSBC’s collaboration with TreviPay to offer flexible terms for cross-border sellers. The convergence of e-commerce and trade finance is therefore reshaping revenue models and risk analytics across the North American trade finance market.
Digitization & blockchain adoption
Citi Token Services moved from pilot to live commercial operations, providing 24/7 cross-border liquidity on private chains for multimillion-dollar flows. JPMorgan’s ClearTrade automates checks on roughly 28 billion physical documents yearly, cutting turnaround from days to minutes. Participation in consortia such as the Marco Polo Network is widening real-time visibility into receivables, while Mexico’s legal recognition of electronic financial documents accelerates digitization. This technology layer is helping the North American trade finance market to counter fraud risk and lower processing costs.
USMCA + EXIM programmes
Automotive content rules that require 75% regional value are leading suppliers to seek specialized compliance finance, particularly for tooling and inventory. EXIM’s ‘Fast-Track’ partnership with PNC Bank streamlines export working-capital lines, supporting mid-market exporters facing longer cash-conversion cycles. With 20 trade disputes already lodged under USMCA, advisory-linked financing has become a niche growth area, and daily freight worth USD 3 billion moving on the NAFTA superhighway demands robust risk management.
Tokenization of trade-finance assets
Tokenization is emerging as a pivotal growth engine in the North American trade finance market. Standard Chartered forecasts that trade-finance instruments could account for 16% of a USD 30.1 trillion tokenized asset pool by 2034. The Federal Reserve’s 2024 analysis of tokenized bonds issued by Santander and the European Investment Bank signals growing regulatory confidence in distributed-ledger settlement for wholesale securities. McKinsey projects the overall tokenized market will exceed USD 2 trillion by 2030, with on-chain money-market funds already surpassing USD 1 billion in assets. Invoice-tokenization platforms such as Zoniqx let businesses convert receivables into fractional blockchain assets within minutes while embedding automated fraud controls. As liquidity migrates to these marketplaces, banks and fintechs that integrate tokenization frameworks can shorten settlement cycles and unlock new fee income streams across the North American trade finance market.
Restraints Impact Analysis of North America Trade Finance Market*
| Restraint | (~) % Impact on CAGR Forecast | Geographic Relevance | Impact Timeline |
|---|---|---|---|
| Rising AML/KYC compliance costs | -0.8% | USA and Canada | Short term (≤2 years) |
| Persistent SME financing gap | -0.6% | Region-wide | Medium term (2-4 years) |
| Cyber-attack risk on e-documents | -0.4% | Global, finance hubs | Short term (≤2 years) |
| Protectionist tariff volatility | -0.5% | Tripartite corridors | Medium term (2-4 years) |
| Source: Mordor Intelligence | |||
Rising AML/KYC compliance costs
Financial institutions in the region incurred USD 61 billion in compliance outlays during 2024, and 98% reported higher spending year over year. TD Bank’s recent settlement under the Bank Secrecy Act highlights the financial penalties involved, which totaled USD 4.6 billion across North America last year. FinCEN’s pending rule calls for mandatory enterprise-level risk assessments, pushing smaller lenders to outsource compliance or exit low-margin trade finance lines. Larger banks are adopting AI screening, but the lag in deployment among smaller entities restricts market inclusivity.
Persistent SME financing gap
Federal Reserve surveys show 80% of small firms still face payments-related obstacles, and only 6% of bank executives believe they serve SMEs effectively[3]. Mid-market CFOs cite cost and documentation complexity as leading barriers, driving alternative platforms such as Visa B2B Connect to fill liquidity needs. The 2025 Small Business Credit Survey found 75% of applicants sought capital mainly for operating expenses, yet satisfaction with lenders declined, reflecting structural gaps in the North American trade finance market.
*Our forecasts treat driver/restraint impacts as directional, not additive. The impact forecasts reflect baseline growth, mix effects, and variable interactions.
North America Trade Finance Market Segment Analysis
By Product:
Documentary Dominance Faces Digital DisruptionDocumentary products accounted for 55.92% of the North America trade finance market share in 2025, underpinned by letters of credit and collections for cross-border shipments. Non-documentary solutions are projected to expand at 5.12% CAGR as multinationals digitize payables and embrace supply-chain finance. Citi’s Digital Bill now reduces receivable monetization from weeks to under an hour, indicating how hybrid offerings merge documentary security with open-account speed. Receivables finance is gaining traction through factoring, proven by Northrim BanCorp’s USD 53.9 million purchase of Sallyport Commercial Finance to scale North American factoring volumes.
Guarantees and insurance remain steady on heightened geopolitical risk, with trade credit capacity up 25% since 2019. Asset tokenization is opening an additional path for liquidity, and banks experiment with digital guarantees lodged on private blockchains to accelerate claim processes. Documentary and non-documentary convergence, therefore, underlines the evolving service mix within the North American trade finance market.

By Service Provider:
Banks Face Fintech ChallengeBanks held 70.10% share of the North America trade finance market in 2025, thanks to compliance scale and multidecade client links. Fintech-led trade finance companies are expected to outpace at 5.68% CAGR, reflecting agility and niche underwriting. Wells Fargo’s integration with TradeSun illustrates incumbent efforts to automate document review and reclaim margin. Insurers carve specialized positions in credit-risk transfer, while platforms such as MODIFI secure USD 100 million from HSBC Innovation Banking to fund SME invoice finance.
Industry consolidation is rising: FIS spent USD 300 million for Demica and Dragonfly to cement supply-chain finance-software scale. Finastra’s partnership with CredAble demonstrates how core-banking vendors embed trade finance modules to defend against point solutions. The competitive axis is shifting from balance-sheet depth toward real-time data analytics across the North American trade finance industry.
By Application:
Domestic Growth AcceleratesInternational business still commanded 66.55% share of the North America trade finance market size in 2025, reflecting the complexity of cross-border flows that require structured risk protection. Domestic trade finance registers a faster 5.83% CAGR on nearshoring activity. Mexico’s rise to the top US trading partner, with USD 475.2 billion in exports, intensifies demand for inventory support inside continental supply chains.
Nearshoring projects valued at USD 36 billion create in-region supplier networks that prefer same-currency, same-day settlement, lifting domestic financing. Half of North American executives now prioritize localization for resilience, and JPMorgan’s LATAM Working Capital Index shows corporates hoarding liquidity to fund regional plant upgrades. This interplay of international and domestic needs shapes the evolution of the North American trade finance market.
By Company Size:
SME Segment Drives InnovationLarge corporates retained 69.10% share in the North America trade finance market size in 2025, owing to entrenched treasury operations and global bank lines. SMEs, however, record a 6.52% CAGR over the forecast period as technology platforms lower onboarding hurdles. U.S. Bank’s alliance with Levantor Capital widens the distribution of dynamic-discounting tools to mid-market supply chains. HSBC’s SemFi joint venture targets digital invoice finance for smaller sellers, showing incumbent recognition of the SME opportunity.
Federal Reserve surveys reveal that 59% of SMEs applied for credit to support expansion, yet many faced documentation challenges. Fintech models using invoice tokenization by firms such as Zoniqx help close gaps by fractionalizing receivables into tradable assets. This trend signals continued diversification of customer mix inside the North American trade finance industry.
By Financing Structure:
Structured Solutions Gain ComplexityNon-structured instruments held a 58.40% share of the North America trade finance market size in 2025, favored for simplicity and speed. Structured trade finance is projected to grow at 5.38% CAGR as corporates demand bespoke receivables securitization and ESG-aligned funding. MUFG Americas arranges asset-backed SPVs that lower the cost for investment-grade exporters. Asset-backed securities issuance in North America reached USD 330 billion, with RBC Capital Markets capturing a 5-9% share.
ESG imperatives add a new dimension: sustainable supply-chain finance rewards lower-carbon suppliers with improved pricing structures. Digital platforms match originators with yield-seeking investors, enhancing transparency. This complexity underscores how structured finance is reshaping funding avenues in the North American trade finance market.
Geography Analysis
United States and Canada Trade Finance Market
The United States retained 82.15% of the North America trade finance market in 2025, supported by robust banking infrastructure and blockchain pilots worth USD 1.5 trillion. Yet compliance costs and tariff shifts—such as duties on Canadian goods effective March 2025—add risk premiums. Canada benefits from USD 761.2 billion in bilateral trade with the United States and ISO 20022 adoption that boosts cross-border payment clarity.
Mexico Trade Finance Market
Mexico is projected to be the fastest-growing market at 6.90% CAGR, propelled by USD 36 billion in FDI and legal acceptance of e-documents that streamline financing. Container shipments from Asia into Mexican ports climbed 59.7% in early 2024, spurring invoice volumes. The Dallas Federal Reserve cautions that infrastructure bottlenecks could moderate growth if unaddressed. Nevertheless, Scotiabank’s award for best trade-finance bank in Mexico signals intensifying competition for local mandates.
Regulatory Landscape
Trade finance in North America is shaped by bank prudential rules and trade-policy programs that influence capital, compliance, and official credit support. In March 2026, US federal banking regulators released revised Basel III capital proposals that kept specific credit conversion factors for trade-related contingent instruments (20% for maturities of one year or less and 50% for over one year), preserving a key parameter for pricing and balance-sheet allocation in letters of credit and guarantees. Industry groups such as BAFT have continued to urge recognition of trade finance as a comparatively low-risk activity in capital rules, while AML/KYC expectations and enforcement remain a material operating constraint for banks and non-bank providers.
On the policy side, the Office of the United States Trade Representative (USTR) outlined priorities in the 2026 Trade Policy Agenda around enforcement and monitoring of trade agreements and reciprocity in trade with China. That can translate into volatility in cross-border documentation, sanctions screening, and counterparty risk assessment. Official export support remains a structural feature of the regional market through the Export-Import Bank of the United States (EXIM) and related federal initiatives, with new or expanded programs in 2026 reinforcing demand for export credit insurance, lender guarantees, and working-capital facilities for exporters and their North American supply chains.
Value Chain Analysis
The North America trade finance value chain connects exporters and importers (with treasuries and procurement teams), logistics providers and customs brokers, banks and non-bank trade finance companies that originate facilities, insurers and ECAs that wrap credit and political risk, and technology vendors that provide document, workflow, and risk platforms. Traditional instruments (letters of credit, collections, guarantees, and trade loans) are increasingly executed through bank portals and integrated corporate channels, with data from invoices, purchase orders, shipping documents, and ERP systems feeding underwriting, compliance screening, and settlement. The documentary-heavy workflow remains central, but digitization is reducing manual checking and compressing turnaround times by shifting from physical documents to structured data and digitally verifiable records.
A visible shift in the chain is the move toward API-led connectivity and cloud-based portals that embed trade finance into corporate ERP and accounting processes, reducing friction from onboarding through post-shipment financing. Bank and vendor initiatives such as Credit Agricole CIBs Optimtrade portal and bank-led digitization efforts highlighted by Citi and HSBC reflect a push toward automated controls, straight-through processing, and interoperability aligned with International Chamber of Commerce (ICC) standards. As digital negotiable instruments and tokenization pilots progress, secondary distribution of trade assets and risk participation can become more software-mediated, linking originators to investors and guarantee providers through more standardized data and audit trails.
Competitive Landscape
Incumbent banks continue to dominate but face rising fintech pressure in the North America trade finance market. Wells Fargo’s TradeSun deployment cuts document checking time by 80%, freeing capacity for value-added advisory. HSBC partnered with Tradeshift to roll out SemFi, embedding credit directly into invoicing workflows for SMEs. Tokenization promises further disruption; Standard Chartered forecasts trade assets could form 16% of a USD 30.1 trillion tokenized pool by 2034.
Strategic consolidation is evident: FIS absorbed Demica and Dragonfly for USD 300 million to bolster software scale, and Northrim BanCorp expanded factoring via its USD 53.9 million Sallyport deal. Cross-bank consortia such as Marco Polo accelerate market standards for blockchain documentation, giving early adopters like BNY Mellon operational leverage. The race centres on digital reach, compliance automation, and balance-sheet flexibility.
North America Trade Finance Industry Leaders
-
JP Morgan and Chase
-
Bank of America Corp.
-
Citigroup Inc.
-
Wells Fargo and Co.
-
HSBC Holdings plc
- *Disclaimer: Major Players sorted in no particular order
North America Trade Finance Market Companies Covered in this Report
- JPMorgan Chase & Co.
- Bank of America Corp.
- Citigroup Inc.
- Wells Fargo & Co.
- HSBC Holdings plc
- BNP Paribas S.A.
- Mitsubishi UFJ Financial Group
- Santander Bank N.A.
- Scotiabank
- Standard Chartered plc
- Commerzbank AG
- TD Bank Group
- Royal Bank of Canada
- CIBC
- US Bank
- PNC Financial Services
- Deutsche Bank AG
- Barclays plc
- Crédit Agricole CIB
- Société Générale
Market Opportunities and Future Outlook
Program-led export support and targeted guarantees create near-term room for SME and mid-market penetration, particularly where banks face higher compliance overhead. In April 2026, the USDA and EXIM expanded their partnership to support agricultural exports through the USDA Financial Assurance to Revitalize Markets (FARM) Initiative and supplemental EXIM export credit insurance, widening the addressable pipeline for pre- and post-shipment finance tied to US producers and their North American counterparties. In 2026, EXIM also expanded its Make More in America Initiative (MMIA) to include a 90% lender guarantee on equipment loans for small and medium-sized manufacturers, supporting demand for supplier finance, tooling and inventory funding, and domestic trade finance linked to nearshoring supply chains.
Digitization also opens opportunities around paperless processing, data-driven underwriting, and interoperability across banks and corporates. Microsoft, ANZ, HSBC, and Lloyds completed an AI-driven proof of concept in April 2026 to automate validation and transmission of trade data from ERP systems to banks based on ICC standards, which reduces documentary friction for SMEs and standardizes compliance checks across high-volume corridors. Platform and product moves such as HSBCs TradeCash and Credit Agricole CIBs Optimtrade show active competition for digital channels, while tokenization initiatives referenced in the report context point to avenues for faster settlement and broader risk distribution when supported by appropriate control frameworks.
Recent Industry Developments in North America Trade Finance Market
- May 2026: JPMorgan Chase expands electronic bills of exchange eBoEs to the US market via Enigio trace original platform, following UCC Article 12 adoption. The launch accelerates digitized settlement in North America trade finance and reduces document handling time. This strengthens cross-border throughput and supports faster value realization in the region.
- February 2026: Citigroup processed a trade finance instrument fully on-chain using Solana blockchain and CIDAP tokenization platform. The move demonstrates blockchain based execution in trade finance. It signals stronger cryptographic controls for cross-border invoicing and settlement.
- January 2026: Citigroup entered global technology partnership with CredAble to digitize trade loan workflows for invoice verification and controls. The deal digitizes control points in trade lending. It strengthens Citi's trade finance controls and digital workflow integration.
North America Trade Finance Market Report Scope and Research Methodology
Market Definition and Coverage
For this study, the North America trade finance market covers the revenues earned from trade-related financing products and services used to support domestic and cross-border goods flows, including arranging, confirming, and risk-mitigating trade payment obligations across the region.
Scope exclusions: It does not count the underlying value of goods traded, general corporate loans not linked to a trade transaction, or treasury services that are not tied to trade financing workflows.
Segments Covered in This Report
- By Product
- Documentary
- Letter of Credit
- Other Documentary Collections
- Non-Documentary
- Receivables Finance (Factoring, Forfaiting, Invoice Discounting)
- Payables/Supply Chain Finance (Reverse Factoring, Dynamic Discounting)
- Direct Lending/Open Account-Based Finance (Trade Loans, Buyer's/Seller's Credit)
- Guarantees (Performance, Bid, Financial Guarantees)
- Insurance Products (Trade Credit Insurance, PRI, ECA Cover)
- Documentary
- By Service Provider
- Banks
- Trade Finance Companies
- Insurance Companies
- Other Service Providers
- By Application
- Domestic
- International
- By Company Size
- Large Enterprises
- Small and Medium-sized Enterprises (SMEs)
- By Financing Structure
- Structured Trade Finance
- Non-Structured Trade Finance
- By Country
- USA
- Canada
- Mexico
Data Sources, Market Sizing, and Validation
Desk Research
Desk research helped us set the market boundaries and build a clean view of how trade volumes, payment terms, and credit conditions translate into demand for trade finance in the US, Canada, and Mexico. We reviewed official and public sources such as U.S. Census Bureau trade statistics, U.S. International Trade Commission data, Statistics Canada trade releases, Banco de Mexico publications, and World Trade Organization trade indicators to anchor the direction of flows and the timing of cycles.
To shape assumptions on product mix and pricing logic, we also used public bank filings, investor presentations, central bank updates, and trade association publications that track letters of credit, guarantees, and receivables financing practices. Where needed, approved paid databases were used for company financials and intelligence, news and financials, and selective import and export shipment-level signals to check trends in corridors and commodity baskets. The desk sources listed here are illustrative, since many other public documents were also used for data collection, clarification, and cross-checking.
Primary Interviews and Surveys
Primary interviews and surveys were used to confirm what is actually being booked as trade finance revenue in North America and how pricing changes with risk, tenor, and documentation complexity. We spoke with practitioners across banks and non-bank providers, and also with exporters, importers, and logistics-linked finance users, and then used those inputs to settle assumptions for fees, utilization, and the split between domestic and international usage across the three countries.
Distribution of primary research fieldwork respondents
| Company type | Respondent position |
|---|---|
| Top tier: 31% | CXOs: 17% |
| Mid tier: 49% | Functional/Unit leaders: 24% |
| Smaller Players: 20% | Managers: 59% |
Market-Sizing & Forecasting
Sizing starts from a top-down reconstruction that links North America trade flows and financing penetration to the fee pool earned on trade finance instruments, followed by adjustments for country mix across the US, Canada, and Mexico. For the demand pool, we track indicators such as merchandise import and export values by corridor, the share of transactions using open account versus bank-intermediated instruments, average credit tenors for trade receivables, and typical fee ranges tied to confirmations, guarantees, and document handling.
A bottom-up approximation is then used as a reality check, where sample provider revenues and product-level pricing cues are combined with estimated activity volumes to test whether the total stays within reasonable bounds. When gaps appear, such as limited disclosure for non-bank activity or bundled fee reporting, we use primary inputs to separate trade finance-linked revenue from adjacent banking fees and then re-run the model. Forecasting relies on scenario analysis supported by simple regression checks, using variables like regional trade growth, interest rate direction, nearshoring-driven corridor expansion, and digitization of documentation that can change processing cost and fee take rates over time.
Data Validation & Update Cycle
Outputs are validated through multiple checks, starting with internal variance testing across countries, products, and application splits, and then by comparing implied fees and revenue intensity against independent trade and credit signals. Outliers are investigated, assumptions are revisited, and follow-up conversations are triggered when a metric moves sharply or conflicts with what practitioners report.
Before sign-off, the model is reviewed in steps so calculation logic, units, and currency treatment are consistent across the full time series. The report is refreshed annually, and interim updates are made when material events occur, such as policy changes that affect trade flows or shifts in banking risk appetite. Right before delivery, a final analyst pass is completed so clients receive the latest updated view.
Mordor Intelligence's North America Trade Finance Market Size Compared Against Other Published Estimates
Published market sizes for trade finance can look far apart because groups often count different revenue lines and they also vary on whether domestic trade support is included alongside cross-border activity. On top of that, some figures blend transaction value with service revenue, which can inflate the number if the definition is not kept tight.
Trade statistics by country corridor and bank reporting cues on fee income are the evidence checks that keep Mordor Intelligence tied to a revenue-based scope for North America, instead of mixing in the financed trade value or unrelated working capital products. The biggest gaps typically come from whether only the US is counted, whether structured commodity-linked deals are added as a separate bucket, and how fee rates are moved forward when interest rates and risk premiums change during the forecast period.
Benchmark comparison
| Source | Market Size | Gaps in Research Methodology |
|---|---|---|
| Mordor Intelligence | USD 6.56 B (2025) | |
| Trade Journal A | USD 10.63 B (2024) | Reported as a US-only value and often discussed alongside trade activity levels, which can be misread as a regional revenue estimate when applied to North America. |
| Regional Consultancy B | USD 12.80 B (2026) | Uses a later base year and a broader fee pool that can fold in adjacent supply chain finance and related banking charges, with limited visibility on how pricing and utilization were validated. |
The spread in the table is mostly explained by definition boundaries and base-year timing, not by a disagreement that trade finance is growing in the region. By keeping the model anchored to observable trade flow signals, practical fee assumptions, and repeatable checks, the estimate stays easy to audit and update as new trade and credit indicators come out.
Key Questions Answered in the Report
What is the current value of the North America trade finance market?
The market stands at USD 6.86 billion in 2026 and is projected to reach USD 8.59 billion by 2031.
Which country drives future growth in North American trade finance?
Mexico is set to grow fastest at a 6.90% CAGR through 2031 due to nearshoring and rising export volumes.
How are compliance costs affecting trade finance providers?
AML/KYC outlays reached USD 61 billion across the United States and Canada in 2024, squeezing margins and encouraging AI-based automation.
What role does blockchain play in regional trade finance?
Platforms such as JPMorgan’s Kinexys have already processed more than USD 1.5 trillion, demonstrating blockchain’s impact on real-time settlement and document automation.
Why are SMEs important for market expansion?
SMEs are the fastest-growing customer group at a 6.52% CAGR over the forecast period, leveraging digital platforms that lower documentation and onboarding barriers.
Which service providers are gaining share apart from banks?
Trade finance companies are projected to expand at 5.68% CAGR, supported by investments such as HSBC’s USD 100 million facility for MODIFI.