
Market Overview
| Study Period | 2021 - 2031 |
|---|---|
| Forecast Data Period | 2026 - 2031 |
| Base Year Market Size (2025) | USD 52.40 Billion |
| Market Size (2026) | USD 54.46 Billion |
| Market Size (2031) | USD 66.08 Billion |
| Growth Rate (2026 - 2031) | 3.94 % |
| Market Concentration | Medium |
Major Players *Disclaimer: Major Players sorted in no particular order Image © Mordor Intelligence. Reuse requires attribution under CC BY 4.0. | |
North America Specialty Food Ingredient Market Analysis by Mordor Intelligence
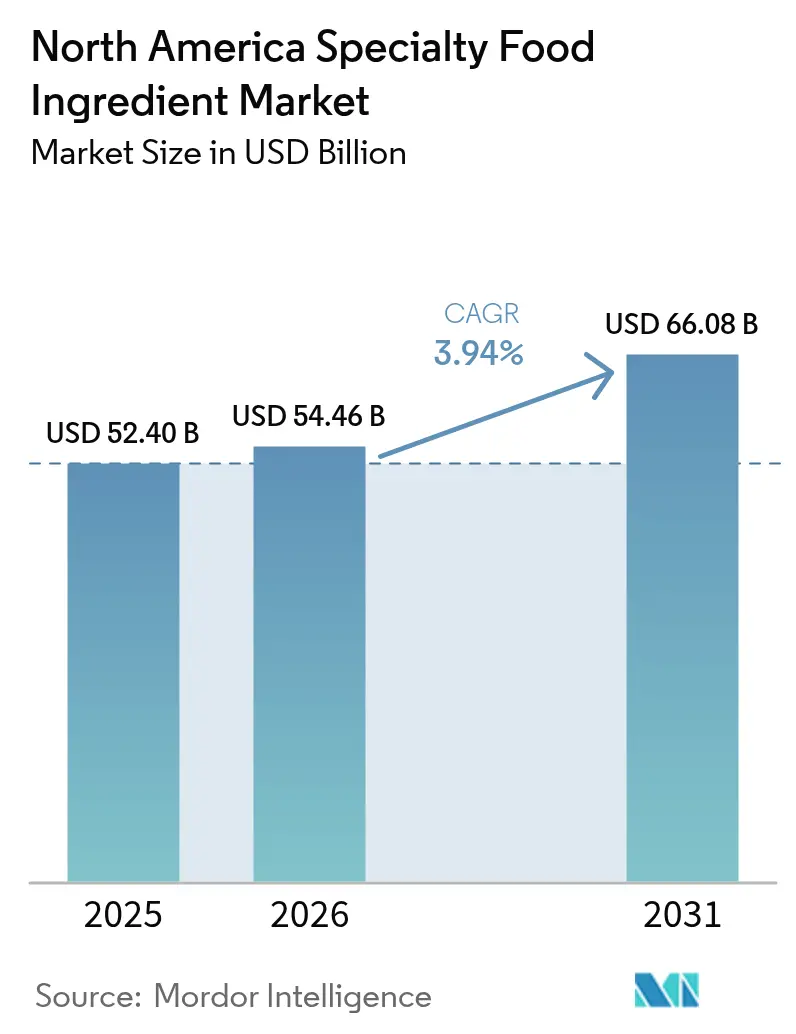
The North America specialty food ingredients market size is expected to grow from USD 52.40 billion in 2025 to USD 54.46 billion in 2026 and is forecast to reach USD 66.08 billion by 2031 at 3.94% CAGR over 2026-2031. This growth reflects the transition of clean-label reformulation, plant-based product development, and proactive health claims from niche trends to mainstream retail expectations. Large multinational companies are focusing on expanding vertical integration to secure botanical and algal inputs, while mid-sized innovators are prioritizing fermentation and enzymatic modification to streamline processing steps. The Centers for Disease Control and Prevention (CDC) reports that 41.9% of adults in the United States are affected by obesity, creating a consistent demand for reduced-sugar sweeteners, probiotic cultures, and omega-3 fortification. Additionally, investments in precision-fermented proteins and postbiotics are accelerating as supply chain disruptions affecting traditional ingredient sources such as cocoa, vanilla, and marine oils have exposed the vulnerabilities of conventional supply pipelines. Companies are leveraging innovative solutions to address these challenges and ensure a stable supply of specialty food ingredients.
Key Report Takeaways
- By product type, food flavors and enhancers led with 16.62% of the North America specialty food ingredients market share in 2025; specialty fats and oils are forecast to expand at a 4.64% CAGR through 2031.
- By application, beverages accounted for 21.78% revenue in 2025, whereas plant-based food and beverage uses are poised to grow at a 4.95% CAGR.
- By geography, the United States captured 73.74% of 2025 revenue, while Mexico is projected to post the fastest 4.85% CAGR to 2031.
Note: Market size and forecast figures in this report are generated using Mordor Intelligence’s proprietary estimation framework, updated with the latest available data and insights as of 2026.
Market Trends and Insights
Drivers Impact Analysis of North America Specialty Food Ingredient Market*
| Driver | (~) % Impact on CAGR Forecast | Geographic Relevance | Impact Timeline |
|---|---|---|---|
| Rising health focus drives demand for probiotics, fibers, omega-3s, and plant proteins | +0.8% | United States, Canada | Medium term (2-4 years) |
| Plant-based and vegan categories rely on specialty ingredients to replicate animal products | +0.7% | United States, Canada, Mexico | Medium term (2-4 years) |
| Functional foods and supplements require specialized bioactive ingredients for growth | +0.6% | United States, Canada | Long term (≥4 years) |
| Clean-label trend replaces artificial additives with natural colors, flavors, and preservatives | +0.5% | United States, Canada | Short term (≤2 years) |
| Lifestyle diseases boost demand for reduced-sugar, reduced-salt, and fortified products | +0.6% | United States, Mexico | Medium term (2-4 years) |
| Digestive and immune health awareness increases demand for fibers, prebiotics, and probiotics | +0.5% | United States, Canada | Medium term (2-4 years) |
| Source: Mordor Intelligence | |||
Rising health focus drives demand for probiotics, fibers, omega‑3s, and plant proteins
Chronic disease prevalence is reshaping ingredient portfolios, with manufacturers focusing on bioactive compounds that provide measurable health benefits. According to the Centers for Disease Control and Prevention's (CDC) National Health and Nutrition Examination Survey, cardiovascular disease affects one in three U.S. adults, driving demand for omega-3 fatty acids sourced from algal and marine origins to support lipid metabolism. DSM-Firmenich's life's OMEGA algal oil, derived from Schizochytrium microalgae, serves as a sustainable alternative to fish oil, offering equivalent eicosapentaenoic acid (EPA) and docosahexaenoic acid (DHA) concentrations while addressing health requirements and concerns over marine resource depletion. Probiotic cultures are expanding beyond dairy products into shelf-stable formats. Chr. Hansen's HOWARU strain portfolio is designed to withstand ambient temperatures and low-pH environments, enabling their incorporation into products like fruit snacks and granola bars. At the same time, plant proteins such as pea, soy, and faba bean are increasingly replacing whey in sports nutrition products, driven by rising lactose intolerance and the growing popularity of flexitarian diets. For example, Glanbia's Avonmore Protein Milk, launched in 2024, features pea protein fortification to cater to consumers seeking muscle recovery benefits without animal-derived ingredients. Fiber ingredients, including inulin and resistant starch, are gaining popularity as prebiotic substrates that support gut microbiota modulation. Tate and Lyle's PROMITOR Soluble Fiber has received Generally Recognized as Safe (GRAS) affirmation for use in baked goods and beverages, further expanding its application in the market.
Plant-based and vegan categories rely on specialty ingredients to replicate animal products
Replicating the texture, flavor, and nutritional profile of meat and dairy products requires a complex combination of proteins, binders, fats, and flavor modulators. Beyond Meat's fourth-generation formulation, introduced in 2024, includes avocado oil and cocoa butter to replicate beef marbling, while methylcellulose and pea-protein isolate provide structural stability during cooking. Achieving sensory parity remains a significant challenge to consumer adoption. According to a McKinsey survey, 52% of United States consumers identify taste as the key factor influencing repeat purchases of plant-based meat, emphasizing the importance of umami enhancers and fat encapsulation. Givaudan's TasteSolutions platform utilizes fermentation-derived heme analogs and yeast extracts to deliver savory depth without relying on monosodium glutamate, catering to clean-label preferences while meeting flavor expectations. Dairy alternatives face similar challenges. For instance, oat milk production requires amylase enzymes to convert starches into soluble sugars, while calcium fortification and emulsifiers like gellan gum prevent phase separation during storage. Ingredion's NOVATION functional native starches support cold-process formulations, reducing energy costs and preserving heat-sensitive vitamins in plant-based yogurts. Additionally, the United States Department of Agriculture's 2024 report on cellular agriculture highlights that precision fermentation could produce casein and whey proteins at 30 percent lower costs than conventional dairy by 2028, indicating a potential shift in protein sourcing.
Functional foods and supplements require specialized bioactive ingredients for growth
Functional foods are shifting from traditional vitamin-fortified cereals to advanced delivery systems designed for bioactive compounds such as peptides, polyphenols, and adaptogens. BASF's Newtrition portfolio includes lutein esters, which support eye health, and lycopene, which promotes cardiovascular health. These products utilize encapsulation technologies to protect carotenoids from oxidative degradation during processing. Omega-3 ingredients are being developed in triglyceride and phospholipid forms, which provide better bioavailability compared to ethyl esters. For example, Lonza's life's DHA (Docosahexaenoic Acid), derived from algae, offers a vegan-friendly option for prenatal supplements. Probiotic innovation is advancing beyond traditional Lactobacillus and Bifidobacterium genera to next-generation strains such as Akkermansia muciniphila, which help regulate intestinal barrier function and glucose homeostasis. DuPont's HOWARU Premium Probiotics received Generally Recognized as Safe (GRAS) status from the United States Food and Drug Administration (FDA) for multiple strains in 2024, enabling their inclusion in products like protein bars and effervescent tablets. Botanical extracts such as turmeric curcumin, green tea catechins, and ashwagandha are moving beyond dietary supplements into functional beverages. Kemin Industries' FloraGLO lutein and BetaVia beta-glucan are being incorporated into ready-to-drink formats aimed at supporting immune health. However, maintaining bioactivity during thermal processing and ensuring extended shelf life remain significant challenges. Addressing these issues requires the use of microencapsulation and pH buffering techniques, which add complexity to the formulation process.
Clean-label trend replaces artificial additives with natural colors, flavors, and preservatives
Consumers are increasingly rejecting synthetic additives, prompting reformulation efforts across the packaged food industry. Natural alternatives are now becoming the standard for new product development. Sensient Technologies' Natural Colors portfolio incorporates anthocyanins derived from purple carrots and spirulina extract to achieve blue hues, replacing FD&C (Food, Drug, and Cosmetic) dyes that are facing regulatory scrutiny in California and European Union (EU) markets. However, natural pigments present challenges with stability under light and heat. For example, anthocyanins degrade at pH levels above 4.5, which limits their use in neutral-pH beverages and necessitates the addition of ascorbic acid to maintain color intensity. Flavor manufacturers are leveraging enzymatic modification and fermentation techniques to create natural vanilla, cocoa, and smoke flavors without extracting them from botanical sources. International Flavors & Fragrances' Nootkatone, produced through grapefruit biotransformation, delivers citrus notes at lower dosage rates compared to cold-pressed oils, thereby reducing formulation costs while meeting clean-label requirements. Preservatives pose the most significant technical challenge, as options like nisin and natamycin provide antimicrobial activity against specific pathogens but lack the broad-spectrum effectiveness of sodium benzoate. This limitation requires the implementation of hurdle technologies, including modified atmosphere packaging, water activity reduction, and refrigeration, to ensure product safety and extend shelf life.
Restraints Impact Analysis of North America Specialty Food Ingredient Market*
| Restraint | (~)% Impact on CAGR Forecast | Geographic Relevance | Impact Timeline |
|---|---|---|---|
| High production costs for natural ingredients reduce manufacturer margins compared to synthetic alternatives | -0.4% | United States, Canada | Short term (≤2 years) |
| Regulatory approvals and GRAS evaluations delay innovation and market entry for novel ingredients | -0.3% | United States, Canada, Mexico | Medium term (2-4 years) |
| Formulation challenges arise when replacing additives with natural options, affecting stability and shelf life | -0.3% | United States, Canada | Short term (≤2 years) |
| Raw-material supply volatility impacts availability and consistency of botanical, marine, and agricultural inputs | -0.4% | North America, global supply chains | Long term (≥4 years) |
| Source: Mordor Intelligence | |||
High production costs for natural ingredients reduce manufacturer margins compared to synthetic alternatives
Natural ingredient extraction and purification require higher capital and operating expenditures compared to petrochemical synthesis, which reduces margins for formulators facing retailer pressure to maintain shelf prices. For instance, rosemary extract, a natural antioxidant, costs between USD 15 and USD 25 per kilogram, whereas synthetic alternatives like Butylated Hydroxyanisole (BHA) or Butylated Hydroxytoluene (BHT) cost only USD 3 to USD 5 per kilogram. Despite the higher cost, rosemary extract provides only 60% to 70% of the oxidative stability in high-fat applications such as nut butters and extruded snacks. Similarly, stevia cultivation and rebaudioside purification involve multi-stage chromatography to isolate the least bitter glycosides, increasing ingredient costs to USD 30 to USD 50 per kilogram, compared to USD 2 to USD 4 for aspartame or sucralose. Fermentation-derived ingredients, such as vanillin from ferulic acid or heme from precision fermentation, require significant bioreactor capital investments and downstream purification processes. These costs can exceed USD 100 million for commercial-scale facilities, creating barriers for smaller ingredient suppliers to enter the market. Natural colors face comparable economic challenges. For example, spirulina extract yields only 10% to 15% phycocyanin by dry weight, necessitating large-scale cultivation ponds and spray-drying infrastructure, which drive costs higher than synthetic alternatives like Blue 1. While price premiums for natural ingredients are partially offset by consumer willingness to pay, this willingness is not absolute. According to Nielsen data from 2024, 73% of U.S. shoppers indicated they would accept a 10% price increase for clean-label products. However, this tolerance diminishes during inflationary periods when discretionary spending declines.
Regulatory approvals and GRAS evaluations delay innovation and market entry for novel ingredients
The United States Food and Drug Administration's (FDA) Generally Recognized as Safe (GRAS) notification process, detailed under 21 CFR Part 170, requires comprehensive safety documentation. This includes toxicology studies, exposure assessments, and manufacturing controls, with timelines typically spanning 18 to 36 months and costs ranging from USD 500,000 to USD 2 million per ingredient [1]. Novel proteins produced through precision fermentation or cellular agriculture face additional scrutiny. For example, Upside Foods' cultivated chicken received FDA clearance in 2024 only after submitting extensive multi-generational animal feeding studies and allergenicity panels, which delayed its commercialization by two years. Botanical extracts with limited consumption history in North America must undergo New Dietary Ingredient (NDI) notifications if marketed as dietary supplements. This process involves a 75-day review period and may also require clinical trials. Similarly, Canada's Novel Food Regulations mandate pre-market assessments, with Health Canada typically taking 12 to 18 months to review dossiers [2]. This often results in regulatory arbitrage, where ingredients are introduced in the United States before obtaining approval in Canada.
*Our forecasts treat driver/restraint impacts as directional, not additive. The impact forecasts reflect baseline growth, mix effects, and variable interactions.
North America Specialty Food Ingredient Market Segment Analysis
By Product Type:
Specialty Fats and Oils Outpace Flavor IncumbentsSpecialty fats and oils are expected to grow at a compound annual growth rate (CAGR) of 4.64% through 2031, representing the fastest growth among product categories. This growth is primarily driven by regulatory bans on partially hydrogenated oils and increasing consumer demand for omega-3 fortification, which are encouraging product reformulations. High-oleic soybean and sunflower oils, developed through conventional hybridization to contain 75% to 80% oleic acid, provide oxidative stability comparable to palm oil while avoiding trans-fat formation during frying. Structured lipids, which are interesterified fats that rearrange fatty acids on the glycerol backbone, offer solid-fat profiles suitable for margarine and shortening applications, reducing the cardiovascular risks associated with trans fats.
Food flavors and enhancers accounted for a 16.62% market share in 2025, primarily driven by their use in savory applications such as processed meats, snacks, and ready meals. Givaudan's TasteSolutions platform utilizes fermentation-derived compounds to replicate umami flavors without relying on monosodium glutamate (MSG), aligning with clean-label requirements in North American retail markets. Sweeteners are evolving into two categories: high-intensity options, including stevia, monk fruit, and allulose, and bulk replacers like erythritol and maltitol, which provide mouthfeel and browning properties in reduced-sugar baked goods. Proteins, particularly plant-based isolates, are undergoing significant innovation. For instance, Ingredion's VITESSENCE Pulse 1550 pea protein achieves 90% solubility at neutral pH, enabling the production of clear protein beverages without the chalky texture associated with earlier-generation ingredients.


By Application:
Plant-Based Beverages Accelerate FastestPlant-based food and beverage applications are expected to grow at a compound annual growth rate (CAGR) of 4.95% through 2031, outpacing other end-use categories as dairy alternatives and meat analogs gain mainstream acceptance. In 2024, oat milk surpassed almond milk in U.S. retail sales, driven by its creamier texture and lower water consumption. This growth is supported by enzymatic hydrolysis, a process that converts oat starches into soluble sugars, removing the need for added sweeteners . Additionally, pea-protein isolates are increasingly replacing soy in ready-to-drink shakes due to their superior amino acid profiles and reduced allergen risks. For example, Glanbia's Avonmore Protein Milk was introduced in Canada, offering 20 grams of protein per 330-milliliter serving.
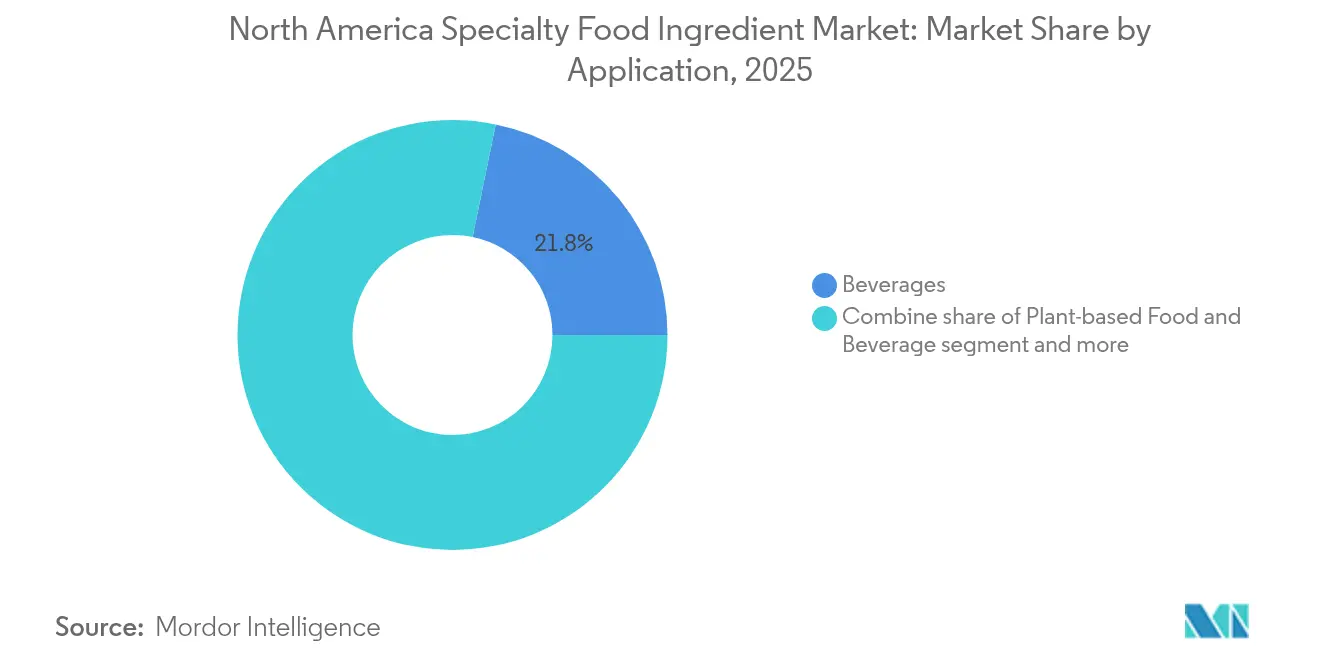
Beverages represented 21.78% of the application share in 2025, making it the largest segment. This category includes carbonated soft drinks, functional beverages, and alcoholic drinks. Innovation in sweeteners remains a critical focus. Cargill's EverSweet stevia sweetener, produced through the fermentation of rebaudioside M, eliminates the licorice aftertaste associated with earlier stevia extracts, enabling sugar reduction in products such as cola and lemon-lime sodas. Functional beverages are also incorporating ingredients like probiotics, adaptogens, and nootropics. For instance, Kerry Group's ProActive Health strains are designed to survive pasteurization, making them suitable for ready-to-drink formats.
Geography Analysis
United States Specialty Food Ingredient Market
The United States is anticipated to dominate the regional market with a 73.74% share in 2025. This leadership is attributed to the country's robust packaged-food industry, early adoption of functional ingredients, and stringent consumer expectations for clean-label products. The United States Food and Drug Administration (FDA) has introduced voluntary sodium-reduction targets and proposed front-of-pack nutrition labeling, which are driving reformulation efforts across the industry. Ingredient suppliers are actively investing in solutions such as salt replacers, sugar alternatives, and natural preservatives to comply with the 2026 regulatory deadlines. A notable example is Cargill's USD 75 million expansion of its pea-protein facility in Fort Dodge, Iowa, in 2024, which reflects confidence in the growing domestic demand for plant-based ingredients. This facility is expected to achieve an annual production capacity of 100,000 metric tons by 2026.
Mexico Specialty Food Ingredient Market
Mexico is projected to experience the fastest growth in the region, with a compound annual growth rate (CAGR) of 4.85% through 2031. This rapid expansion is fueled by the nearshoring of ingredient manufacturing, increasing middle-class incomes, and regulatory alignment with United States food safety standards. Archer Daniels Midland's pea-protein facility in Toluca, commissioned in 2024, is a key development in this space, supplying both Mexican packaged-food brands and United States importers seeking to diversify supply chains away from Asian sources. Furthermore, the Federal Commission for the Protection against Sanitary Risks (COFEPRIS), Mexico's health regulator, has streamlined the approval process for novel ingredients already cleared by the FDA or the European Food Safety Authority (EFSA). This initiative has reduced time-to-market by 6 to 12 months, encouraging multinational companies to prioritize product launches in Mexico over other Latin American markets.
Canada Specialty Food Ingredient Market
Canada, while contributing a smaller share to the regional market, holds strategic importance as a protein-ingredient export hub and an early adopter of health claims for probiotics and omega-3 fatty acids. Roquette's pea-protein complex in Portage la Prairie, Manitoba, is a significant player in this segment, processing 125,000 metric tons of yellow peas annually. The facility supplies North American and European customers with high-quality isolates used in plant-based meat and dairy alternatives, further solidifying Canada's role in the global protein-ingredient supply chain.
Regulatory Landscape
In the United States, specialty food ingredients are governed under the Federal Food, Drug, and Cosmetic Act through FDA food additive regulations and the Generally Recognized as Safe (GRAS) framework (21 CFR Part 170). Novel and functional ingredients that rely on GRAS notifications, including fermentation-derived proteins, postbiotics, and new sweeteners, face longer pre-market preparation cycles and higher documentation requirements. As a result, commercialization sequencing can favor suppliers with in-house toxicology and quality systems.
Canada is advancing a more centralized pathway through Health Canada and the Food and Drug Regulations, including the administrative Lists of Permitted Food Additives incorporated by reference. In December 2024, Canada finalized and registered amendments to regulations concerning food additives, compositional standards, and microbiological criteria (SOR/2024-244). In February 2026, Health Canada published a modification (MFAA-2601) authorizing silicon dioxide in modified sugar up to 2,000 ppm. At the regional level, cross-border ingredient movement continues to operate under the science-based sanitary and phytosanitary framework set out in the Canada-United States-Mexico Agreement (CUSMA/USMCA), supporting regulatory alignment for traded ingredient inputs while national authorities retain approval control for novel uses.
Competitive Landscape
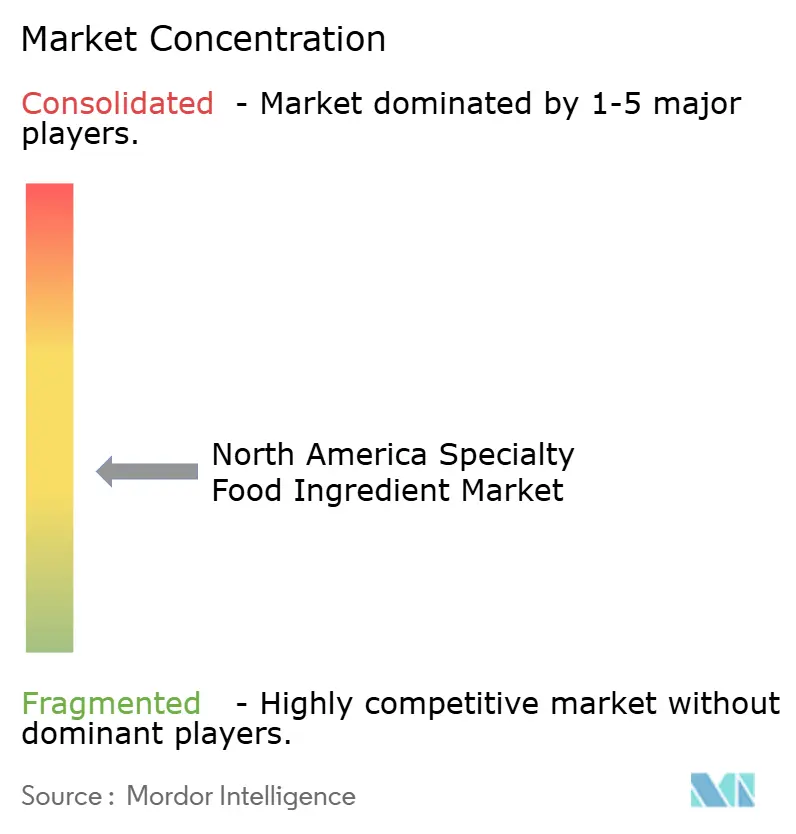
The North America specialty food ingredients market is moderately fragmented, with global multinationals operating alongside specialized enzyme producers, natural-color extractors, and microbial-fermentation startups. Companies such as Cargill, Archer Daniels Midland, and Ingredion leverage vertical integration across agriculture, processing, and distribution to offer comprehensive portfolios that include proteins, starches, sweeteners, and oils. At the same time, niche players like Chr. Hansen and Corbion maintain premium pricing in probiotics and natural preservatives by utilizing proprietary strain libraries and fermentation expertise.
Strategic trends in the market emphasize backward integration into raw material sourcing. For example, Kerry Group has established direct stevia contracts with Paraguayan growers, while DSM-Firmenich operates algal-oil fermentation facilities to reduce supply volatility and achieve cost advantages. Technology adoption is evolving in two directions. Established players are focusing on artificial intelligence (AI)-driven flavor design and precision fermentation, while smaller companies are concentrating on enzymatic modification and patented extraction processes to navigate Generally Recognized as Safe (GRAS) regulatory barriers. Givaudan's 2024 patent filing for AI-optimized flavor formulations, which predict consumer preferences with 85% accuracy, illustrates how computational tools are reducing product development cycles from 18 months to 6 months.
Emerging opportunities in the market include postbiotics, cellular agriculture, and upcycled ingredients. Postbiotics, which consist of heat-killed bacteria and metabolites, address viability challenges commonly associated with probiotics in shelf-stable formats. In 2024, Kerry Group secured Food and Drug Administration (FDA) GRAS affirmation for postbiotic ingredients. Cellular agriculture, particularly precision-fermented dairy proteins, is expected to disrupt traditional whey and casein supply chains. For instance, Perfect Day's animal-free whey, produced through yeast fermentation, achieved cost parity with conventional whey in 2024 and is being adopted by ice cream and protein bar manufacturers seeking sustainability credentials. Upcycled ingredients, such as spent grain from brewing and fruit pomace from juice extraction, align with food-waste reduction mandates while providing fiber and phenolic compounds at lower costs than virgin botanicals. In 2024, the Upcycled Food Association certified 120 North American ingredients.
North America Specialty Food Ingredient Industry Leaders
-
Archer Daniels Midland Company
-
Cargill, Incorporated
-
Ingredion Incorporated
-
Kerry Group plc
-
Tate & Lyle PLC
- *Disclaimer: Major Players sorted in no particular order
North America Specialty Food Ingredient Market Companies Covered in this Report
- Cargill, Incorporated
- Archer Daniels Midland Company
- Ingredion Incorporated
- Kerry Group plc
- Tate & Lyle PLC
- BASF SE
- DuPont de Nemours, Inc.
- Sensient Technologies Corp.
- International Flavors & Fragrances Inc.
- Givaudan SA
- DSM-Firmenich AG
- Chr. Hansen Holding A/S
- Corbion N.V.
- Roquette Frères
- Glanbia plc
- Lonza Group AG
- Jungbunzlauer Suisse AG
- Kemin Industries, Inc.
- Brenntag SE
- Batory Foods
Read Analysis of North America Specialty Food Ingredient Companies
Market Opportunities and Future Outlook
Reformulation programs tied to clean-label and nutrient targets continue to create room for suppliers that can combine taste, texture, and stability solutions into fewer label-friendly components. This is most visible in beverages (21.78% application share in 2025) and in plant-based food and beverage platforms that rely on enzymes, hydrocolloids, emulsifiers, and flavor modulators to replicate dairy and meat sensory profiles. In the United States, FDA oversight of additives and ongoing review of selected chemicals in the food supply are pushing manufacturers toward alternative colors, preservatives, and functional systems that can withstand processing conditions without restricted inputs. At the same time, GRAS and related dossier work keeps demand elevated for ingredient formats that are prepared for regulatory scrutiny.
Supply security and North American manufacturing localization are also practical opportunities as volatility in cocoa, vanilla, and marine oils reinforces interest in fermentation, enzymatic modification, and upcycled inputs. Recent investments point to capacity being added closer to end markets and customers, including ADM's January 2026 investment to expand reformulation capabilities at Erlanger, Kentucky, and ABF Ingredients' April 2026 commitment to build a new Ohly manufacturing facility in Eau Claire, Wisconsin. In Canada, government and industry initiatives supporting domestic food processing resilience, alongside projects such as Jungbunzlauer's planned xanthan gum capacity in Port Colborne, Ontario, are reinforcing the case for specialty hydrocolloids and texturants with lower supply risk and consistent functional performance.
Recent Industry Developments in North America Specialty Food Ingredient Market
- June 2026: Ingredion announced a recommended all-cash offer to acquire Tate & Lyle PLC, aiming to combine complementary portfolios across texture, sweetening, and specialty ingredient systems. The offer increases consolidation pressure in North America as customers look for fewer, larger suppliers that can support reformulation with integrated application labs and scalable manufacturing.
- December 2025: ADM reached an agreement with Planters Cotton Oil Mill to form a cottonseed processing joint venture in Arkansas. The JV strengthens access to edible oil-related streams and processing infrastructure, supporting ingredient availability for specialty fats and oils and helping reduce exposure to external supply disruptions.
- December 2024: Tate & Lyle partnered with BioHarvest to develop botanical-synthesis sweeteners designed to replicate sugar taste with fewer residual off-notes. The collaboration expands the toolkit for reduced-sugar formulations, aligning with clean-label expectations while targeting improved sensory performance in beverages and sauces.
North America Specialty Food Ingredient Market Report Scope and Research Methodology
Market Definition and Coverage
This market covers specialty ingredients used by food and beverage manufacturers in North America to improve taste, texture, shelf life, and nutrition, with sizing tracked on a revenue basis across the supply chain where these ingredients are sold.
Scope exclusions: Commodity bulk ingredients and on-farm raw agricultural outputs that are not sold as specialty functional or sensory ingredients are excluded.
Segments Covered in This Report
- By Product Type
- Functional Food Ingredient
- Vitamins
- Minerals
- Amino Acids
- Omega-3 Ingredients
- Probiotic Cultures
- Other Functional Food Ingredients
- Speciality Starch and Texturants
- Sweetener (Sugar Substitutes)
- Sucralose
- Xylitol
- Stevia
- Aspartame
- Saccharin
- Other Sugar Substitutes
- Food Flavors and Enhancers
- Acidulants
- Preservatives
- Emulsifiers
- Colorants
- Enzymes
- Proteins
- Plant Protein Ingredients
- Soy Protein
- Wheat Protein
- Rice Protein
- Pea Protein
- Other Plant Protein
- Animal, Insect and Microbial Protein Ingredients
- Plant Protein Ingredients
- Speciality Fats and Oils
- Food Hydrocolloids and Polysaccharides
- Anti-Caking Agents
- Yeast
- Food-Grade Glycerin
- Functional Food Ingredient
- By Application
- Bakery Products
- Beverages
- Meat, Poultry, and Seafood
- Dairy Products
- Confectionery
- Fats and Oils
- Dressings/Condiments/Sauces/Marinade
- Pasta, Soup and Noodles
- Plant-based Food and Beverage
- Other Applications
- By Geography
- United States
- Canada
- Mexico
- Rest of North America
Data Sources, Market Sizing, and Validation
Desk Research
Desk work is used to map the ingredient universe and to anchor the model to real manufacturing and consumption signals in the United States, Canada, Mexico, and the rest of the region. We mainly rely on public sources such as USDA (ERS and FAS) for processed food indicators, US Census Bureau and Statistics Canada for manufacturing shipments, UN Comtrade for ingredient-linked trade flows, and FDA publications that influence reformulation and permitted uses.
To keep pricing and mix assumptions realistic, we also review company annual reports, investor presentations, trade association pages, and reputable food industry press that discusses launches and reformulation trends. In a few places, a paid subscription database is used to cross-check company financials and scan patents, which helps confirm which ingredient functions are growing and where capacity is being added. The sources listed above are not exhaustive, and many other public references were used to collect data, validate assumptions, and clarify open questions.
Primary Interviews and Surveys
Primary work is used to pressure-test the desk assumptions and to fill gaps that are not visible in public data, especially around mix shifts, contract pricing behaviors, and which applications are driving demand. We spoke with ingredient suppliers, distributors, and food and beverage formulators across North America, then aligned the findings with usage patterns in key categories such as bakery, dairy, beverages, and convenience foods.
Distribution of primary research fieldwork respondents
| Company type | Respondent position |
|---|---|
| Top tier: 25% | CXOs: 15% |
| Mid tier: 60% | Functional/Unit leaders: 25% |
| Smaller Players: 15% | Managers: 60% |
Market-Sizing & Forecasting
The core sizing starts from a top-down build where processed food output, packaged food consumption, and ingredient intensity are used to reconstruct the addressable demand pool for specialty ingredients in the region. Those demand pools are then split using practical ratios tied to function, such as the share of products that are reformulated for clean-label claims, the penetration of sugar reduction and fortification, and the balance between sensory and functional use cases.
Selective bottom-up checks are added so totals do not drift away from reality. These include sampled supplier revenue cues, application-level volumes multiplied by typical inclusion rates, and channel checks on price ranges for key ingredient groups. When company disclosures are not detailed enough, gaps are handled by using peer benchmarks and then adjusting for footprint and product mix discussed in interviews.
For forecasting, we use scenario analysis supported by short trend models, including exponential smoothing on stable series, because the market moves with both volume growth and mix-driven price effects. Inputs that matter most include packaged food production trends, consumer preference shifts toward clean labels, regulatory actions that change ingredient acceptability, import dependence for certain inputs, and average price movements for high value additives and cultures. These inputs are reviewed with experts before finalizing the outlook.
Data Validation & Update Cycle
Validation is done by checking model outputs against independent signals such as food manufacturing shipment trends, import-export movements for relevant ingredient codes, and plausible ingredient-to-finished-product intensity ranges. Outliers are investigated at the country level first, then at the ingredient-function level. Assumptions are reworked and rechecked before sign-off.
Before publication, the estimates move through multiple analyst reviews so calculation logic, units, and currency handling are consistent. Reports are refreshed annually, and interim updates are made when material events occur, such as major regulatory changes or notable shifts in input pricing. Right before delivery, a final pass is completed so clients receive the most current view available at that time.
Mordor Intelligence's North America Specialty Food Ingredient Market Sizing Compared With Other Published Estimates
Published market sizes for North America specialty food ingredients often differ because the boundary of what counts as "specialty" is not consistent, and because revenue can be captured at different points in the chain. Differences also show up when some studies combine dietary supplements or broader nutraceutical ingredients with food ingredients, or when they include adjacent commodity-grade additives without separating out the premium portion.
Trade-flow checks, packaged food manufacturing shipment trends, and interview-based inclusion rates are used to keep Mordor Intelligence aligned to the specialty ingredient demand pool, so the estimate can sit higher than figures that only count a narrower subset like sensory and functional groupings. It also depends on whether pricing is assumed to rise smoothly each year or updated with step changes from contracts and input cost cycles, and whether the most recent year is revised for inflation timing and currency conventions.
Benchmark comparison
| Source | Market Size | Gaps in Research Methodology |
|---|---|---|
| Mordor Intelligence | USD 52.40 B (2025) | |
| Global Consultancy A | USD 26.34 B (2025) | Uses a tighter product grouping on the page (sensory vs functional), which can leave out several specialty ingredient categories that are used for preservation, processing aids, and cultures, thereby reducing the counted revenue pool. |
| Industry Publisher B | USD 30.34 B (2024) | Anchors the base on a different year and appears to mix broader ingredient lists with uneven year-to-year pricing logic, which can shift the market total depending on how fast price progression and category inclusion are applied. |
The spread mainly comes down to what is included inside "specialty," which year is treated as the anchor, and how price and mix are carried forward. By tying the total to observable food manufacturing signals and then validating key assumptions through interviews, the resulting number stays traceable to clear drivers and can be repeated when new data arrives.
Key Questions Answered in the Report
What is the current value of the North America specialty food ingredients market?
The market is valued at USD 54.46 billion in 2026 and is forecast to reach USD 66.08 billion by 2031.
Which application is growing fastest in the region?
Plant-based food and beverage uses are predicted to expand at a 4.95% CAGR through 2031, outpacing all other applications.
Why are specialty fats and oils in high demand?
They replace partially hydrogenated oils and deliver omega-3 enrichment, underpinning a 4.64% CAGR for the category.
Which country is expected to post the quickest growth?
Mexico is set to record a 4.85% CAGR to 2031, driven by nearshoring and front-of-pack labeling reforms.
How significant is clean-label reformulation to suppliers?
Natural colors, flavors and preservatives are now default specifications, though they raise raw-material costs and require advanced formulation to match synthetic performance.