
Market Overview
| Study Period | 2021 - 2031 |
|---|---|
| Forecast Data Period | 2026 - 2031 |
| Base Year Market Size (2025) | USD 6.96 Billion |
| Market Size (2026) | USD 7.12 Billion |
| Market Size (2031) | USD 8.68 Billion |
| Growth Rate (2026 - 2031) | 4.04 % |
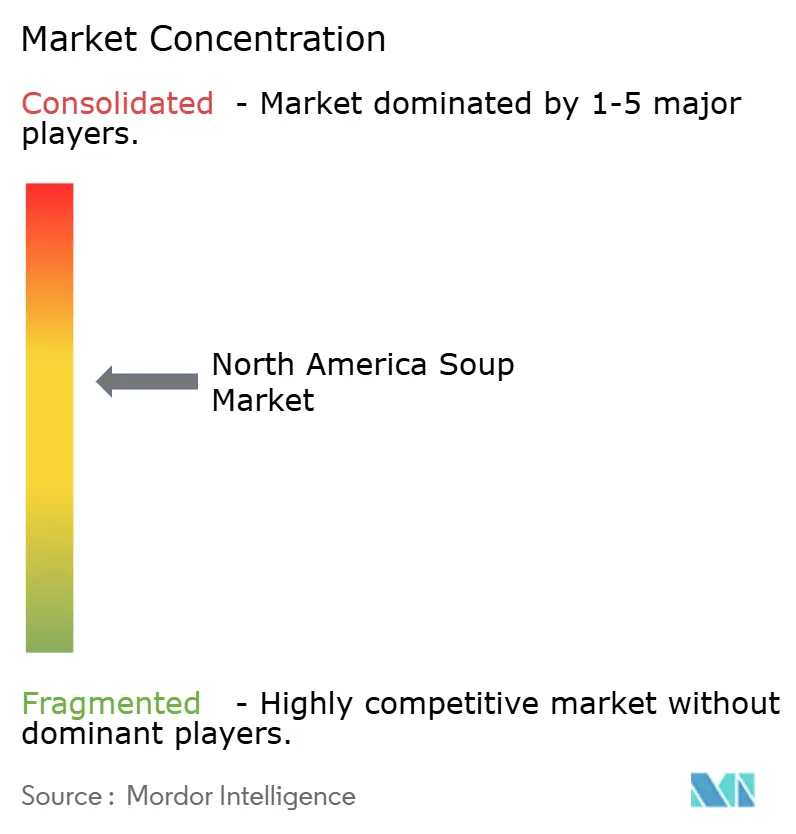
| Market Concentration | Medium |
Major Players *Disclaimer: Major Players sorted in no particular order Image © Mordor Intelligence. Reuse requires attribution under CC BY 4.0. | |
North America Soup Market Analysis by Mordor Intelligence
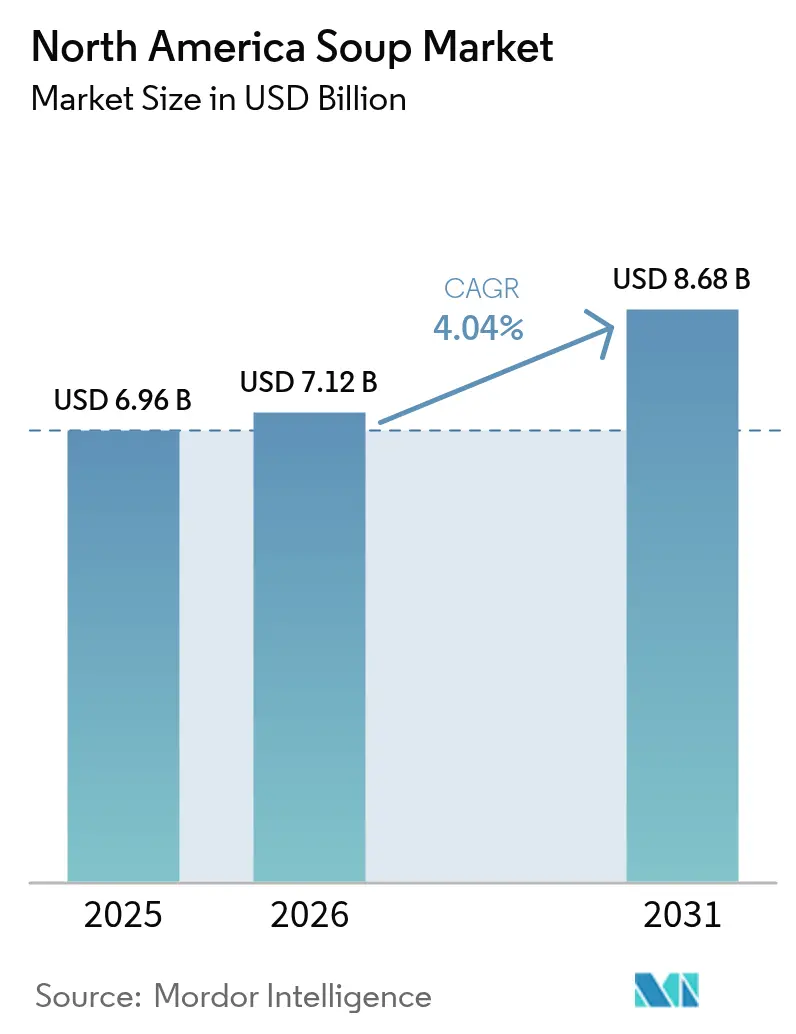
The North America Soup Market size is projected to expand from USD 6.96 billion in 2025 and USD 7.12 billion in 2026 to USD 8.68 billion by 2031, registering a CAGR of 4.04% between 2026 to 2031. This measured expansion highlights how consumers prioritize convenience alongside health considerations, favoring chilled and pouch-based alternatives that align with clean-label standards. Investments in single-serve formats, sodium-reduction reformulations, and plant-based recipes are driving growth opportunities for both established and emerging brands. Retailers are shifting center-store space toward premium and chilled SKUs due to higher per-unit margins, while online channels benefit from direct-to-consumer subscription models. Stricter regulations on sodium content and "healthy" claims are increasing reformulation challenges, benefiting companies with advanced technical capabilities and sensory expertise. Competitive dynamics are further influenced by Campbell Soup Company’s acquisition of Sovos Brands and the growing presence of private-label products, which challenge national brands on price and ingredient transparency.
Key Report Takeaways
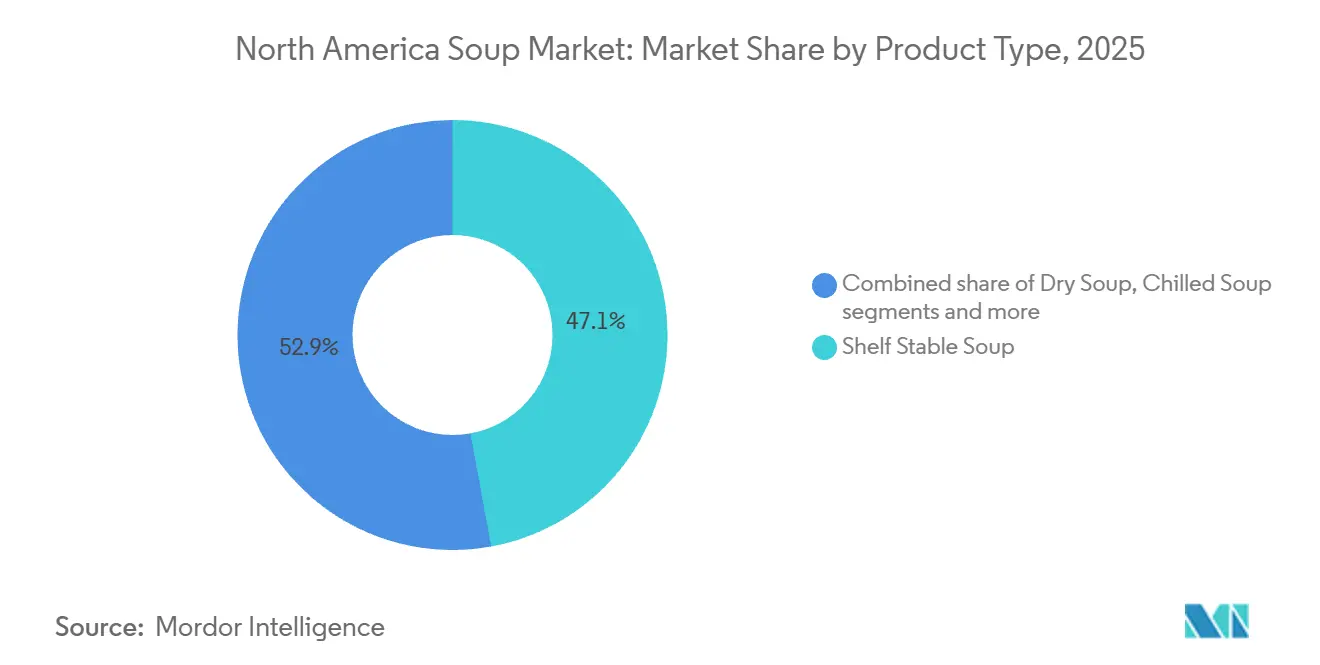
- By product type, shelf-stable soup led with 47.12% revenue share in 2025; chilled soup is forecast to expand at a 4.31% CAGR through 2031.
- By category, non-vegetarian soup accounted for a 65.88% share of the North America soup market size in 2025, while vegetarian soup is advancing at a 4.77% CAGR to 2031.
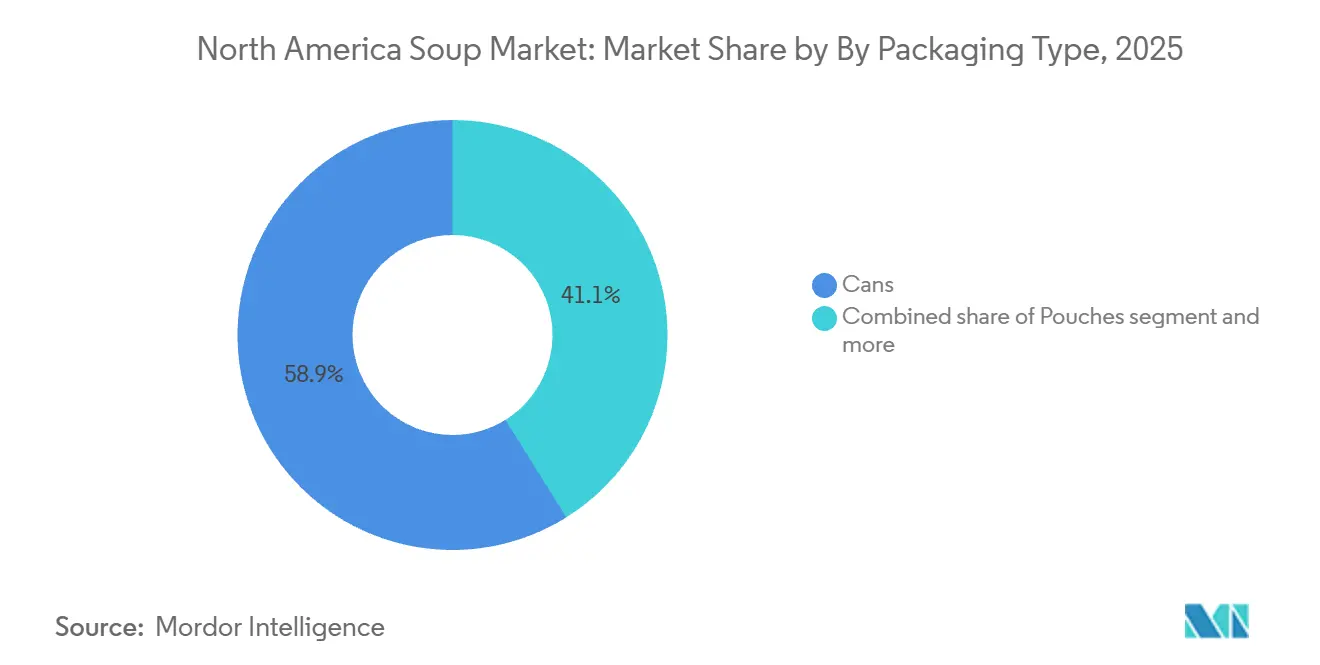
- By packaging, cans retained 58.88% share of the North America soup market in 2025; pouches are projected to grow at a 5.02% CAGR between 2026-2031.
- By distribution channel, off-trade held 70.72% of the North America soup market share in 2025; on-trade channels are rebounding at a 6.12% CAGR through 2031.
- By geography, the United States dominated with 70.11% of 2025 revenue, yet Canada represents the fastest-growing market at a 5.31% CAGR to 2031.
Note: Market size and forecast figures in this report are generated using Mordor Intelligence’s proprietary estimation framework, updated with the latest available data and insights as of 2026.
Market Trends and Insights
Drivers Impact Analysis of North America Soup Market*
| Driver | (~) % Impact on CAGR Forecast | Geographic Relevance | Impact Timeline |
|---|---|---|---|
| Rising demand for convenient single-serve meal options | +0.8% | United States and Canada, with urban centers leading adoption | Short term (≤ 2 years) |
| Expansion of ready-to-eat and frozen soup varieties | +0.6% | United States, Canada, with spillover to Mexico through retail chains | Medium term (2-4 years) |
| Increasing introduction of plant-based and dairy-free soups | +0.7% | United States and Canada, concentrated in coastal and metropolitan markets | Medium term (2-4 years) |
| Growing health awareness boosting demand for low-sodium and organic soups | +0.9% | Canada leading, followed by United States West Coast and Northeast | Long term (≥ 4 years) |
| Advancements in shelf-stable packaging, including pouches and cartons | +0.5% | North America-wide, with faster uptake in United States mass retail | Medium term (2-4 years) |
| Increasing preference for soups aligned with clean-label and simply-made trends | +0.7% | United States and Canada, driven by millennial and Gen Z consumers | Long term (≥ 4 years) |
| Source: Mordor Intelligence | |||
Rising demand for convenient single-serve meal options
Single-serve soup formats are gaining market share from multi-serving cans as consumers with limited time prioritize portion control and convenience. In 2024, Campbell Soup Company launched microwaveable bowl formats for its Chunky line, reducing preparation time to under 90 seconds. This product targets office workers and college students who often lack access to full kitchens. By 2025, retailers are expected to allocate more linear shelf space to single-serve stock-keeping units compared to 2023, driven by higher per-unit margins and reduced markdown risks. This shift also allows brands to explore premium pricing, with single-serve pouches retailing at higher prices compared to per-serving costs in family-size cans. Consumers are less resistant to these higher prices, viewing single-serve options as a distinct convenience category rather than a direct substitute. This trend is particularly evident in convenience stores and airport retail, where impulse purchases account for a significant portion of soup transactions, and speed of consumption takes precedence over price sensitivity.
Expansion of ready-to-eat and frozen soup varieties
Frozen soup is increasingly positioned as a middle ground between shelf-stable and chilled formats, offering extended shelf life without the use of preservatives while maintaining fresh-like taste profiles. According to Conagra Brands' 2026 Future of Frozen report, a growing number of consumers now perceive frozen soup as nutritionally comparable to refrigerated options. This shift is attributed to advancements in blast-freezing techniques that better preserve vegetable texture and color. Retailers are expanding frozen soup shelf space annually, strategically placing these products near frozen entrees to attract meal-planning shoppers. In the ready-to-eat chilled soup category, products like Campbell's Chunky Chili with Beans, introduced in a refrigerated format in 2024, are leveraging clean-label claims and shorter ingredient lists. These attributes enable chilled soups to command a price premium over canned alternatives, appealing to health-conscious consumers who prioritize perceived freshness over extended shelf life. The combined frozen and chilled soup segments are projected to represent a significant portion of total soup volume in the coming years. This growth is supported by improvements in cold-chain infrastructure and the entry of private-label brands offering competitive pricing.
Increasing introduction of plant-based and dairy-free soups
Plant-based soup innovation is expanding beyond traditional vegetable broths to include dairy-free cream soups, lentil-based bisques, and mushroom-focused varieties that replicate the texture of dairy without compromising flavor. The Kraft Heinz Company introduced a line of oat milk-based cream soups in early 2025, targeting lactose-intolerant and flexitarian consumers, who are estimated to make up 35% to 40% of United States households. In January 2025, Natural Grocers increased its organic soup assortment by 22%, emphasizing plant-based stock-keeping units that meet non-genetically modified organism and United States Department of Agriculture Organic certifications, signaling retailer confidence in sustained demand. Pea protein and chickpea flour are gaining popularity as thickening agents, providing six to eight grams of protein per serving while avoiding allergen concerns linked to soy. This trend is creating opportunities for brands to differentiate by balancing plant-based positioning with flavor parity to animal-based soups. Challenges in adoption, previously limited by taste concerns, are being addressed through advancements in flavor masking and umami enhancement techniques.
Growing health awareness boosting demand for low-sodium and organic soups
Health Canada's sodium reduction targets, which require soup manufacturers to reduce sodium levels to 420 milligrams per 250-milliliter serving by the year 2026, are stricter than the guidelines set by the United States Food and Drug Administration (FDA) [1]. These targets are prompting reformulation investments across the Canadian market. Organic soup sales in Canada grew by 18% year-over-year in 2025, significantly outpacing the 4% to 5% growth observed in conventional soup. This growth is attributed to consumer perceptions that organic certification ensures lower pesticide residues and cleaner ingredient sourcing. Low-sodium soups, defined as containing less than 140 milligrams of sodium per serving, accounted for 8% to 10% of total soup volume in 2025, up from 5% in 2023. This growth is driven by aging demographics and the rising prevalence of hypertension. To address the technical challenges of reducing sodium without introducing bitter aftertastes, brands are investing in potassium chloride blends and fermented vegetable extracts as sodium replacements. The FDA's updated "healthy" claim criteria, effective in 2025, are providing a regulatory incentive for reformulation. Products that meet these standards can display front-of-package "healthy" labeling, which has been shown to drive a 10% to 15% increase in sales in early adopter categories.
Restraints Impact Analysis of North America Soup Market*
| Restraint | (~) % Impact on CAGR Forecast | Geographic Relevance | Impact Timeline |
|---|---|---|---|
| Consumer concerns regarding ultra-processed and canned food perceptions | -0.6% | United States and Canada, concentrated among millennial and Gen Z demographics | Medium term (2-4 years) |
| High sodium levels in traditional canned soups | -0.5% | United States and Canada, with regulatory pressure intensifying in Canada | Long term (≥ 4 years) |
| Competition for shelf space from snacks and refrigerated entrees | -0.4% | United States, driven by center-store compression in mass retail | Short term (≤ 2 years) |
| Food safety and recall risks associated with canned and packaged soups | -0.3% | North America-wide, with heightened scrutiny following 2024-2025 recalls | Medium term (2-4 years) |
| Source: Mordor Intelligence | |||
Consumer concerns regarding ultra-processed and canned food perceptions
Ultra-processed food consumption makes up 55% of total caloric intake in the United States. However, increasing awareness of its connection to metabolic diseases is influencing consumer preferences toward minimally processed alternatives [2]. Canned soup, traditionally seen as a pantry staple, is now often categorized by younger consumers as ultra-processed. This classification is associated with a decline in purchase intent among households with children under the age of twelve. According to the International Food Information Council's 2025 survey, a growing percentage of U.S. consumers actively avoid products labeled as "processed," reflecting a significant rise compared to 2023. This trend creates challenges for traditional canned soup formats that rely on preservatives and flavor enhancers [3]. In response, brands are focusing on highlighting "no artificial ingredients" and "recognizable components" on front-of-package labels. However, addressing long-standing perceptions requires significant marketing efforts and product reformulation, which many regional players find financially challenging. This shift is driving premiumization, as consumers are willing to pay a higher price for chilled or organic soups, perceiving them as less processed, even when the functionality of their ingredients is similar.
High sodium levels in traditional canned soups
Traditional canned soups often contain high levels of sodium per serving, exceeding the United States Food and Drug Administration's Phase II voluntary target. This sodium content represents a significant portion of the recommended daily intake in a single meal. Health Canada's stricter target is driving faster reformulation in the Canadian market, where sodium-related health claims are more rigorously enforced. High sodium levels reduce the appeal of soups among aging consumers who are managing hypertension and cardiovascular risks. This group, which makes up a substantial portion of soup purchasers, is increasingly turning to low-sodium alternatives or leaving the category altogether. Reformulating soups to meet voluntary sodium targets requires investment in flavor systems that replicate salt's taste-enhancing properties, such as yeast extracts, mushroom powders, and fermented ingredients. These changes increase ingredient costs by a significant percentage, compressing margins for brands unable to pass on the additional costs to consumers. Additionally, the potential adoption of front-of-package warning labels in the United States, following examples set in Latin America, could reduce sales of high-sodium soups by a notable percentage, highlighting the urgency for brands to proactively reformulate their products.
*Our forecasts treat driver/restraint impacts as directional, not additive. The impact forecasts reflect baseline growth, mix effects, and variable interactions.
North America Soup Market Segment Analysis
By Product Type:
Chilled Formats Gain as Freshness Perception Drives PremiumizationCampbell Soup Company's planned launch of Chunky Chili with Beans in a refrigerated format in 2024 highlights a strategic focus on the chilled soup category. This segment is projected to grow at a compound annual growth rate (CAGR) of 4.31% through 2031, despite representing only 8% to 10% of total market volume in 2025. Shelf-stable soup, which is expected to hold a 47.12% market share in 2025, remains the dominant category. Its popularity is driven by legacy brands and private-label offerings that prioritize cost-effectiveness and pantry convenience. However, this segment is experiencing slower growth as consumers increasingly prefer formats perceived as fresher and less processed.
Dry soup, which includes instant noodles and powder-based varieties, constitutes a significant portion of the market and is growing steadily. This growth is fueled by innovations in single-serve packaging and the rising demand for ethnic flavors, such as ramen and pho, particularly among younger consumers. Meanwhile, frozen soup is expanding at a notable compound annual growth rate, supported by advancements in blast-freezing technology. These technological improvements enhance vegetable texture and color while extending shelf life without the need for preservatives. Chilled soup, priced at a premium compared to canned alternatives, benefits from consumer perceptions associating refrigeration with minimal processing and higher ingredient quality, even when functional differences are minimal. Retailers are responding to this trend by increasing refrigerated shelf space for soup by a significant percentage compared to previous years. These products are strategically placed near fresh salads and deli entrees to appeal to meal-planning shoppers.

By Category:
Vegetarian Soup Gains as Flexitarian Diets and Plant-Based Innovation Reshape DemandNon-vegetarian soups are projected to hold a 65.88% market share in 2025, driven by strong consumer preferences for chicken, beef, and pork-based broths that provide savory flavors and high protein content. Meanwhile, vegetarian soups are anticipated to grow at a compound annual growth rate (CAGR) through 2031, supported by the increasing popularity of flexitarian diets. The Kraft Heinz Company's launch of oat milk-based cream soups in early 2025 highlights a strategic focus on dairy-free and plant-based products. These offerings are expected to command a 20% to 25% price premium, appealing to lactose-intolerant and environmentally conscious consumers. Consumers seeking animal-based nutrition are increasingly turning to alternatives such as jerky, protein bars, and ready-to-eat chicken bowls, which offer higher protein density per calorie. On the other hand, vegetarian soups are benefiting from ingredient innovations that go beyond traditional vegetable broths. Examples include lentil-based bisques, mushroom-focused varieties, and chickpea-thickened soups, which deliver 6% to 8% of plant protein per serving.
Retailers are responding to the rising demand for vegetarian soups by expanding their product offerings. For example, Natural Grocers increased its organic soup assortment by 22% in January 2025, with a focus on vegetarian stock-keeping units (SKUs). This expansion reflects confidence in sustained consumer interest and a willingness to allocate premium shelf space to these products. The growing demand for vegetarian soups is also driven by consumers' increasing awareness of health benefits and environmental sustainability, encouraging retailers to prioritize these products in their assortments and marketing strategies.
By Packaging Type:
Pouches Advance as Convenience and Sustainability ConvergePouches are projected to grow at a compound annual growth rate (CAGR) of 5.02% through 2031, driven by their microwaveable convenience, 30% to 40% weight reduction compared to cans, and retailer incentives offering 5% to 8% higher margins due to lower handling costs and reduced shelf damage. Cans are expected to hold a 58.88% market share in 2025, supported by established distribution networks and consumer familiarity. However, their growth is limited to a CAGR of 3.7%, as younger demographics increasingly view rigid packaging as outdated and less environmentally friendly. Cartons are anticipated to capture 12% to 15% of the market share in 2025, growing at a CAGR of 4.5%, benefiting from their association with fresh dairy and juice products, which are often perceived as premium. Other packaging formats, such as glass jars and flexible trays, are expected to hold an 8% to 10% market share, growing at a CAGR of 4.3%, driven by niche brands targeting gift-giving occasions and specialty retailers.
Campbell Soup Company's initiative to ensure 100% of its packaging is recyclable, reusable, or compostable by 2030 is accelerating the adoption of pouches. Flexible formats generate 40% to 50% lower carbon emissions during production and transportation compared to steel cans. However, the underdeveloped recycling infrastructure for pouches in most United States municipalities creates a gap between sustainability claims and actual end-of-life outcomes. Cans continue to offer advantages in pantry storage and shelf life, typically lasting 18 to 24 months compared to 12 to 15 months for pouches. Despite this, cans are losing market share in single-serve and premium segments, where convenience and the perception of freshness are prioritized over durability.
By Distribution Channel:
On-Trade Rebounds as Foodservice Operators Reintroduce Soup as High-Margin AppetizerOn-trade channels are projected to grow at a CAGR of 6.12% through 2031, recovering from pandemic-era declines as restaurants, cafeterias, and institutional foodservice operators reintroduce soup as a high-margin appetizer. These operators are also leveraging single-serve formats to reduce kitchen labor. Off-trade channels are expected to hold a 70.72% market share in 2025, with supermarkets and hypermarkets accounting for the majority of total soup volume. However, growth in these channels is limited due to center-store compression and increased competition from private-label products. Within the off-trade segment, online retail stores are experiencing notable growth, driven by subscription models and direct-to-consumer brands offering premium positioning and personalized assortments unavailable in traditional brick-and-mortar outlets. Convenience and grocery stores also maintain a significant share of the off-trade market, supported by innovations in single-serve products and impulse purchase opportunities.
Data from the National Restaurant Association indicates that the percentage of full-service restaurants offering soup as a menu item increased from 58% in 2023 to 2025. This reflects operators' recognition of soup's ability to deliver high gross margins and its lower labor requirements compared to entrees. Campbell Soup Company's foodservice division is targeting institutional channels, including schools, hospitals, and corporate cafeterias, by providing bulk formats and customizable flavor profiles that align with dietary guidelines and regional preferences.
Geography Analysis
United States Soup Market
In 2025, the United States leads the market with a commanding 70.11% share, supported by well-established consumption patterns and an extensive retail network. However, growth in the U.S. is relatively modest, with a compound annual growth rate (CAGR) of 3.9% projected through 2031. This slower growth is attributed to challenges such as center-store compression and increased competition from refrigerated entrees. Regional preferences within the United States are shifting, with the West Coast and Northeast showing a growing demand for organic, low-sodium, and plant-based soups, while the Midwest and Southern regions continue to favor traditional canned soups and meat-based broths. In 2024, Campbell Soup Company divested its Campbell Fresh division, which included refrigerated soups and beverages, to focus on shelf-stable and premium segments. This strategic decision reflects a move away from fresh formats that require cold-chain logistics and are more susceptible to spoilage. Additionally, the United States Food and Drug Administration's (FDA) Phase II sodium reduction targets, which aim for 480 milligrams per serving by 2026, are driving reformulation investments. However, since compliance is voluntary, legacy brands prioritizing cost over health positioning may not experience immediate impacts.
Canada Soup Market
Canada is the fastest-growing segment in the region, with a CAGR of 5.31% expected through 2031. This growth is supported by stricter sodium guidelines from Health Canada, higher penetration of organic products, and a rapid shift toward plant-based soup varieties. Health Canada's sodium reduction target of 420 milligrams per 250-milliliter serving is more stringent than the Food and Drug Administration's guidelines in the U.S., prompting quicker reformulation cycles. Brands that can achieve low-sodium taste parity are gaining a competitive advantage in the Canadian market.
Mexico and Broader North America Soup Market
Mexico and the rest of North America collectively account for a notable market share in 2025, with growth driven by urbanization, increasing disposable incomes, and the retail expansion of multinational chains like Walmart and Costco, which are introducing premium soup assortments. In Mexico, the soup market is characterized by a strong preference for traditional broths and ethnic flavors such as pozole, menudo, and caldo de res, which align with local culinary traditions. However, these flavors remain underrepresented by multinational brands that often focus on standardized product offerings. Grupo Jumex S.A. de C.V., a leading Mexican food and beverage company, is expanding its soup portfolio to meet domestic demand and leverage its existing distribution networks. Despite this, the company faces competition from imported U.S. brands, which are often perceived as offering superior quality.
Regulatory Landscape
In the United States, soup labeling and formulation are governed by the US Food and Drug Administration (FDA) under 21 CFR Part 101 and related guidance in the Food Labeling Guide, shaping nutrition facts, ingredient declarations, and claim compliance for shelf-stable, chilled, and frozen soups. The FDA also set a uniform compliance date of January 1, 2028, for food labeling regulations published between January 1, 2025, and December 31, 2026, which affects the timing of label redesign cycles and inventory sell-through planning for multi-SKU soup portfolios.
In Canada, the Canadian Food Inspection Agency (CFIA) oversees enforcement for food labeling requirements, and the transition period for mandatory front-of-package (FOP) nutrition symbol labeling for foods high in sodium, saturated fat, or sugars ended on December 31, 2025, with full enforceability beginning January 1, 2026. For soup manufacturers, the Canadian FOP requirement intersects with the category's sodium-reduction push (including Health Canada sodium targets referenced in the market context), increasing the need for Canada-specific packaging compliance and reformulation to avoid high-in warnings on pack while maintaining taste and texture.
Value Chain Analysis
The North America soup value chain starts with agricultural and ingredient inputs (vegetables, grains and legumes, meat and poultry, dairy or plant-based alternatives, seasonings, and functional ingredients such as yeast extracts and fermentation-derived flavors used for sodium reduction), along with packaging inputs (steel cans, flexible pouches, and cartons). These feed into manufacturing and co-manufacturing operations that cover cooking, blending, thermal processing (retort for canned soup and aseptic for selected shelf-stable products), and cold-chain handling for chilled and frozen formats, followed by quality assurance and regulatory labeling sign-off tailored to US and Canadian requirements.
Distribution is led by off-trade (supermarkets/hypermarkets, convenience and grocery stores, and online retail), with foodservice and institutions as important on-trade/away-from-home outlets for bulk formats. Supply-chain optimization and regional warehousing have become more visible levers for service levels and cost control: Campbell announced a USD 230 million supply chain optimization plan through fiscal 2026 to modernize manufacturing, increase agility, and leverage co-manufacturing partners, and a September 2025 redistribution partnership with G&C Foods emphasized next-day delivery from regional warehouses (Syracuse, NY and Alachua, FL). Upstream resilience initiatives also show up in tomato sourcing, with Campbell and partners receiving a USD 3.4 million USDA Regional Conservation Partnership Program grant in October 2024 to support sustainable tomato-growing practices in California, linking ingredient availability and sustainability goals to downstream brand and retailer requirements.
Competitive Landscape
The North America soup market demonstrates moderate concentration, with Campbell Soup Company, The Kraft Heinz Company, and PepsiCo Incorporated collectively accounting for approximately 45% of the market share. This leaves significant opportunities for regional players, private-label brands, and direct-to-consumer challengers to capture value in niche segments. Campbell's USD 2.7 billion acquisition of Sovos Brands in June 2024, which includes the Rao's premium Italian portfolio, highlights a strategic shift toward higher-margin, minimally processed products. These offerings command 20% to 30% price premiums and exhibit lower price elasticity during economic downturns.
Major incumbents are leveraging their scale advantages in research and development, sensory laboratories, and regulatory compliance to accelerate reformulation cycles. These efforts align with Food and Drug Administration (FDA) sodium reduction targets and Health Canada guidelines, creating competitive barriers that smaller players find challenging to overcome without external funding. Meanwhile, private-label soup is growing at a compound annual growth rate (CAGR) of 5% to 6%, driven by retailer investments in premium store brands. These private-label products offer 15% to 20% cost savings compared to national brands while maintaining comparable quality, as evidenced by blind taste tests. This trend is compressing the market share of branded products in price-sensitive segments.
White-space opportunities are emerging in functional soups, such as immunity-boosting, protein-enriched, and gut-health formulations. These products allow brands to leverage ingredient innovation to justify 30% to 40% price premiums and differentiate themselves from traditional offerings. Additionally, direct-to-consumer brands are bypassing conventional retail distribution channels by offering subscription models and personalized assortments. These approaches appeal to millennial and Generation Z consumers who prioritize convenience and transparency. Technology adoption is also accelerating in the market. Blockchain-based traceability systems are enabling lot-level tracking, which enhances recall precision and boosts consumer confidence. Furthermore, artificial intelligence (AI)-driven flavor optimization is reducing reformulation timelines by 20% to 30% and lowering research and development costs, providing a competitive edge to companies adopting these technologies.
North America Soup Industry Leaders
-
The Campbell's Company
-
General Mills Inc.
-
Kraft Heinz Company
-
Nestlé SA
-
Unilever PLC
- *Disclaimer: Major Players sorted in no particular order
North America Soup Market Companies Covered in this Report
- The Campbell's Company
- General Mills Inc.
- Kraft Heinz Company
- Nestle SA
- Unilever PLC
- B&G Foods, Inc.
- Conagra Brands Inc.
- Amy's Kitchen
- The Hain Celestial Group, Inc.
- Baxters Food Group Ltd.
- Blount Fine Foods
- Del Monte Foods Corporation Inc.
- Kettle & Fire Inc.
- Nissin Foods
- Uptons Naturals
- Ottogi Corporation
- Bes'Dam Soup
- Aylmer soups
- Mitchell's Soup Co.
- Evolution Fresh
Market Opportunities and Future Outlook
Chilled, frozen, and aseptic-enabled shelf-stable soups create whitespace for brands repositioning away from ultra-processed perceptions while maintaining convenience, particularly through clean-label formulations, sodium reduction, and single-serve formats. Capacity and process investments highlight where manufacturers are placing emphasis: in June 2026, The Campbell's Company completed an 88,000-square-foot expansion at its Maxton, North Carolina facility, adding aseptic filling lines and increasing soup and broth capacity by 20%. This supports more scalable production of premium and health-forward soups and broths while improving throughput and flexibility versus traditional lines.
Product innovation is also tilting toward higher-protein and diet-compatible propositions that support premium pricing and clearer functional messaging at shelf. In July 2026, The Campbell's Company launched a protein-focused soup lineup featuring 20 grams of protein per can, and collaborations such as a gluten-free chicken noodle soup with Banza chickpea pasta (June 2026) point to ways to extend core soup occasions into gluten-free and plant-forward household needs without abandoning familiar formats. Across North America, the tightening Canadian front-of-package labeling environment for high-sodium foods and the continued push toward claim-compliant reformulation reinforce opportunities for companies with formulation and sensory capabilities to deliver low-sodium taste parity and maintain front-of-pack messaging across US and Canadian SKU sets.
Recent Industry Developments in North America Soup Market
- June 2026: The Campbell's Company completed a manufacturing expansion at its Maxton, North Carolina facility to increase soup and broth production capacity. The added scale and upgraded processing capability support higher-throughput production for core soup and broth lines while improving operational flexibility for premium and health-positioned formats.
- August 2025: Campbell Soup Company partnered with Pabst Blue Ribbon to create two limited-edition soups infused with beer. The collaboration extends soup innovation into novelty and limited-time offerings, helping the brand generate attention and trial in a mature center-store category.
- June 2024: Campbell Soup Company completed its USD 2.7 billion acquisition of Sovos Brands, adding premium brands such as Rao's to its portfolio. The deal strengthened Campbells exposure to higher-margin, premium meal solutions and intensified competitive pressure on other incumbents to differentiate beyond value and traditional canned soup propositions.
North America Soup Market Report Scope and Research Methodology
Market Definition and Coverage
This market covers the value of soup sold and consumed across North America, counted across retail and foodservice, and across key formats like shelf-stable, chilled, frozen, and dry, using manufacturer and channel-level revenue where possible.
Scope exclusions: We exclude soup-adjacent meal kits and standalone sauces, and we do not treat broths and stocks sold as cooking ingredients as soup unless they are positioned and sold as soup on-pack and in the category listing.
Segments Covered in This Report
- By Product Type
- Dry Soup
- Shelf Stable Soup
- Chilled Soup
- Frozen Soup
- By Category
- Vegetarian Soup
- Non-Vegetarian Soup
- By Packaging Type
- Cans
- Pouches
- Cartons
- Others
- By Distribution Channel
- On-trade
- Off-trade
- Supermarkets/Hypermarkets
- Convenience/ Grocery Stores
- Online Retail Stores
- Other Distribution Channels
- By Geography
- United States
- Canada
- Mexico
- Rest of North America
Data Sources, Market Sizing, and Validation
Desk Research
Desk research was used to set up the size logic and keep assumptions grounded before we spoke to market participants. We referenced public data series and reference documents such as USDA food availability and price data, the US Census Bureau (including retail and services benchmarks where relevant), Statistics Canada for comparable food indicators, and trade statistics from USITC DataWeb and UN Comtrade to sense-check cross-border flows.
We also reviewed company annual reports and investor presentations, plus product and nutrition labeling guidance from FDA and Health Canada. For pricing behavior, we relied on reputable press coverage of packaged food promotions and price moves. For harder-to-pin items like private company scale, we used paid subscriptions focused on company financials and intelligence, news and financials, and shipment-level import-export records to validate directional shares. These examples are not exhaustive, and we reviewed many other public sources to collect, cross-check, and clarify the data.
Primary Interviews and Surveys
Primary work focused on interviews and structured surveys with soup manufacturers, ingredient and packaging participants, distributors, retail category managers, and foodservice operators across the United States, Canada, and Mexico. These discussions helped close gaps on channel mix, pricing changes, chilled versus shelf-stable demand shifts, and how innovation such as pouches and single-serve formats translates into revenue. Where responses differed, we rechecked the underlying assumptions with additional calls so the final model matched how the market is bought and sold.
Distribution of primary research fieldwork respondents
| Company type | Respondent position |
|---|---|
| Top tier: 36% | CXOs: 12% |
| Mid tier: 46% | Functional/Unit leaders: 39% |
| Smaller Players: 18% | Managers: 49% |
Market-Sizing & Forecasting
Sizing starts with a top-down build where packaged food consumption and retail sales signals are reconstructed into a soup demand pool for North America, then split by major formats and channels. After that, we corroborate totals with selective bottom-up checks, including sampling price points by format and pack size, applying observed promotion intensity, and rolling up a shortlist of supplier revenues where disclosures exist, then adjusting when the two views do not align.
Key model inputs include average selling price movement by format (cans versus pouches versus chilled), retail versus foodservice share shifts, private-label penetration, distribution expansion in online retail, and observed changes in serving size and sodium or clean-label positioning that can influence repeat purchases. For forecasting, we used scenario analysis supported by simple trend models, where drivers such as household time constraints, inflation-linked pricing, and new product launch cadence were discussed with primary respondents and converted into year-by-year assumptions. When bottom-up coverage was thin in smaller niches, we handled gaps through conservative proxying using comparable format pricing and channel mix, and then checked the outcomes against trade and company-level signals.
Data Validation & Update Cycle
Outputs are validated through multiple checks, including comparing implied per-capita consumption and price levels against independent food indicators, and reviewing whether channel splits look consistent versus retailer and foodservice signals. If a segment shows an unusual jump, we trace it back to the specific assumptions (price, mix, or volume) and review again before sign-off.
Reports are refreshed annually, and interim updates are made when there are material events such as major pricing resets, channel disruptions, or meaningful shifts in input costs. Before delivery, an analyst runs a fresh review so clients receive the latest updated view instead of an older model snapshot.
Mordor Intelligence's North America Soup Market Size Compared With Other Published Estimates
Published market sizes for North America soups can vary even when the title sounds identical, because each publisher uses its own product boundaries, channel treatment, and pricing logic. Differences also come from the starting year, currency conversion timing, and how much validation is done with manufacturers and retail or foodservice stakeholders.
Broths and stocks sold mainly as cooking bases sit outside Mordor Intelligence's scope in this report, which is one reason some published totals read higher even when growth rates look similar. Another common gap comes from how on-trade is counted, since some estimates lean heavily on retail scanner-style assumptions and then apply a broad uplift, instead of checking menu usage and operator purchasing patterns. We also see spreads when forecasts assume straight-line price increases, rather than linking pricing to promotion depth, pack size mix, and format shifts like chilled and pouches.
Benchmark comparison
| Source | Market Size | Gaps in Research Methodology |
|---|---|---|
| Mordor Intelligence | USD 6.96 B (2025) | |
| Industry Publisher A | USD 6.73 B (2025) | Uses a slightly different cut of channel and format weights, and the treatment of chilled and frozen often relies on limited validation outside mainstream retail. |
| Market Analytics Firm B | USD 6.11 B (2024) | Starts from an earlier base year and applies a lower growth path, which can understate recent pricing and mix changes across shelf-stable and newer packaging formats. |
The table shows that the spread is not only about math, it is mainly about what gets counted and how pricing and channels are translated into revenue. By tying the total back to clear inclusions, channel splits, and price and volume signals that can be rechecked year to year, the resulting size stays easier to reproduce and defend in planning discussions.
Key Questions Answered in the Report
What is the current value of the North America soup market?
The market is valued at USD 7.12 billion in 2026 and is forecast to reach USD 8.68 billion by 2031.
How fast is the North America soup market expected to grow?
It is projected to register a 4.04% CAGR during 2026-2031.
Which product type is growing fastest within soups?
Chilled soup leads with a 4.31% CAGR as consumers pay premiums for freshness cues.
Why are pouches gaining popularity over cans?
Pouches cut weight by 30-40%, heat in under 90 seconds, and support recyclability commitments, driving a 5.02% CAGR.
How are sodium regulations affecting soup reformulation?
FDA and Health Canada targets push brands to cut sodium to 480 mg and 420 mg per serving, spurring investment in yeast extracts and fermented ingredients.