Market Overview
| Study Period | 2021 - 2031 |
|---|---|
| Base Year For Estimation | 2025 |
| Forecast Data Period | 2026 - 2031 |
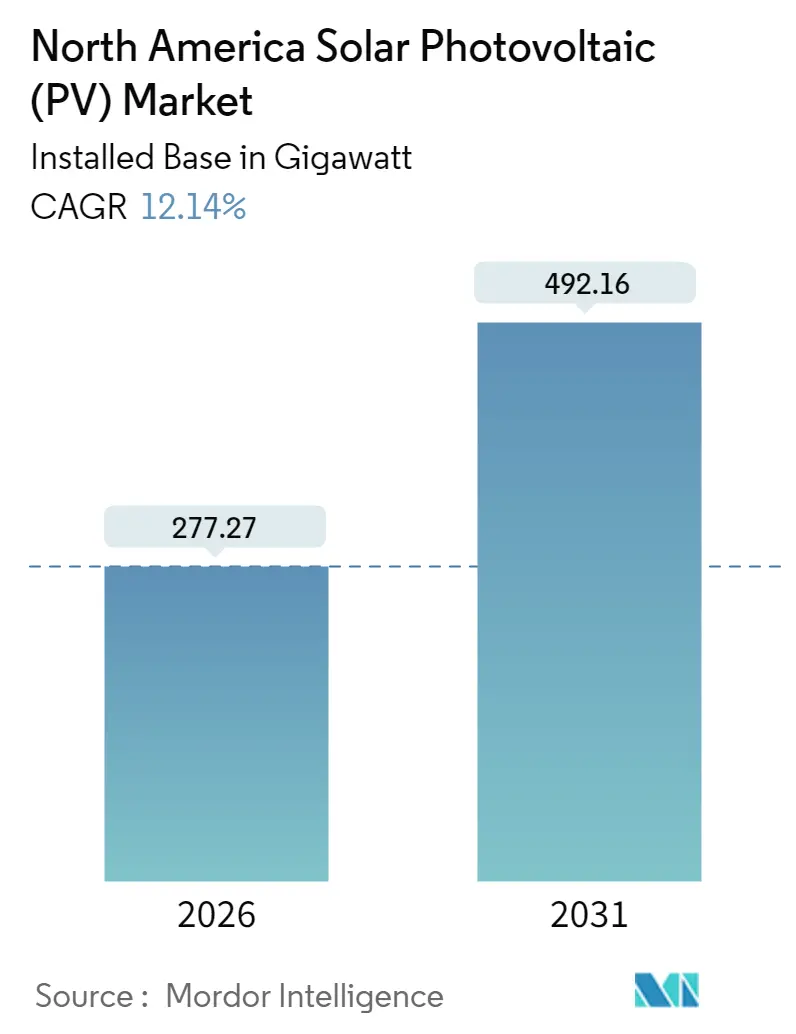
| Market Volume (2026) | 277.27 gigawatt |
| Market Volume (2031) | 492.16 gigawatt |
| Growth Rate (2026 - 2031) | 12.14% CAGR |
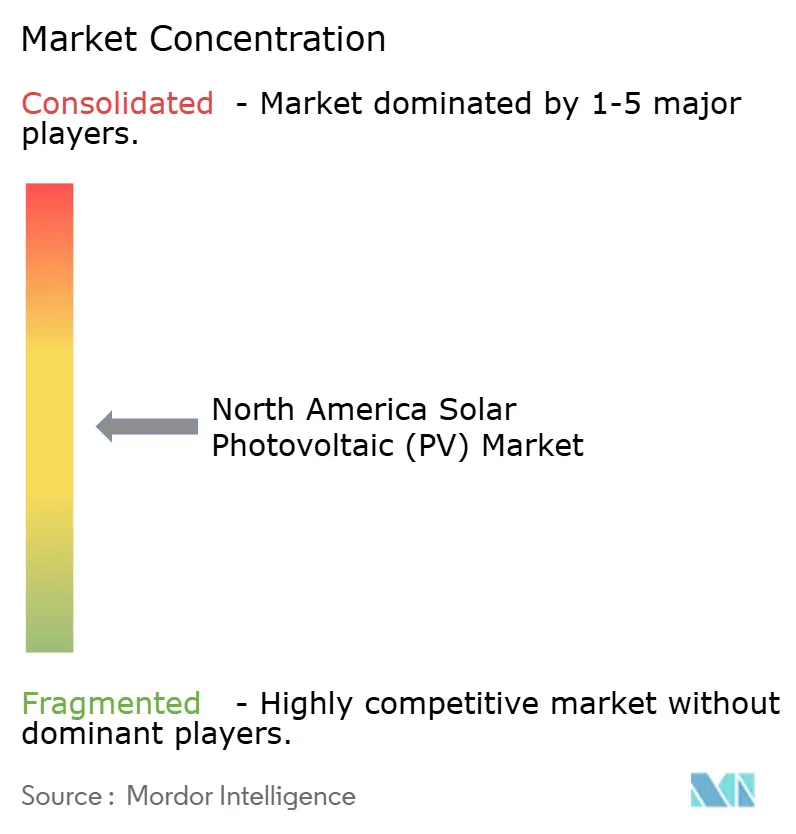
| Market Concentration | Medium |
Major Players *Disclaimer: Major Players sorted in no particular order Image © Mordor Intelligence. Reuse requires attribution under CC BY 4.0. | |
North America Solar Photovoltaic (PV) Market Analysis by Mordor Intelligence
The North America Solar Photovoltaic (PV) Market was valued at 247.25 gigawatt in 2025 and estimated to grow from 277.27 gigawatt in 2026 to reach 492.16 gigawatt by 2031, at a CAGR of 12.14% during the forecast period (2026-2031).
The trajectory reflects strong federal incentives, falling system costs, and aggressive corporate decarbonization targets. Utility-scale projects continue to dominate build-out volumes, yet residential and behind-the-meter installations are accelerating as interconnection delays push developers toward faster-to-market options. Vertically integrated manufacturers are scaling domestic capacity to capture Investment Tax Credit (ITC) bonus points tied to U.S. content requirements, while grid-forming inverters and co-located storage are enhancing the operational value of new assets. Near-shoring manufacturing in Mexico, coupled with provincial incentives in Canada, is broadening geographic participation even as the United States retains the lion’s share of deployments.
Key Report Takeaways
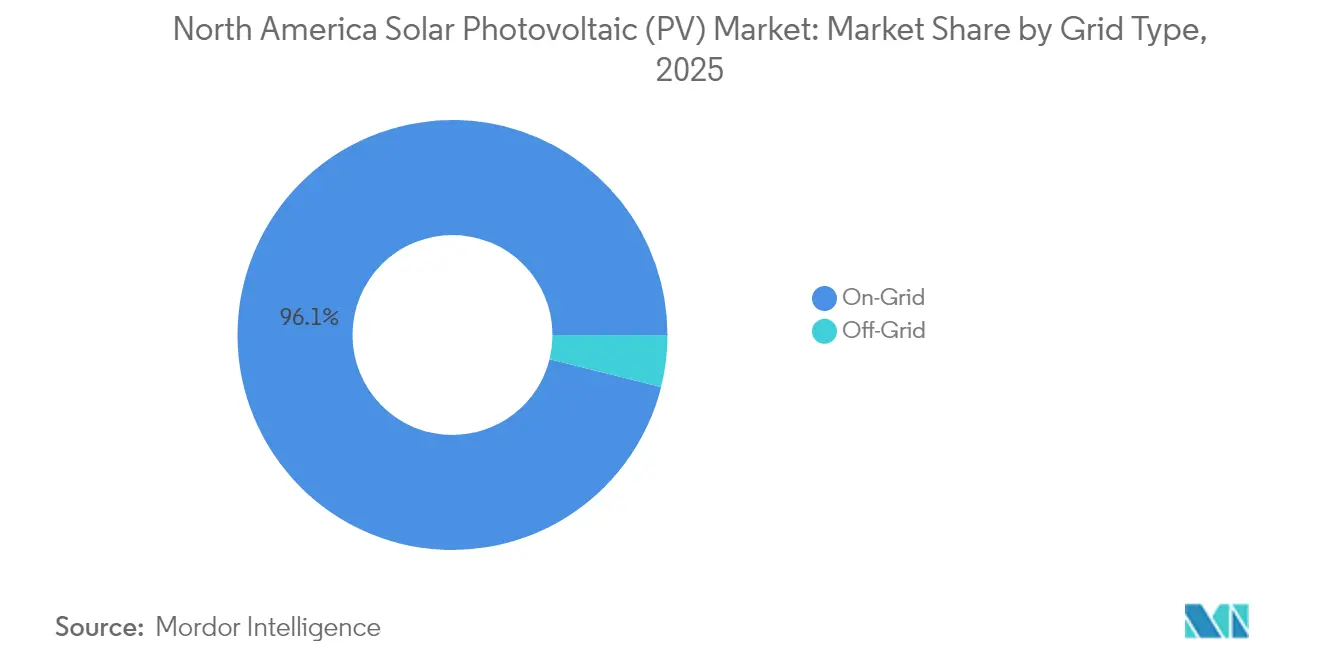
- By grid type, on-grid installations held 96.12% of the North America solar photovoltaic market share in 2025, while off-grid systems are advancing at a 21.30% CAGR through 2031 as remote mines, farms, and telecom sites install hybrid solar-plus-storage systems.
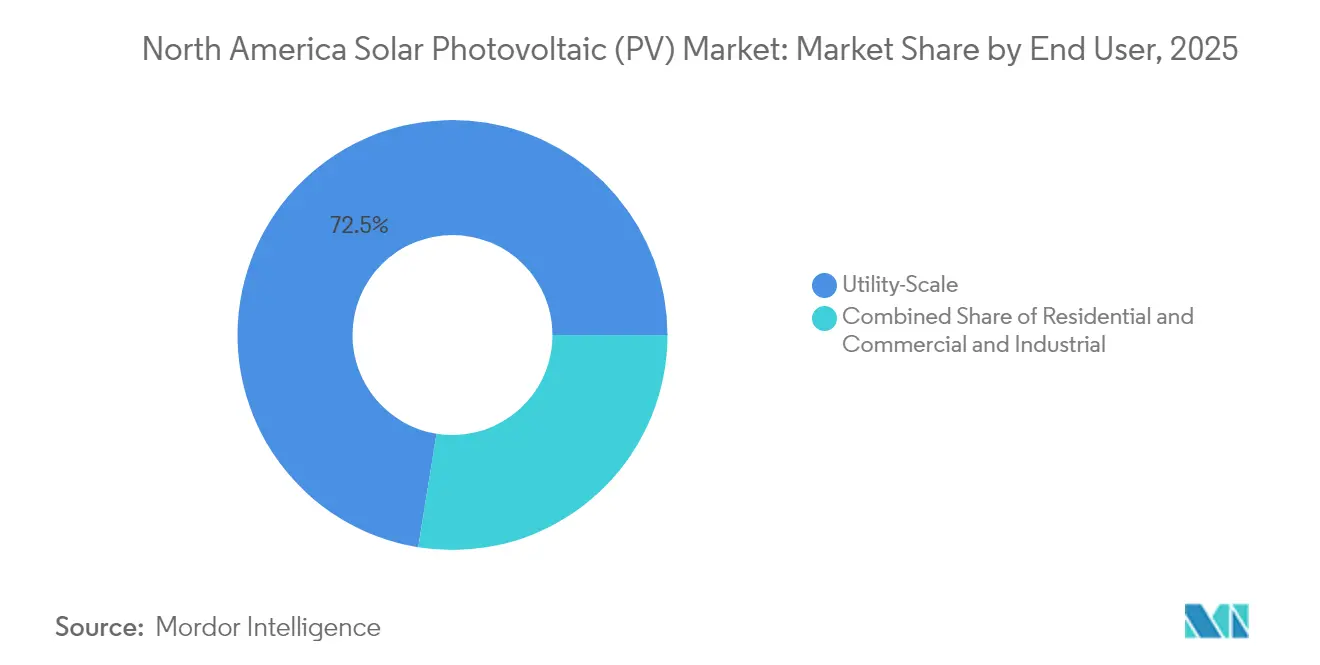
- By end user, utility-scale assets led with 72.45% revenue share in 2025; the residential segment is forecast to expand at a 19.15% CAGR between 2026 and 2031.
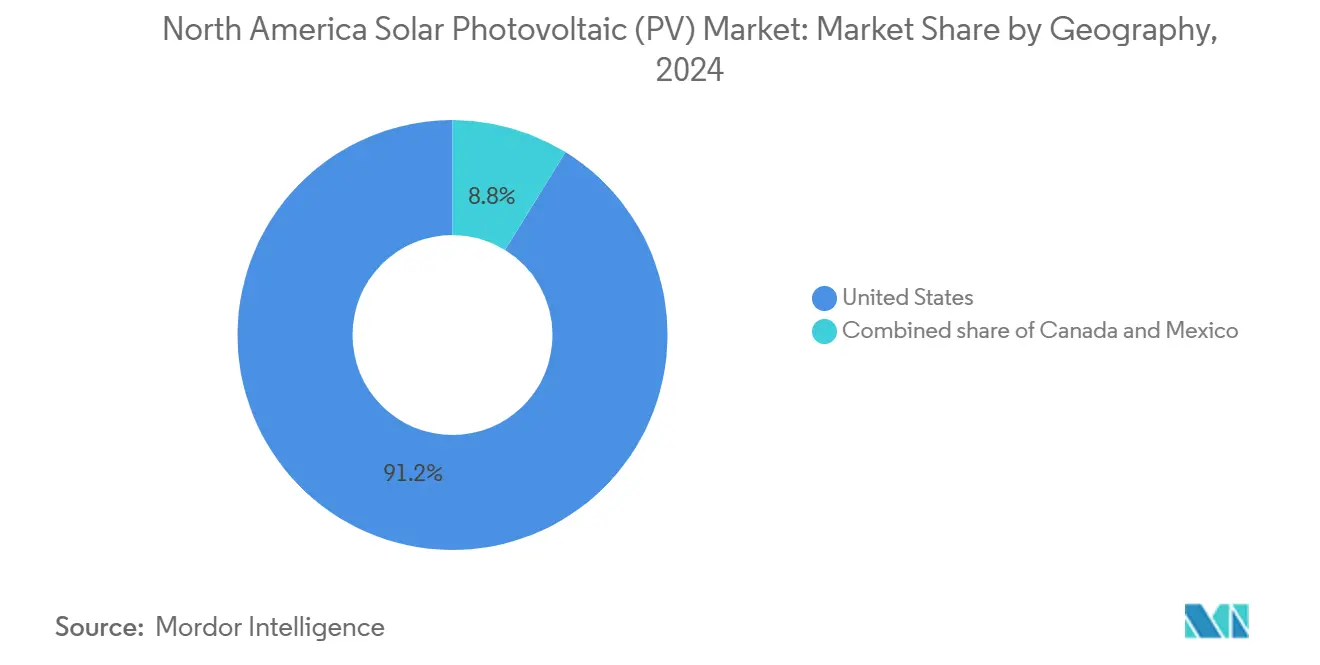
- In 2025, the United States dominates the regional landscape, holding a commanding 90.65% share of capacity. Meanwhile, Mexico is making waves as the fastest-growing region, boasting an impressive 14.08% CAGR.
Note: Market size and forecast figures in this report are generated using Mordor Intelligence’s proprietary estimation framework, updated with the latest available data and insights as of January 2026.
North America Solar Photovoltaic (PV) Market Trends and Insights
Drivers Impact Analysis
| Driver | (~) % Impact on CAGR Forecast | Geographic Relevance | Impact Timeline |
|---|---|---|---|
| IRA investment & extended ITC incentives | 3.5% | United States (primary), spillover to Canada via cross-border supply chains | Long term (≥ 4 years) |
| Declining LCOE for utility-scale solar | 2.8% | United States (Texas, California, Florida), Mexico (Sonora, Chihuahua) | Medium term (2-4 years) |
| Corporate PPA & net-zero commitments | 1.9% | United States (tech hubs: California, Texas, Virginia), Canada (Alberta, Ontario) | Medium term (2-4 years) |
| Grid-forming inverter adoption | 1.2% | United States (California, Texas, Hawaii), early pilots in Ontario | Short term (≤ 2 years) |
| Residential VPP aggregation momentum | 1.4% | United States (California, Texas, Arizona, Vermont), limited Canada adoption | Short term (≤ 2 years) |
| Domestic polysilicon & module build-out | 1.6% | United States (Ohio, Alabama, Georgia, Louisiana, Indiana) | Medium term (2-4 years) |
| Source: Mordor Intelligence | |||
Inflation Reduction Act Investment and Extended ITC Incentives
The 30% base ITC, extended through 2032, underpins project economics across the North America solar photovoltaic market. Developers may stack an additional 10 percentage points for domestic-content compliance and another 10 points for siting in former fossil-fuel communities, lifting the effective credit to 50% for qualifying projects. More than USD 50 billion in new U.S. manufacturing announcements since 2022 reflect this design, including a USD 1.45 billion Department of Energy loan commitment that will lift Qcells’ Georgia complex to 8.4 GW of fully integrated capacity.[1]Qcells, “DOE Loan Commitment Announcement,” qcells.com The domestic-content bonus requires 100% U.S.-sourced steel and at least 55% domestic product cost, prompting backward integration into polysilicon and wafer production. Low-income community adders are steering distributed generation toward historically underserved census tracts, supporting equitable adoption and broadening the residential addressable market.
Declining Levelized Cost of Energy for Utility-Scale Solar
Utility-scale solar’s unsubsidized levelized cost fell to USD 46 per MWh for 2024-vintage projects, and the ITC reduces that to USD 31 per MWh, under-pricing new gas combined-cycle capacity by roughly 20%. Module efficiencies above 24% for TOPCon and heterojunction designs, combined with single-axis trackers on 85% of new builds, are raising net capacity factors and lowering balance-of-system costs. Bifacial modules now represent more than 60% of U.S. procurement and add 5%-10% energy gain in high-albedo sites.[2]National Renewable Energy Laboratory, “Bifacial Module Field Performance,” nrel.gov Capital costs averaged USD 1.43 per WAC-watt in 2024, allowing developers in Texas and the Southwest to sign sub-USD 30 per MWh power-purchase agreements that displace coal retirements and defer gas peaker construction.
Corporate PPA and Net-Zero Commitments
North American corporations contracted over 15 GW of renewable PPAs in 2024, with solar accounting for nearly 60% of the volume. Microsoft’s 12 GW, 8-year supply deal with Qcells marked a shift from project-level PPAs to upstream module procurement that locks in price and domestic-content compliance years before commissioning. Data-center and manufacturing buyers are pairing solar contracts with co-located storage to meet hourly load obligations, typically at a 10%-15% premium to solar-only deals. The Renewable Energy Buyers Alliance reports that three-quarters of Fortune 500 companies with net-zero goals now require time-matched clean-energy procurement, lifting demand for 24/7 carbon-free certificates.
Grid-Forming Inverter Adoption
Grid-forming inverters that synthesize voltage and frequency autonomously are moving from pilot projects to market standards as solar penetration surpasses 30% of load in California, Texas, and Hawaii. FERC Order 2023 mandates that new interconnection requests demonstrate grid-forming capability or equivalent system-strength contribution, accelerating IEEE 2800 adoption. California ISO’s 2024 queue lists more than 40 GW of solar-plus-storage projects equipped with grid-forming controls, a configuration that can shorten interconnection timelines by 12-18 months by reducing transmission-upgrade needs. At the residential scale, Enphase’s IQ9 microinverter series embeds grid-forming functionality, enabling rooftop systems to supply voltage support during disturbance events.
Restraints Impact Analysis
| Restraint | (~) % Impact on CAGR Forecast | Geographic Relevance | Impact Timeline |
|---|---|---|---|
| Interconnection & transmission bottlenecks | -2.1% | United States (MISO, PJM, SPP, ERCOT), Canada (Alberta, Ontario) | Long term (≥ 4 years) |
| Rising interest-rate driven financing costs | -1.8% | United States (all regions), Canada (Ontario, Quebec), Mexico (limited impact due to local financing) | Medium term (2-4 years) |
| U.S. trade-law actions & WRO disruptions | -1.3% | United States (import-dependent developers), spillover to Canada via shared supply chains | Short term (≤ 2 years) |
| Land-use & biodiversity siting opposition | -0.9% | United States (Ohio, Virginia, New York, Midwest agricultural states) | Medium term (2-4 years) |
| Source: Mordor Intelligence | |||
Interconnection and Transmission Bottlenecks
The regional interconnection queue topped 2,600 GW in 2024, with solar accounting for 1,086 GW, yet historically, only 15%-20% of queued capacity reaches operation.[3]Lawrence Berkeley National Laboratory, “Queued Up: Interconnection Trends 2025,” lbl.gov The median queue time stretched to 5 years, up from 2 years in 2015. Cluster studies mandated by FERC Order 2023 are designed to streamline reviews, but implementation lags have left developers carrying high-deposit exposures while waiting for study outcomes. In the Midwest and Mid-Atlantic, network-upgrade costs exceed USD 100 per kW, eroding project margins and steering sponsors toward distribution-level or off-grid solutions that bypass bulk-system constraints. Only 12% of U.S. transmission added since 2010 was built proactively ahead of generation, creating a structural bottleneck that defers 20-30 GW of otherwise viable capacity each year.
Rising Interest-Rate Driven Financing Costs
The weighted-average cost of capital for utility-scale solar rose from 4.2% in 2021 to 7.1% in 2024, lowering unlevered internal rates of return by 150-200 basis points. Tax-equity yields climbed to 8%-9%, trimming the net present value of monetizable credits. Merchant-exposed projects in ERCOT face wider basis risk, complicating revenue certainty and prompting lenders to demand additional reserves. Construction-to-permanent debt structures are giving way to bridge loans that add 50-75 basis points in cost, a burden most acute for mid-scale assets below 100 MWAC. Financing pressures are encouraging sponsors to renegotiate PPA strike prices and to bundle storage capacity that qualifies for the standalone ITC introduced in 2024, partially offsetting rate-driven headwinds.
Segment Analysis
By Grid Type: Off-Grid Surges Amid Queue Congestion
Off-grid systems posted the fastest growth, expanding at a 21.30% CAGR through 2031 as mines, farms, and telecom operators adopt hybrid solar-plus-storage designs to avoid interconnection delays. The North America solar photovoltaic market size for off-grid assets is projected to grow from a modest base to 30.52 GW by 2031, while on-grid installations maintain numerical dominance. Remote mining operations in Nevada, Arizona, and northern Canada are pairing 5-20 MW solar arrays with diesel gensets, cutting fuel consumption 40%-60% and trimming payback periods to 4-6 years. Agricultural producers in California’s Central Valley and Texas’s High Plains deployed more than 1,200 solar-powered irrigation systems in 2024, limiting peak-period demand charges that often top USD 20 per kW.
Momentum is reinforced by federal and provincial grant programs that subsidize up to 50% of capital costs for rural renewable installations. Telecommunications carriers, facing stricter uptime requirements, are fitting cell towers in hurricane-prone regions with 10-50 kW solar-storage kits, reducing diesel refueling trips during grid outages. As lithium-iron-phosphate battery prices dipped below USD 150 per kWh in 2024, microgrid controllers matured, enabling autonomous load balancing that keeps total system costs competitive with grid-extension alternatives. Although on-grid projects retain 96.12% of 2025 installed capacity, the off-grid cohort supplies higher margins and shorter development cycles, a combination that is drawing specialized financiers and EPC firms into the niche.
Note: Segment shares of all individual segments available upon report purchase
Get Detailed Market Forecasts at the Most Granular Levels
Download PDF
By End User: Residential VPPs Outpace Utility Scale
Utility-scale projects captured 72.45% of 2025 deployments, supported by multi-hundred-megawatt plants in Texas, California, and Florida that exploit scale efficiencies and investment-grade PPAs. Even so, the residential sector is set to grow at a 19.15% CAGR through 2031, propelled by virtual power plant (VPP) aggregation, third-party ownership models, and state-level solar mandates. California’s building code, which requires rooftop solar on new homes, adds roughly 80,000 installations annually, while New York’s NY-Sun incentives stimulate sustained demand. Residential aggregations already enroll 2.5 GW of storage-backed capacity, and Federal Energy Regulatory Commission Order 2222 clears a path for distributed assets to bid into wholesale markets.
Commercial and industrial buyers are also accelerating adoption in high-cost states where tariffs exceed USD 0.15 per kWh. Warehouse operators electrifying vehicle fleets are installing rooftop solar to hedge energy costs and secure renewable credits that underpin sustainability commitments. Despite the residential sector’s rapid rise, utility-scale plants will still deliver the bulk of absolute capacity additions, but interconnection bottlenecks and land-use pushback create openings for behind-the-meter assets that can be built in 12 months rather than 5 years. Property-assessed clean-energy financing and loan-transfer rules lower credit-score barriers, broadening the eligible customer pool and tilting the adoption curve upward.
Note: Segment shares of all individual segments available upon report purchase
Get Detailed Market Forecasts at the Most Granular Levels
Download PDF
Geography Analysis
The United States accounted for 90.65% of installed capacity in 2025, anchored by the Inflation Reduction Act’s extended ITC, state renewable standards, and coal retirements that free transmission headroom. Texas led additions with 8.5 GW in 2024 owing to ERCOT’s streamlined interconnection and plentiful land in West Texas and the Panhandle. California commissioned 6.2 GW, supported by its 60% renewable mandate by 2030 and robust corporate PPA demand centered in technology hubs. Florida’s regulated utilities advanced a 12 GW utility-scale pipeline under integrated resource plans that favor solar to hedge fuel volatility. While federal tax-equity structures give the United States a funding advantage, transmission congestion in MISO, PJM, and SPP is deferring 20-30 GW of projects annually, prompting developers to emphasize distribution-level interconnections and modular microgrid solutions.
Mexico is the fastest-growing geography at a 14.08% CAGR to 2031, driven by near-shored manufacturing that demands competitively priced renewable power. Automotive and electronics firms locating in Nuevo León, Coahuila, and Chihuahua are adopting on-site solar to offset industrial tariffs above USD 0.12 per kWh. A 2024 energy reform reopened private investment in sub-500 kW distributed generation, allowing commercial customers to bypass the federal utility’s monopoly and realize 20%-30% energy savings. High-irradiance states such as Sonora and Chihuahua attract utility-scale sponsors seeking cross-border export potential into Arizona and California load pockets. Although access to U.S.-style tax equity remains limited, a captive industrial customer base and clear sustainability mandates underpin bankable revenue streams even at a higher cost of capital.
Canada adds steady volume under provincial renewables targets and a 2024 federal ITC that mirrors the U.S. structure. Alberta installed 1.2 GW in 2024 through competitive procurement aligned with coal plant retirements. Ontario’s distributed-generation market brought online 300 MW of rooftop and small ground-mount projects under an adjusted Feed-in Tariff structure. Lower retail tariffs of USD 0.08-0.10 per kWh lengthen payback periods, yet provincial carbon-price regimes and corporate renewable-certificate demand sustain project flow. Quebec and British Columbia’s hydro-heavy grids exhibit cautious solar uptake, though mining and pulp-and-paper operators pilot solar-storage hybrids to meet rising internal carbon valuations. Federal and provincial collaboration on tax credits and accelerated depreciation is expected to narrow cost differentials with the United States and support continuous growth beyond 2025.
Note: Segment shares of all individual segments available upon report purchase
Competitive Landscape
The North America solar photovoltaic market is moderately concentrated. The top 10 suppliers captured an estimated 55%-60% of 2024 shipments, yet competitive intensity is rising as domestic-content rules reward vertically integrated players. First Solar commands over 20% of U.S. utility-scale module deliveries with its thin-film cadmium-telluride modules that qualify for domestic bonuses without imported polysilicon. Its new Alabama plant lifts U.S. capacity to 10.5 GW and employs Series 7 modules with 19.4% efficiency. Qcells’ 12 GW, eight-year module commitment to Microsoft showcases multi-year supply contracts that de-risk both pricing and compliance for hyperscale buyers. Canadian Solar’s 5 GW TOPCon cell factory in Indiana, online in 2025, supports domestic wafer-to-module demand and diversifies away from Southeast Asian imports.
Tracker suppliers represent another layer of differentiation. Nextracker held 35%-40% of U.S. tracker installations in 2024 and increasingly bundles software-based yield optimization to secure premium pricing. Inverters are evolving into grid-forming, software-rich platforms; Enphase introduced the IQ9 microinverter series to provide distribution-level voltage support, aligning rooftop systems with evolving interconnection standards. Residential aggregators such as Tesla, Sunrun, and Sunnova monetize distributed storage through VPP participation in wholesale markets, yet compensation frameworks vary across states, adding regulatory risk that smaller entrants may struggle to absorb.
Land-use opposition is prompting developers to explore agrivoltaic solutions that integrate grazing or pollinator habitat under arrays. Silicon Ranch exemplifies this trend by combining pasture management with solar production, winning local support, and unlocking dual revenue streams. Software-driven operations-and-maintenance platforms use artificial intelligence to anticipate failures and cut truck rolls, lowering lifecycle costs and supporting performance guarantees that smaller EPCs cannot match. As domestic manufacturing ramps up, module lead times for projects that meet domestic-content thresholds are falling from nine months to four, providing a speed advantage that import-dependent developers cannot replicate.
North America Solar Photovoltaic (PV) Industry Leaders
First Solar, Inc.
Canadian Solar Inc.
Hanwha Q Cells Co.,
Jinko Solar Holding Co., Ltd
SunPower Corporation (Maxeon modules)
- *Disclaimer: Major Players sorted in no particular order
Need More Details on Market Players and Competitors?
Download PDF
Recent Industry Developments
- February 2025: In a significant move, DP Energy has sold the 325 MW Saamis Solar Park to Medicine Hat, a city in Alberta. Spanning approximately 1,600 acres, the site was once an industrial brownfield, specifically a phosphogypsum stack. It is now set to be transformed into a utility-scale solar installation.
- February 2025: Enel North America has launched a 202 MW solar PV facility, integrated with a 125 MW battery storage system. This combined setup is projected to produce approximately 499 GWh annually, sufficient to power about 46,000 U.S. homes.
- December 2024: Qcells secured a USD 1.45 billion Department of Energy loan to expand its Cartersville, Georgia, complex to 8.4 GW of fully integrated capacity, servicing Microsoft’s 12 GW supply contract.
- September 2024: National Grid Renewables completed the 270 MWAC Blevins Solar project in Texas, paired with 180 MW of storage under a long-term PPA with an investment-grade buyer.
North America Solar Photovoltaic (PV) Market Report Scope
Solar photovoltaic energy or PV solar energy directly converts sunlight into electricity, using a technology based on the photovoltaic effect. When radiation from the sun hits one of the faces of a photoelectric cell (many of which make up a solar panel), it produces an electric voltage differential between both faces that makes the electrons flow from one to the other, generating an electric current.
The North America solar photovoltaic (PV) market is segmented by grid type, end-user, and geography. By grid Type, the market is segmented into on-grid and off-grid systems. By end-user, the market is segmented into utility-scale, commercial & industrial (C&I), and residential. The report also includes market sizes and forecasts for the North America solar photovoltaic (PV) market across major countries in the region. For each segment, market sizing and forecasts have been done on the basis of installed capacity (GW).
By Grid Type
| On-Grid |
| Off-Grid |
By End-User
| Utility-Scale |
| Commercial and Industrial (C&I) |
| Residential |
By Geography
| United States |
| Canada |
| Mexico |
By Component (Qualitative Analysis)
| Solar Modules/Panels |
| Inverters (String, Central, Micro) |
| Mounting and Tracking Systems |
| Balance-of-System and Electricals |
| Energy Storage and Hybrid Integration |
| By Grid Type | On-Grid |
| Off-Grid | |
| By End-User | Utility-Scale |
| Commercial and Industrial (C&I) | |
| Residential | |
| By Geography | United States |
| Canada | |
| Mexico | |
| By Component (Qualitative Analysis) | Solar Modules/Panels |
| Inverters (String, Central, Micro) | |
| Mounting and Tracking Systems | |
| Balance-of-System and Electricals | |
| Energy Storage and Hybrid Integration |
Need A Different Region or Segment?
Customize Now
Key Questions Answered in the Report
How large is the North America solar photovoltaic market in 2026?
Installed capacity totals 277.27 GW in 2026, with a forecast of 492.16 GW by 2031.
Which segment is growing fastest through 2031?
Off-grid systems lead growth, expanding at a 21.30% CAGR due to hybrid solar-storage adoption at remote sites.
Why are residential installations accelerating despite utility-scale dominance?
Virtual power-plant aggregation, state mandates, and flexible financing shorten development cycles and improve economics for homeowners.
How does the Inflation Reduction Act influence domestic manufacturing?
The extended 30% ITC plus a 10-point domestic-content bonus has triggered over USD 50 billion in U.S. solar manufacturing commitments.
What is the main bottleneck for new grid-connected projects?
Interconnection and transmission backlogs extend median queue times to 5 years, deferring 20-30 GW of potential capacity each year.
Which geography outside the United States is expanding most rapidly?
Mexico is growing at a 14.08% CAGR through 2031, propelled by near-shored manufacturing demand and private distributed-generation reforms.


