
Market Overview
| Study Period | 2020 - 2031 |
|---|---|
| Forecast Data Period | 2026 - 2031 |
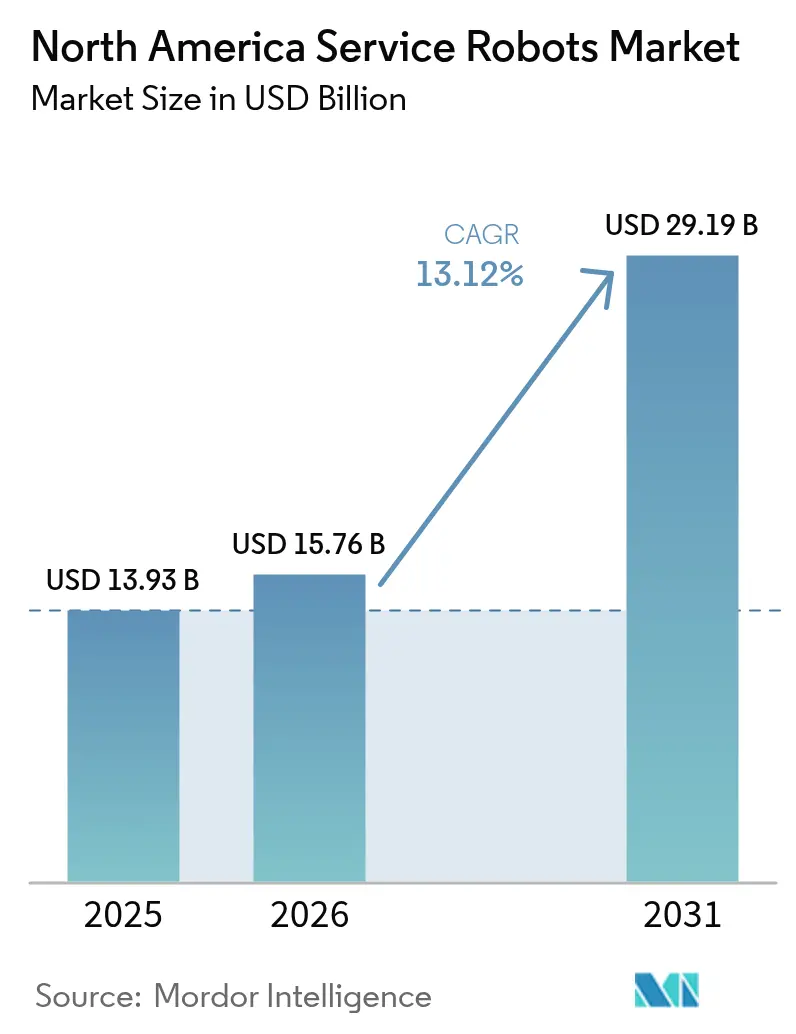
| Base Year Market Size (2025) | USD 13.93 Billion |
| Market Size (2026) | USD 15.76 Billion |
| Market Size (2031) | USD 29.19 Billion |
| Growth Rate (2026 - 2031) | 13.12% CAGR |
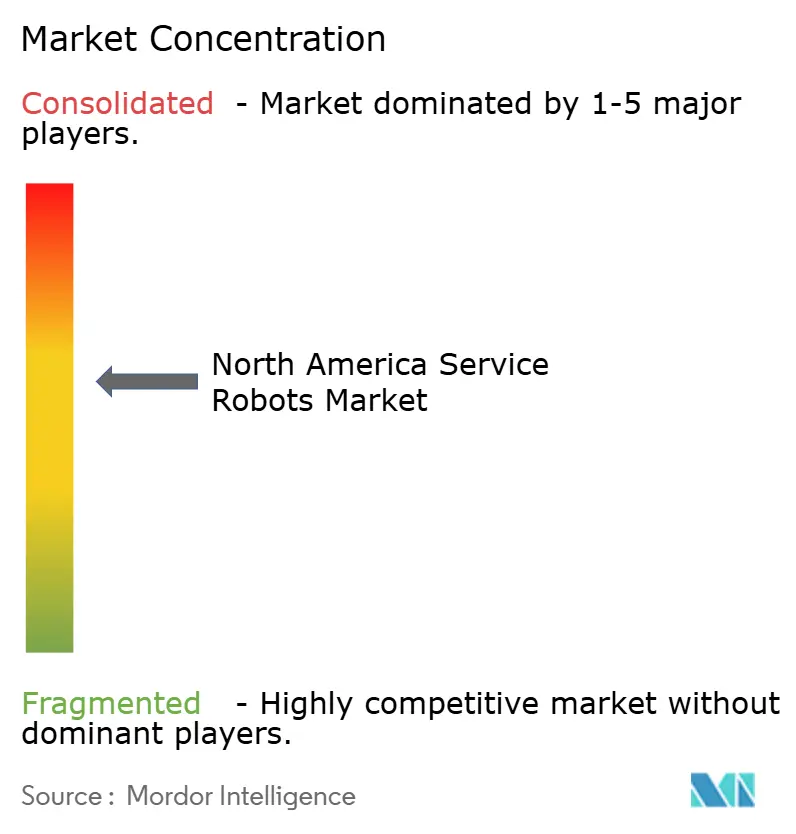
| Market Concentration | Medium |
Major Players *Disclaimer: Major Players sorted in no particular order Image © Mordor Intelligence. Reuse requires attribution under CC BY 4.0. | |
North America Service Robots Market Analysis by Mordor Intelligence
The North America service robots market size was valued at USD 13.93 billion in 2025 and estimated to grow from USD 15.76 billion in 2026 to reach USD 29.19 billion by 2031, at a CAGR of 13.12% during the forecast period (2026-2031). Surging labor shortages, especially in logistics and healthcare, are compressing margins and accelerating the shift from manual to robotic workflows, turning autonomous fleets from pilot projects into mainstream capital equipment. Rapid declines in solid-state LiDAR and edge-AI chip prices are making high-performance sensing affordable for mid-market users. At the same time, subscription-based fleet software is opening recurring revenue streams for vendors while lowering up-front costs for buyers. Finally, favorable municipal and aviation regulations are unlocking sidewalk, aerial, and campus delivery uses faster than expected.
Key Report Takeaways
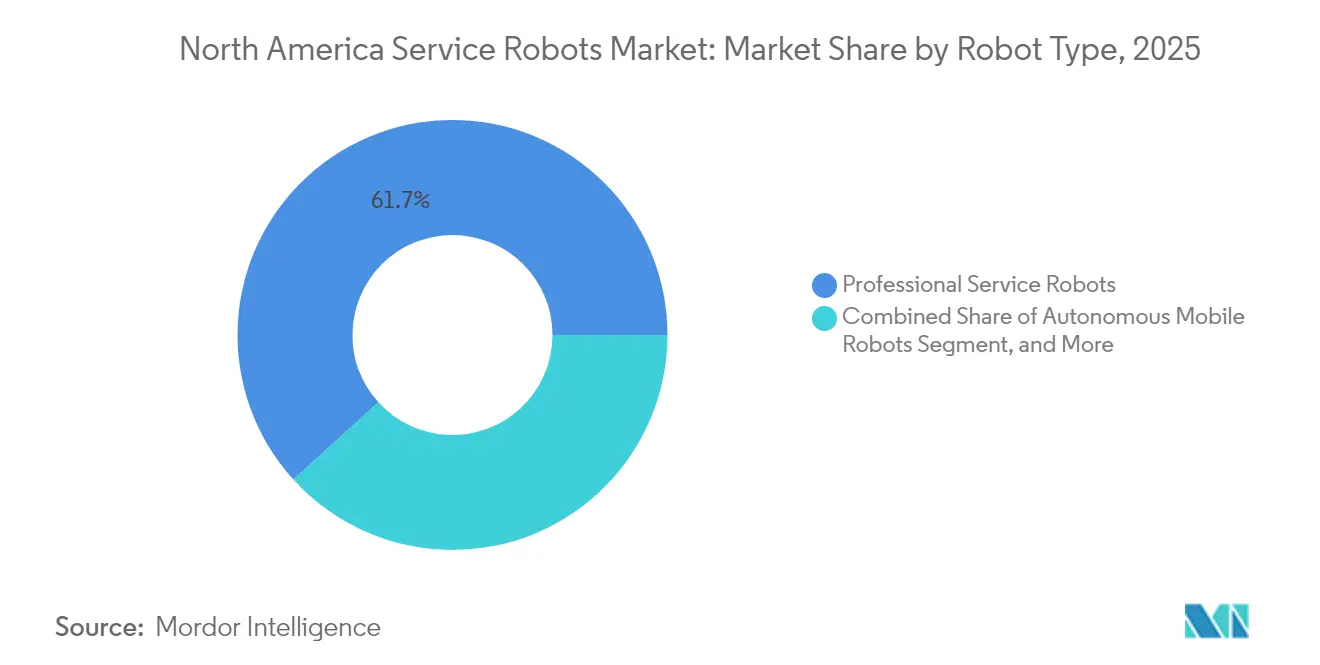
- By robot type, professional service robots led with a 61.74% of the North America service robots market size in 2025, while autonomous mobile robots are poised for a 13.95% CAGR through 2031.
- By application, logistics and warehouse automation held a 29.21% of the North America service robots market size in 2025; delivery and last-mile services are projected to post the fastest 14.12% CAGR from 2026 to 2031.
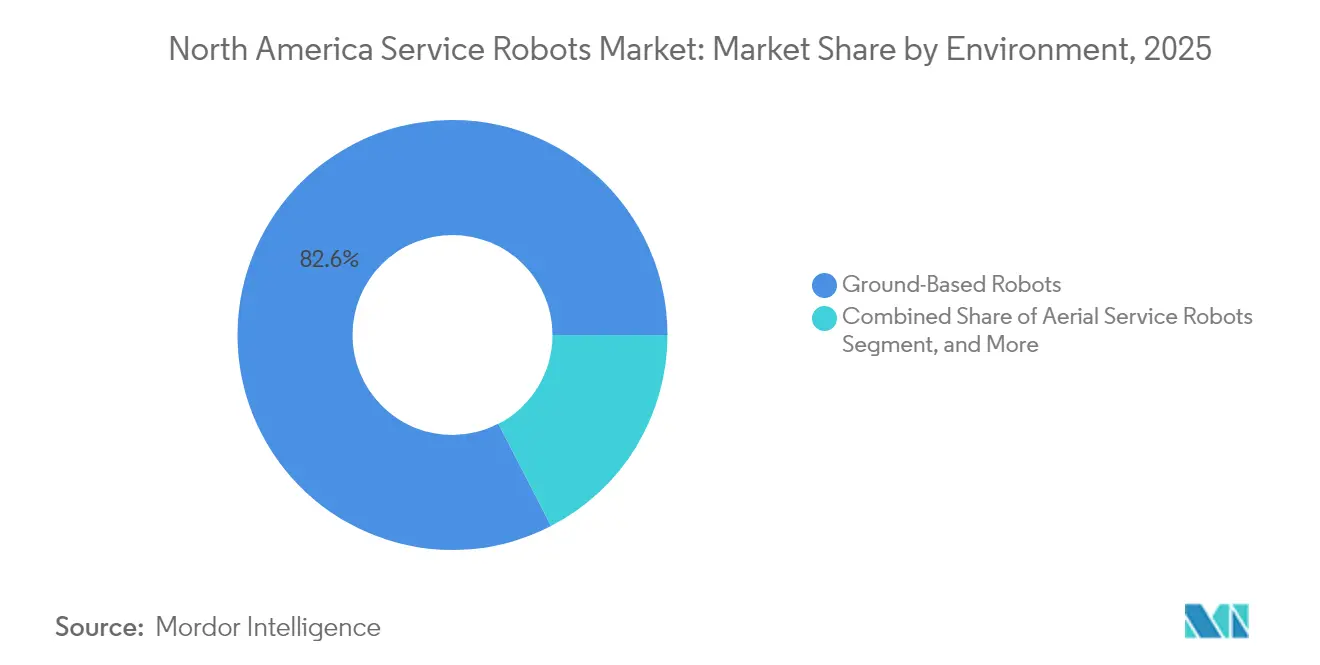
- By environment, ground-based robots commanded 82.58% of the North America service robots market size in 2025, whereas aerial platforms are expected to grow at a 13.65% CAGR.
- By component, hardware generated 68.05% of the North America service robots market size in 2025; however, software is expected to expand at a 13.6% CAGR through 2031.
- By geography, the United States captured a 75.83% of the North America service robots market size in 2025, while Mexico is projected to have the fastest 13.75% CAGR, driven by nearshoring investments.
Note: Market size and forecast figures in this report are generated using Mordor Intelligence’s proprietary estimation framework, updated with the latest available data and insights as of 2026.
North America Service Robots Market Trends and Insights
Drivers Impact Analysis*
| Driver | (~) % Impact on CAGR Forecast | Geographic Relevance | Impact Timeline |
|---|---|---|---|
| Rising Labor Costs Accelerating Automation Adoption | +3.2% | United States, Canada (acute in logistics hubs: Ontario, Texas, California) | Short term (≤ 2 years) |
| Advances in Artificial Intelligence and Machine Vision | +2.8% | Global, with early adoption in United States tech corridors and Canadian research clusters | Medium term (2-4 years) |
| Growing Demand for Contactless Services Post-Pandemic | +1.9% | United States hospitality and retail sectors, urban Canada | Short term (≤ 2 years) |
| Aging Population Driving Healthcare Service Robots | +2.4% | United States, Canada (concentrated in Northeast, Midwest eldercare facilities) | Long term (≥ 4 years) |
| State-Level Incentive Programs for Agricultural Robotics in the United States | +1.1% | United States (14 states with active programs: Iowa, Nebraska, California, Wisconsin) | Medium term (2-4 years) |
| Warehouse Safety Regulations Favoring Human-Robot Collaboration | +1.6% | United States, Canada (OSHA and provincial labor ministries driving compliance) | Short term (≤ 2 years) |
| Source: Mordor Intelligence | |||
Rising Labor Costs Accelerating Automation Adoption
Warehouse and hospital wages climbed 6.8% year over year by late 2024, shrinking margins for logistics operators and healthcare providers.[1]Job Openings and Labor Turnover Survey, U.S. Bureau of Labor Statistics, bls.gov Autonomous mobile platforms now pay back in 18 months, half the 2022 period, prompting widespread fleet roll-outs in facilities of every size. Amazon’s Proteus robots eliminated 40% of manual pallet moves across 350 U.S. fulfillment centers, validating the economics for mid-market adopters. Locus Robotics reported that 68% of its 2024 wins were firms with fewer than 500 employees, confirming penetration into small enterprises. Similar wage spikes in Ontario warehouses raised hourly forklift pay 22%, tipping return-on-investment math toward autonomous guided vehicles.
Advances in Artificial Intelligence and Machine Vision
Transformer-based vision models are reducing navigation error rates below 0.5%, allowing safe travel in crowded corridors. Google DeepMind’s RT-2 architecture demonstrated zero-shot manipulation of 6,000 objects, slashing task-specific training time.[2]“RT-2 Vision-Language-Action Model,” Google DeepMind, deepmind.google Diligent Robotics’ Moxi leveraged these gains to serve 140 U.S. hospitals in 2024 without line-of-code reprogramming. John Deere’s Blue River See and Spray reduced herbicide use by 77% across 8,000 tractors, demonstrating the utility of AI outdoors. Competitive advantage is shifting from mechanical tolerances to data pipelines that provide continuous model updates.
Growing Demand for Contactless Services Post-Pandemic
Sixty-one percent of U.S. consumers preferred self-service options in 2024, a preference that has persisted even after health mandates were lifted.[3]“Consumer Preferences for Contactless Service,” National Restaurant Association, restaurant.org Starship Technologies completed six million autonomous deliveries with a 98.7% on-time record, reinforcing consumer trust in unattended hand-offs. Bear Robotics’ 10,000 Servi units trimmed front-of-house labor by 23% and boosted table turnover by 15% in casual dining. In healthcare, Savioke’s Relay delivered 12 million items with minimal human contact, reducing infection vectors. City ordinances in 38 jurisdictions now permit sidewalk robots, supplying the regulatory certainty firms need for fleet scaling.
Aging Population Driving Healthcare Service Robots
Adults aged 65 and above will comprise 21.6% of the U.S. population by 2030, straining clinical capacity. Intuitive Surgical’s da Vinci platform performed 2.3 million procedures globally in 2024, with 68% of these procedures in the United States, driven by Medicare reimbursement parity for robotic surgery. Skilled-nursing facilities with 12% aide vacancies adopted rehabilitation and telepresence robots to fill care gaps. Blue Ocean Robotics’ GoBe telepresence units cut emergency transfers by 18% in 450 elder-care sites. Ontario funded CAD 45 million (USD 33 million) for rehabilitation robotics in 80 homes, signaling a provincial commitment.
Restraints Impact Analysis*
| Restraint | (~) % Impact on CAGR Forecast | Geographic Relevance | Impact Timeline |
|---|---|---|---|
| High Initial Capital Investment Requirements | -2.1% | United States and Canada SMEs, rural healthcare facilities | Short term (≤ 2 years) |
| Safety and Liability Concerns in Human-Robot Interaction | -1.7% | United States (manufacturing, logistics, public spaces with pedestrian traffic) | Medium term (2-4 years) |
| Limited Insurance Underwriting Framework for Service Robot Deployment | -0.9% | United States, Canada (gaps in commercial liability policies) | Medium term (2-4 years) |
| Skilled Robot Maintenance Technician Shortage in Rural Areas | -1.2% | Rural United States, Northern Canada (agricultural and remote industrial sites) | Long term (≥ 4 years) |
| Source: Mordor Intelligence | |||
High Initial Capital Investment Requirements
Warehouse robots cost USD 35,000–75,000 per unit, while surgical systems average USD 2.5 million; prices are too steep for many small organizations. Forty-three percent of rural hospitals reported capital budgets below robotics thresholds in a 2024 survey. Robot-as-a-service models shift spending to operating expenses but still depend on predictable throughput, limiting their appeal outside logistics. Agricultural platforms priced at USD 250,000–500,000 remain viable only for farms exceeding 2,000 acres, unless subsidy programs defray up to 50% of the costs. Capital hurdles, therefore, temper demand, especially among resource-constrained rural operators.
Safety and Liability Concerns in Human-Robot Interaction
ANSI/RIA R15.08 covers factory cobots, yet public-space service robots lack uniform liability rules, exposing operators to uninsured risks. Fewer than 30 U.S. insurers offer standalone autonomous-robot policies, leaving gaps in coverage for algorithmic failures. Thirty-four percent of retailers cited liability fears as a top barrier in 2024. High-profile sidewalk robot incidents in San Francisco and Pittsburgh triggered six-month permitting delays. Compliance patchworks raise deployment costs by an estimated 12-18%, slowing roll-outs in busy pedestrian zones.
*Our forecasts treat driver/restraint impacts as directional, not additive. The impact forecasts reflect baseline growth, mix effects, and variable interactions.
Segment Analysis
By Robot Type: Professional Platforms Dominate as Autonomous Fleets Accelerate
Professional systems accounted for 61.74% of 2025 revenue, driven by surgical, defense, and inspection robots. Despite high prices, hospitals added da Vinci systems to capitalize on Medicare reimbursement parity. However, the North America service robots market is shifting toward fleet-scale autonomous mobile robots, the fastest-growing category at a 13.95% CAGR. Locus Robotics’ installed base surpassed 40,000 units across 300 sites in 2024, driven by subscription pricing that reduces capital expenses. Personal robots such as iRobot’s Roomba face saturation with 18% U.S. household penetration. Semi-autonomous models are losing ground as AI gains push operators toward fully unmanned solutions. Software ecosystems that orchestrate multi-vendor fleets now define competitive advantage, as evidenced by Zebra’s FetchCore, which manages mixed robots across 500 facilities.
Autonomous fleets reshape cost structures by enabling 24-hour utilization without incremental labor. Fleet uptime exceeds 98%, a reliability threshold that convinces mid-market warehouses to leapfrog manual mechanization entirely. Vendors also sell usage analytics that identify bottlenecks and predict maintenance, entrenching software switching costs. As the North America service robots market size for autonomous mobile systems rises, professional robot leadership will hinge on procedural clearances and peri-operative data integration rather than hardware alone.


By Application: Delivery Outpaces Mature Warehouse Automation
Logistics and warehouse automation accounted for a 29.21% share of the North America service robots market in 2025. Penetration among large e-commerce operators exceeded 60%, signaling maturity. Growth is shifting towards delivery and last-mile services, projected to achieve a 14.12% CAGR. Only 100 U.S. municipalities host sidewalk delivery fleets, leaving a substantial runway. Healthcare applications continue to expand steadily, with Aethon’s TUG in 400 hospitals, moving medicines and linens. Agricultural use cases unlock yield gains via precision spraying and autonomous milking, but depend on uneven state credits. Security robots patrol parking lots and campuses, yet public surveillance scrutiny moderates’ adoption speed. The dispersion of use cases expands the total addressable North America service robots market size while diversifying revenue beyond traditional warehouses.
Long-term growth in delivery robotics hinges on ordinances that clarify right-of-way and liability. Fleet density also lifts software recurring revenue. By contrast, incremental warehouse gains now come from integrating articulated arms, ASRS, and AMRs under unified orchestration, an area where enterprise customers demand vendor-agnostic platforms. Application diversity, therefore, balances rapid, regulation-led spikes with steady, incremental growth streams, underpinning the North America service robots industry outlook.
By Environment: Aerial Platforms Gain Altitude
Ground robots accounted for 82.58% of the revenue in 2025, reflecting the dominance of warehouse and healthcare deployments. Yet aerial robots will log a 13.65% CAGR through 2031 as FAA Part 107 waivers for beyond-visual-line-of-sight operations doubled in 2024. Utilities such as Duke Energy inspected 12,000 miles of lines with drones, cutting manual costs by 40%. Agriculture similarly benefits from drones that precision-spray at one-tenth the chemical load of ground rigs.
Marine robots remain niche but essential for underwater inspection and port maintenance. As sensor ruggedness improves, aerial and marine segments will carve new revenue, although ground robots will continue to anchor the North America service robots market share through 2031.
By Component: Software Subscriptions Reshape Revenue
Hardware contributed 68.05% of the revenue in 2025, but software is growing at 13.6% annually as vendors pivot to robot-as-a-service pricing. Fetch and Locus derive most of their new bookings from per-pick or per-hour contracts, which smooths cash flows and aligns vendor incentives with customer throughput. Zebra’s FetchCore orchestrates mixed fleets and integrates with WMS or ERP, binding customers to multi-year licenses.
Declining LiDAR prices to USD 500 have unlocked high-definition mapping for mid-scale fleets, but component commoditization means margins are migrating to software. Predictive maintenance algorithms reduced unplanned downtime by 35% in 2024, resulting in lower break-fix service calls. The North America service robots market size will therefore skew progressively toward SaaS-like revenue streams as fleets expand.
Geography Analysis
The United States holds 75.83% of the North America service robots market size, anchored by mega-fulfillment and surgical deployments. Growth is expanding into mid-market logistics and regional healthcare systems as AMR price points decline and reimbursement parity supports surgical uptake. Third-party logistics firms accounted for 42% of new AMR installations in 2024, up from 28% in 2023. State agricultural incentives create hotspots in Iowa, Nebraska, and California, where grants cover up to half of the equipment cost. However, only 14 states offer such programs, leading to patchy farm adoption.
Mexico is the fastest-growing geography, with a 13.75% CAGR, as nearshoring boosts automation investment. Foreign direct investment reached USD 36 billion in 2024, primarily channeled into automotive and electronics plants that utilize collaborative robots to meet export quality standards. Wage inflation of 8.2% in 2024 narrowed the cost gap with the United States, making robotic labor more attractive. Vendors such as Locus and Fetch opened Mexican sales offices to support this surge.
Canada’s market centers on healthcare and agriculture. Ontario earmarked CAD 45 million (USD 33 million) in 2024 for rehab robotics across 80 homes, aiming to ease elder-care staffing gaps. Prairie grain operations test aerial drones for crop scouting, while British Columbia ports deploy marine robots for hull cleaning. However, technician shortages in Northern communities extend repair wait times beyond 72 hours, a restraint that moderates adoption outside metropolitan corridors.
Regulatory Landscape
Service robot deployment in North America is shaped more by safety standards, enforcement practices, and procurement rules than by a single robotics-specific regulator. In the United States, OSHA continues to rely on general duty and existing workplace safety guidance rather than a dedicated robotics rule, while safety conformity for robot systems increasingly tracks consensus standards such as ANSI/RIA R15.06-2025, updated in late 2025 and harmonized with ISO 10218-1:2025 and ISO 10218-2:2025, including expanded cybersecurity and risk assessment considerations for integrated robot systems.
Canada reinforced alignment with updated international safety frameworks through CSA Z434-2026 (published in 2026), which adopts ISO 10218-1:2025 and ISO 10218-2:2025 with Canadian deviations, superseding the 2014 edition and raising the compliance baseline for robot applications and cells. In parallel, 2026 legislative activity in the United States introduced supply chain and procurement scrutiny for advanced robots, including proposals to create a National Commission on Robotics and to restrict federal contracting linked to humanoid robots from countries of concern. Vendors selling into government-adjacent and critical-infrastructure customers therefore face an additional layer of diligence.
Value Chain Analysis
The value chain for service robots in North America spans core components (sensors, edge compute, batteries, motors, bearings, actuators, and safety electronics), system integration and software (navigation, orchestration, fleet management, and cybersecurity), assembly and test, and then deployment via direct enterprise sales, channel partners, and robot-as-a-service offerings. Lead times and availability of mechanical and mechatronic parts have emerged as practical gating factors for scaling fleets, with industry commentary in 2026 highlighting bearings, actuators, and custom castings as recurring bottlenecks that can delay production ramps even when software and demand are ready.
On the supply side, tariffs and sourcing volatility are reshaping bills of materials and manufacturing footprints. Suppliers and OEMs are increasingly pursuing multi-sourcing and North American trade-zone options across the United States, Canada, and Mexico. Order backlogs reported in 2025 for robot manufacturers have extended delivery windows for some models, which elevates the importance of serviceability, spares availability, and deployment readiness in vendor selection, especially for logistics and healthcare operators rolling out multi-site fleets.
Competitive Landscape
North America service robots market competition remains moderate, with no vendor exceeding a 15% share. Intuitive Surgical dominates the surgical robotics market with 8,500 global systems, yet lower-cost entrants targeting ambulatory centers are eroding its pricing power. Zebra’s 2021 Fetch acquisition signaled consolidation as buyers demand integrated hardware, software, and analytics. Locus Robotics pivoted to software-heavy subscriptions, generating 68% of 2024 revenue from recurring sources. Ag-tech remains unconsolidated; Blue River’s See and Spray leads precision weeding, yet penetration among large farms is just 12%.
Startups leverage transformer vision to sidestep the cost of sensors. Miso Robotics deployed kitchen arms in 500 restaurants, utilizing vision models that learn through demonstration, thereby reducing configuration time. Patent filings increased by 22% in 2024, with a concentration in perception, battery management, and human-robot safety, reflecting intensive research and development efforts across both incumbents and challengers. Vendors with ISO 13482 or ANSI/RIA R15.08 certifications gain sales advantages by simplifying risk assessments for cautious buyers.
Strategic moves include Amazon’s expansion of Proteus to 500 fulfillment centers, which has slashed injury rates by 18%, and Zebra integrating Fetch robots with Reflexis workforce software, reducing task-switch delays by 25%. Such multi-asset orchestration underscores a pivot toward hybrid human-robot labor models. Ultimately, data ownership and AI update cadence may overshadow mechanical engineering as the core moat in the North America service robots industry.
North America Service Robots Industry Leaders
iRobot Corporation
Intuitive Surgical Inc.
SoftBank Robotics Group Corp.
Lely Holding S.À R.L.
Knightscope Inc.
- *Disclaimer: Major Players sorted in no particular order

Market Opportunities and Future Outlook
Domestic capacity build-out and localized supply chains create whitespace for service-robot OEMs and integrators that can deliver faster lead times, stable spares availability, and standardized deployment playbooks across multi-site customers. FANUC America announcing a USD 90 million facility in Michigan (March 2026) and Yaskawa-backed expansion planning in Wisconsin through a tax incremental financing district for a USD 182 million investment (April 2026) point to a strengthening regional manufacturing base for robotics and adjacent automation hardware. Buyers shifting from pilots to repeatable rollouts are also elevating the weight of vendor support coverage, maintenance readiness, and parts continuity in purchase decisions.
Healthcare, senior living, and commercial facilities offer near-term opportunity for scaled, service-centric robot deployments where labor gaps and predictable workflows support recurring software and managed-service economics. SoftBank Robotics America and Direct Supply expanded their partnership in May 2026, with nearly 100 senior living communities using autonomous floor care robots, illustrating a replicable template for multi-location adoption. In consumer and light-commercial cleaning, portfolio broadening and hybrid ecosystems (robotic plus non-robotic floor care) further widen the addressable opportunity, including iRobot introducing a new generation of Roomba robots alongside a 5-in-1 user-operated hard-floor cleaner in July 2026.
Recent Industry Developments
- July 2026: iRobot introduced a new generation of Roomba robot vacuums and expanded its floor-care portfolio with the Roomba Electro Plus, a user-operated 5-in-1 hard-floor cleaner. The rollout broadens iRobot's coverage across automated and non-automated cleaning needs, supporting wider channel participation beyond robot-only purchasing cycles.
- May 2026: SoftBank Robotics America and Direct Supply extended their strategic partnership to accelerate deployment of autonomous floor care robots in senior living communities. With nearly 100 communities using the technology as of the announcement, the collaboration reinforces repeatable, multi-site rollouts where service and support infrastructure can become a differentiator.
- April 2026: Intuitive Surgical lifted its 2026 outlook for da Vinci procedure growth, citing strength in general surgery. The update underscores continued utilization momentum for surgical robotics in North America, strengthening the installed-base flywheel that supports instruments, services, and software-driven workflow upgrades.


Research Methodology Framework and Report Scope
Market Definition and Coverage
This market covers the revenue generated from service robots deployed in North America for performing useful tasks in professional settings and personal environments, including the related robot systems sold into the region.
Scope exclusions: We exclude industrial robots used mainly for factory automation, as well as general software-only services that are not sold as part of a service-robot system.
Segmentation Overview
- By Robot Type
- Professional Service Robots
- Personal and Domestic Service Robots
- Autonomous Mobile Robots
- Semi-Autonomous Service Robots
- By Application
- Logistics and Warehouse Automation
- Healthcare and Medical Assistance
- Agriculture and Farming
- Defense and Public Safety
- Delivery and Last-Mile Services
- By Environment
- Ground-Based Robots
- Aerial Service Robots
- Marine Service Robots
- By Component
- Hardware
- Software
- Services
- By Geography
- United States
- Canada
- Mexico
Data Sources, Market Sizing, and Validation
Desk Research
Desk research sets the boundaries of what counts as a service robot in North America and helps anchor the model to real adoption signals. We rely on public and official sources such as IFR publications on service robotics, U.S. Census and trade statistics, and customs and tariff-line import data that helps indicate shipment momentum for key robot assemblies.
To keep assumptions realistic, we also review sources such as IEEE and other peer reviewed journals for technology adoption context, patent databases for activity direction, and government materials on safety and operating rules (for example, rules relevant to sidewalk delivery and UAV operations). Company filings, earnings decks, and reputable press interviews are used to cross-check unit shipment commentary, pricing direction, and backlog language where disclosed. We also use paid subscriptions for company financials and intelligence, news and financials, and patent databases to fill gaps and verify timelines. The sources named here are illustrative only, and many additional references were used for data collection, validation, and clarification.
Primary Interviews and Surveys
Primary conversations are used to convert desk signals into realistic adoption rates, selling prices, and deployment patterns across the United States, Canada, and Mexico. We spoke with a mix of robot OEMs, component suppliers, integrators, and end users in healthcare, logistics, retail, hospitality, and public services so assumptions could be checked from more than one angle. When inputs did not align, we revisited the logic with follow-up questions until a consistent view emerged across regions and use cases.
Distribution of primary research fieldwork respondents
| Company type | Respondent position | Region |
|---|---|---|
| Top tier: 29% | CXOs: 12% | |
| Mid tier: 52% | Functional/Unit leaders: 40% | |
| Smaller Players: 19% | Managers: 48% |
Market-Sizing & Forecasting
Sizing starts with a top-down build that reconstructs addressable spend by linking North America end-market demand pools to service-robot adoption, followed by pricing logic for the major robot categories. In practice, the model is guided by variables such as deployment intensity in warehouses and hospitals, labor availability signals, capital spending cycles, regulatory permissions for delivery robots and drones, and replacement or upgrade timing for installed fleets.
To keep totals grounded, we corroborate the output with selective bottom-up checks such as sampled ASP multiplied by estimated unit volumes for a few high-visibility applications, plus channel checks from integrators on typical project sizes. Where visibility is limited for smaller deployments, we apply conservative penetration bands and validate them through interviews, and then adjust the aggregate only when multiple independent signals point in the same direction.
For forecasting, we use scenario analysis supported by a light multivariate regression overlay, where growth is tied to a small set of observable drivers like labor cost pressure, automation capex intent, and category level ASP movement. Assumptions for ASP progression are built around mix shift (professional versus personal), expected feature content, and typical discounting as volumes scale, and then reviewed with industry participants before finalizing the curve.
Data Validation & Update Cycle
Outputs are checked against independent indicators such as shipment direction from trade data, reported order momentum, and deployment announcements that can be verified. Outliers are flagged and reviewed in steps, first by the model owner and then through an internal analyst review before numbers are signed off.
We refresh the report annually, and interim updates are made when a material event changes adoption or pricing, such as a regulation shift or a step change in procurement. Before delivery, a final freshness pass is completed so clients receive the most current assumptions and recalculated outputs.
Mordor Intelligence's North America Service Robots Market Market Sizing Compared With Other Published Estimates
Published market numbers for North America service robots do not always match because the counting rules behind them are often different, even when the market name looks the same. The spread usually comes from what is included as a service robot, which year is treated as the current base, and how pricing is converted and trended over time.
In this study, we put extra attention on keeping the latest-year ASPs and currency timing consistent with the base-year window, and we re-check the price and volume assumptions when fresh deployment signals show up, which is a refresh discipline applied by Mordor Intelligence.
Benchmark comparison
| Source | Market Size | Gaps in Research Methodology |
|---|---|---|
| Mordor Intelligence | USD 13.93 B (2025) | |
| Global Consultancy A | USD 12.97 B (2023) | Uses an earlier base year and a shorter forecast window, and it appears to emphasize professional service robotics, which can undercount personal and emerging delivery categories in later years. |
| Industry Publisher B | USD 10.24 B (2024) | Anchors the series to a different base year and may apply broader price deflators over a longer horizon to 2035, which can shift the implied ASP path versus a category-mix based ASP build. |
The comparison shows that the main differences come from base-year choice and how prices are carried forward as robot mix changes across applications. By tying the model to observable adoption signals and using repeatable checks on ASP and penetration, our estimate stays traceable to a clear set of inputs that can be reviewed and updated.


Key Questions Answered in the Report
What is the projected value of North America service robots by 2031?
The market is forecast to reach USD 29.19 billion by 2031, reflecting a 13.12% CAGR from 2026.
Which application area is expected to grow fastest?
Delivery and last-mile services are set for the quickest 14.12% CAGR through 2031 as municipalities grant sidewalk-robot approvals.
Why are autonomous mobile robots gaining popularity among mid-sized warehouses?
Payback periods have fallen to 18 months and subscription pricing removes large capital outlays, making fleets accessible to firms with fewer than 500 employees.
How are rising labor costs influencing adoption?
Wage inflation of 6.8% in logistics and healthcare is pushing operators to automate repetitive tasks, boosting robot demand.
What restrains adoption in rural areas?
High capital costs, limited insurance cover, and a shortage of certified maintenance technicians extend repair wait times beyond 72 hours.
Which country shows the fastest growth within the region?
Mexico leads with a projected 13.75% CAGR driven by nearshoring investments in automotive and electronics manufacturing.
Page last updated on:






