
| Study Period | 2017 - 2030 |
| Base Year For Estimation | 2024 |
| Forecast Data Period | 2025 - 2030 |
| Market Size (2025) | USD 27.13 Billion |
| Market Size (2030) | USD 36.98 Billion |
| CAGR (2025 - 2030) | 6.39 % |
| Market Concentration | High |
Major Players*Disclaimer: Major Players sorted in no particular order |


North America Seed Market Analysis
The North America Seed Market size is estimated at 27.13 billion USD in 2025, and is expected to reach 36.98 billion USD by 2030, growing at a CAGR of 6.39% during the forecast period (2025-2030).
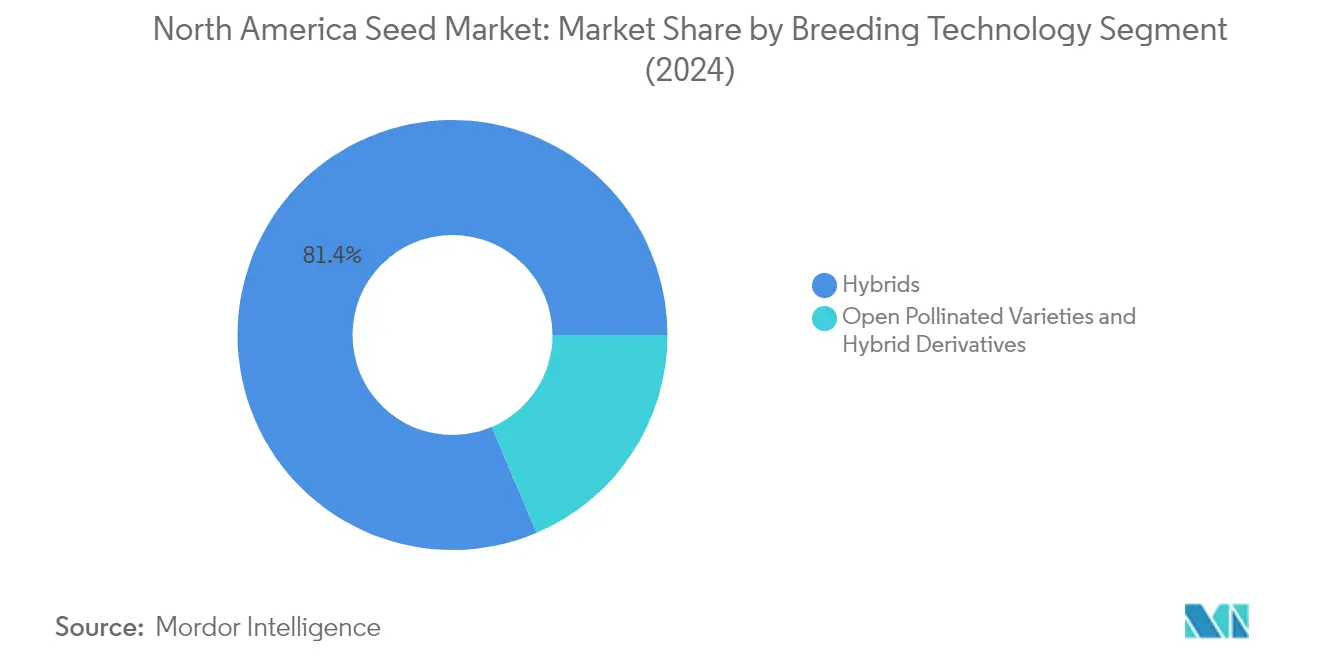
The North American seed industry is undergoing a significant transformation driven by technological advancements in plant breeding and genetic modification techniques. Modern biotechnology and precision breeding methods have revolutionized seed development, leading to the dominance of hybrid seeds, which accounted for 81.4% of the total market value in 2022. This technological revolution has enabled seed companies to develop varieties with enhanced traits such as improved disease resistance, higher yields, and better stress tolerance. The integration of artificial intelligence and data analytics in seed breeding programs has accelerated the development cycle and improved the precision of trait selection. Companies are heavily investing in research and development facilities, exemplified by the establishment of new breeding stations and technology centers across the region.
The industry has witnessed a notable shift in production methods, particularly in protected cultivation infrastructure. This trend is especially prominent in Mexico, where Sinaloa leads in protected cultivation area, followed by significant installations in Jalisco (3,310 hectares) and Baja California (2,647 hectares). The advancement in controlled environment agriculture has enabled year-round production and better quality control, particularly for high-value vegetable seeds. These facilities incorporate sophisticated climate control systems, automated irrigation, and precise nutrient management, resulting in higher seed quality and production efficiency. The protected cultivation segment has become increasingly important for developing and maintaining pure seed lines and producing hybrid seeds under controlled conditions.
Environmental sustainability has emerged as a crucial factor shaping the industry landscape. Traditional open-pollinated varieties, valued at USD 4.23 billion in 2022, continue to play a vital role in sustainable agriculture, particularly among smaller farms and organic producers. Seed companies are increasingly focusing on developing varieties that require fewer inputs while maintaining high productivity levels. The industry has seen growing investment in breeding programs focused on drought tolerance, pest resistance, and adaptation to changing climatic conditions. This shift reflects the broader agricultural sector's movement toward more sustainable practices and reduced environmental impact.
The market structure is characterized by a mix of large multinational corporations and specialized regional players, each contributing to the industry's diversity and innovation capacity. Regional production patterns show distinct specialization, with Canada's vegetable production concentrated in Ontario (55.2%), Quebec (34.0%), and British Columbia (3.1%). The industry has witnessed significant consolidation through mergers and acquisitions, while simultaneously supporting the emergence of specialized seed developers focusing on specific crop segments or regional adaptations. This dynamic has fostered both competition and collaboration, driving innovation while maintaining genetic diversity in the seed pool. The market continues to evolve with new players entering specialized segments and established companies expanding their portfolios through strategic investments and partnerships.
North America Seed Market Trends
The United States accounted for the largest area under cultivation land in North America due to the availability of vast areas of arable land and favorable government policies
- The North American agricultural land is characterized by its vast area of arable land, diverse climatic zones, and advanced farming techniques. The cultivation of row crops plays a major role in meeting the region's increasing demand for food, feed, and industrial raw materials. The region not only produces for domestic consumption but also contributes significantly to global agricultural trade. As a result, the total acreage of row crops in the region increased by 0.5% between 2017 and 2022, reaching 131.9 million ha. The United States is the largest agricultural producer in North America. It has a total agricultural land area of over 113.9 million ha, with around 112.7 million ha used for row crops in 2022. This is because the country's agricultural policies, including subsidies and support programs, encouraged large-scale farming.
- In 2022, corn accounted for the major share of 34.6% of the North American row crops acreage. This is because the climate in many parts of North America, particularly the Midwest region of the United States, is highly suitable for corn cultivation. Additionally, the stability of the corn market, combined with its consistent demand, makes it an attractive option for many North American farmers. As a result, the acreage for corn is estimated to reach 52.1 million ha in 2030.
- Soybeans accounted for the second largest acreage in North America, with a share of 28.5% of the overall region's row crop cultivation area in 2022. This is because of the high demand for soybeans in the region from processing industries to make soybean oil, tofu, soy milk, and protein isolates, providing a stable market for growers. The favorable government policies and stable demand for row crops in the domestic market are estimated to drive the acreage in the region.

Understand The Key Trends Shaping This Market
Download PDF
OTHER KEY INDUSTRY TRENDS COVERED IN THE REPORT
- Peas are the major vegetable crop cultivated in the region due to their high demand from food processing industries and daily consumption
- Increasing demand for fungal and viral disease-resistant Brassicaceae seeds in the region
- Seeds resistant to viral and fungal diseases and long shelf-life traits are driving the tomato and onion seed market
- Transgenic breeding is highly used in North America due to the high approval rates of genetically modified organisms and advancements in breeding technology
- Rising adoption of disease-resistant alfalfa and cotton seeds due to their high demand for resistance to diseases such as wilts and RKN (Root Knot Nematode)
- Increasing usage of disease resistant and wider adaptability traits are driving the growth of grain seed market in the region
- Growing adoption of the disease resistant and drought tolerant seeds for wheat and soybean in the region
Segment Analysis: Breeding Technology
Hybrids Segment in North America Seed Market
The seeds segment maintains its dominant position in the North American seed market, accounting for approximately 81% of the total market value in 2024. This substantial market share is attributed to the segment's superior traits, including higher yields, improved disease resistance, and consistent performance that meets the demands of modern agriculture. The segment encompasses both transgenic and non-transgenic hybrids, with transgenic hybrids particularly strong in crops like corn, soybean, and cotton. The segment's growth is driven by continuous advancements in plant breeding techniques, allowing the development of new plant varieties with desired traits through DNA modification. The increasing adoption of hybrid seeds in vegetables, where they account for nearly 93% of seed usage, further strengthens this segment's market position. The segment is projected to grow at around 7% annually through 2024-2029, supported by the rising demand for high-yielding varieties and improved traits that address various agricultural challenges.
Open Pollinated Varieties & Hybrid Derivatives in North America Seed Market
The open pollinated varieties and hybrid derivatives segment plays a crucial role in the North American seed market, particularly in crops where genetic diversity and traditional breeding methods remain important. This segment serves specific market needs, especially in organic farming where GMO seeds are prohibited. These varieties are particularly valued for their ability to adapt to local environmental conditions, stronger growth characteristics, and lower input requirements. The segment maintains its significance in crops like wheat, where open-pollinated varieties dominate with over 94% of the cultivation. Farmers appreciate these varieties for their cost-effectiveness and ability to save seeds for subsequent seasons, making them particularly attractive for low-income farming operations. The segment also benefits from the growing organic farming sector, where the prohibition of GMO seeds creates a natural market for open-pollinated varieties.
Segment Analysis: Cultivation Mechanism
Open Field Segment in North American Seed Market
Open field cultivation dominates the North American seed market, commanding approximately 99.6% of the total market value in 2024. This overwhelming seed market share is attributed to the region's vast agricultural landscape and the availability of advanced machinery and technology specifically designed for open-field cultivation. The segment's dominance is particularly evident in major crops such as rice, corn, wheat, soybean, and sorghum, with grains and cereals holding nearly 58% of the total open field market value. The United States leads the open-field cultivation segment, supported by extensive farming operations across diverse geographical regions and favorable government initiatives promoting agricultural development. The segment's robust performance is further strengthened by the lower initial investment requirements compared to protected cultivation methods and the widespread adoption of advanced farming techniques that enhance productivity in open-field conditions.
Protected Cultivation Segment in North American Seed Market
Protected cultivation represents an emerging trend in the North American seed market, demonstrating strong growth potential with an expected growth rate of approximately 8% during 2024-2029. This growth is primarily driven by increasing demand for year-round vegetable production and the need to mitigate climate-related risks. Mexico leads the protected cultivation segment, accounting for about 55% of this market, followed by the United States at nearly 44%. The segment's growth is particularly notable in crops like tomatoes, cucumbers, and gherkins, which together account for over 93% of the protected cultivation seed market value. The adoption of protected cultivation methods is increasing due to their ability to provide controlled growing conditions, higher yields, and better quality produce, especially in regions with challenging climate conditions. The segment is witnessing significant technological advancements in greenhouse systems and growing interest from commercial farmers looking to maximize productivity per square foot.
Segment Analysis: Crop Type
Row Crops Segment in North America Seed Market
Row crops continue to dominate the North American seed market, accounting for approximately 92% of the total market value in 2024. This commanding position is primarily driven by extensive cultivation of major crops like corn, soybeans, wheat, and cotton across vast agricultural lands in the region. The United States, being the world's largest corn producer accounting for nearly 32% of global production, significantly contributes to this segment's dominance. The segment's strength is further reinforced by increasing demand from both food and feed industries, along with growing requirements for industrial applications such as biofuels. Additionally, the widespread adoption of genetically modified varieties and advanced farming techniques has helped maintain high productivity levels across row crop cultivation.
Solanaceae Segment in North America Seed Market
The Solanaceae segment is emerging as the fastest-growing category in the North American seed market, projected to grow at approximately 7% during 2024-2029. This robust growth is primarily driven by increasing demand for crops like tomatoes, chilies, and eggplants, particularly in protected cultivation environments. The segment's expansion is supported by technological advancements in hybrid seed development, offering improved disease resistance and higher yields. Mexico's significant role in protected cultivation, especially in tomato production, is contributing substantially to this growth. The segment is also benefiting from increasing consumer preference for fresh produce and rising demand from processing industries throughout the year.
Remaining Segments in Crop Type
The remaining segments in the North American seed market primarily comprise various vegetable categories including cucurbits, brassicas, roots and bulbs, and unclassified vegetables. These segments play a crucial role in maintaining crop diversity and meeting specific market demands. Cucurbits, including crops like cucumber and pumpkin, serve both fresh market and processing industries. Brassicas, such as cabbage and cauliflower, maintain steady demand due to their nutritional value and widespread consumption. The roots and bulbs category, including onions and garlic, continues to serve essential culinary and commercial needs. Each of these segments contributes uniquely to the market's overall dynamics, supported by ongoing innovations in seed technology and changing consumer preferences.
North America Seed Market Geography Segment Analysis
North America Seed Market in United States
The United States dominates the North American seed market, accounting for approximately 77% of the total market value in 2024. The country's US seeds market is projected to grow at nearly 7% annually from 2024 to 2029, driven by its advanced agricultural practices and high adoption of biotech varieties. The row crops segment, particularly corn and soybean, forms the backbone of the US seed market, supported by strong demand from food, feed, and ethanol industries. The country's leadership in commercialized biotech crops, with extensive areas under GM corn, soybean, cotton, and canola cultivation, demonstrates its technological advancement in seed development. The robust research and development infrastructure, combined with favorable regulatory frameworks for GM crops, has enabled continuous innovation in trait development. The presence of major American seed companies and their extensive distribution networks ensures widespread availability of high-quality seeds to farmers. Additionally, the country's diverse climatic conditions and large agricultural land base provide opportunities for cultivating a wide range of crops, further strengthening its position in the seed market.
North America Seed Market in Canada
Canada has established itself as a crucial player in the North American seed market, particularly in specific crop segments like canola and cereals. The country's seed industry benefits from strong public-private partnerships in research and development, leading to continuous innovation in seed technologies. Canadian seed producers are recognized globally for their high-quality standards and rigorous certification processes overseen by the Canadian Food Inspection Agency (CFIA). The country's vast agricultural land and diverse growing conditions support the cultivation of various crops, from prairie grains to specialized vegetable varieties. Canadian farmers' increasing adoption of precision agriculture techniques and sustainable farming practices has driven demand for advanced seed varieties. The country's strong focus on export markets, particularly for canola and wheat seeds, has encouraged investment in seed breeding programs. Additionally, Canada's robust regulatory framework for seed development and testing ensures the maintenance of high genetic standards while promoting innovation in the sector. The government's support through various agricultural programs and research initiatives continues to strengthen the country's position in the regional seed market.
North America Seed Market in Mexico
Mexico's seed market demonstrates significant potential, driven by its diverse agricultural landscape and increasing adoption of modern farming practices. The country has emerged as a major producer of vegetables under protected cultivation, particularly tomatoes, cucumbers, and peppers, creating sustained demand for high-quality hybrid seeds. Mexico's strategic geographical location and trade agreements facilitate strong agricultural trade relationships, especially with the United States, influencing seed demand patterns. The government's shift toward market-oriented policies has encouraged investment in the seed sector, promoting the development of locally adapted varieties. The country's varied climatic zones allow for year-round cultivation of different crops, supporting a diverse seed market. Mexican farmers are increasingly adopting hybrid and improved seed varieties to enhance productivity and meet international market standards. The presence of both domestic and international seed companies has improved access to advanced seed technologies. Furthermore, Mexico's growing focus on sustainable agriculture and food security has led to increased investment in seed research and development programs.
North America Seed Market in Other Countries
The seed market in other North American countries, including Cuba, the Dominican Republic, Costa Rica, Jamaica, Panama, and Haiti, represents an emerging opportunity in the region. These countries are increasingly focusing on agricultural self-sufficiency, driving demand for improved seed varieties. The market in these countries is characterized by a mix of traditional and modern farming practices, with growing adoption of hybrid seeds in certain crop segments. Government initiatives to modernize agriculture and improve food security have led to increased investment in seed infrastructure. These markets show particular strength in specific crops suited to their tropical and subtropical climates. Local adaptation of seed varieties and development of resilient cultivars has become a priority due to climate change concerns. The presence of international seed companies, combined with local breeding programs, is helping to improve seed quality and availability. Additionally, these countries are developing specialized niches in certain crop segments, particularly in tropical fruits and vegetables, creating unique opportunities in the seed market.
Get Analysis on Important Geographic Markets
Download PDF
North America Seed Industry Overview
Top Companies in North America Seed Market
The North American seed market is characterized by intense innovation and strategic developments among leading seed companies like Corteva Agriscience, Bayer AG, Land O'Lakes, Syngenta Group, and BASF SE. Companies are heavily investing in research and development to introduce advanced seed varieties with enhanced traits such as disease resistance, drought tolerance, and higher yields. Product innovation remains the primary strategy, with companies focusing on developing biotech traits and launching new hybrid varieties across different crop segments. Operational agility is demonstrated through extensive distribution networks and localized breeding programs adapted to regional growing conditions. Strategic partnerships and collaborations, particularly in biotechnology and digital farming solutions, have become increasingly important for maintaining market position. Companies are also expanding their presence through new research facilities, production sites, and technology centers to strengthen their regional footprint and better serve local farming communities.
Consolidated Market Led By Global Players
The North American seed market exhibits a highly consolidated structure dominated by large multinational agricultural companies with diverse product portfolios spanning multiple crop segments. These global conglomerates leverage their extensive research capabilities, established distribution networks, and strong financial resources to maintain their market positions. The market is characterized by significant barriers to entry due to the high investments required in research and development, regulatory compliance costs, and the need for extensive intellectual property portfolios. Local and regional players typically focus on specific crop segments or geographical niches where they can maintain competitive advantages through specialized knowledge and strong farmer relationships.
Merger and acquisition activities have been instrumental in shaping the competitive landscape, with larger companies acquiring smaller, innovative seed companies to expand their technological capabilities and market reach. These consolidations have led to increased market concentration and enhanced the ability of the largest seed companies to invest in advanced breeding technologies and digital solutions. The trend of vertical integration is also evident, with companies expanding across the agricultural value chain to provide comprehensive solutions to farmers, including seeds, crop protection products, and digital farming services.
Innovation and Integration Drive Future Success
Success in the North American seed market increasingly depends on companies' ability to develop innovative products that address evolving agricultural challenges while meeting stringent regulatory requirements. Market leaders must continue investing in next-generation breeding technologies, including gene editing and artificial intelligence-driven breeding programs, to maintain their competitive edge. Building strong relationships with farmers through integrated solutions, technical support, and digital platforms has become crucial for maintaining market share. Companies must also focus on sustainability initiatives and develop seeds adapted to changing climatic conditions to meet growing environmental concerns.
For emerging players and challengers, success lies in identifying and serving underserved market segments or crop varieties where larger companies may have limited focus. Developing specialized products for specific regional conditions or niche markets can provide opportunities for growth. Strategic partnerships with technology providers, research institutions, and local distributors can help smaller companies overcome resource limitations and expand their market presence. Additionally, companies must navigate complex regulatory environments while maintaining flexibility to adapt to changing market conditions and consumer preferences. The ability to provide value-added services alongside seed products, such as agronomic advice and digital tools, will become increasingly important for maintaining competitive advantages in the market.
North America Seed Market Leaders
-
BASF SE
-
Bayer AG
-
Corteva Agriscience
-
Land O’Lakes Inc.
-
Syngenta Group
- *Disclaimer: Major Players sorted in no particular order

Need More Details on Market Players and Competiters?
Download PDF
North America Seed Market News
- July 2023: BASF expanded its Xitavo soybean seed portfolio with the addition of its 11 new high-yielding varieties for the 2024 growing season, featuring the Enlist E3 technology to combat difficult weeds.
- June 2023: Syngenta opened a new R&D facility in Northern Illinois, United States, which provides opportunities for regenerative agriculture practices through farmer collaboration.
- June 2023: Syngenta Seeds launched a new conventional soybean brand, "Silverline," into the Canadian market. This brand offers high-protein soybeans and NK-treated soybean varieties.
Free With This Report
We provide a complimentary and exhaustive set of data points on regional and country-level metrics that present the fundamental structure of the industry. Presented in the form of 90+ free charts, the section covers difficult-to-find data from various regions regarding the area under cultivation for different crops within the scope


North America Seed Market Report - Table of Contents
1. EXECUTIVE SUMMARY & KEY FINDINGS
2. REPORT OFFERS
3. INTRODUCTION
- 3.1 Study Assumptions & Market Definition
- 3.2 Scope of the Study
- 3.3 Research Methodology
4. KEY INDUSTRY TRENDS
-
4.1 Area Under Cultivation
- 4.1.1 Row Crops
- 4.1.2 Vegetables
-
4.2 Most Popular Traits
- 4.2.1 Alfalfa & Cotton
- 4.2.2 Cucumber & Cabbage
- 4.2.3 Rice & Corn
- 4.2.4 Tomato & Onion
- 4.2.5 Wheat & Soybean
-
4.3 Breeding Techniques
- 4.3.1 Row Crops & Vegetables
- 4.4 Regulatory Framework
- 4.5 Value Chain & Distribution Channel Analysis
5. MARKET SEGMENTATION (includes market size in Value in USD, Forecasts up to 2030 and analysis of growth prospects)
-
5.1 Breeding Technology
- 5.1.1 Hybrids
- 5.1.1.1 Non-Transgenic Hybrids
- 5.1.1.2 Transgenic Hybrids
- 5.1.1.2.1 Herbicide Tolerant Hybrids
- 5.1.1.2.2 Insect Resistant Hybrids
- 5.1.1.2.3 Other Traits
- 5.1.2 Open Pollinated Varieties & Hybrid Derivatives
-
5.2 Cultivation Mechanism
- 5.2.1 Open Field
- 5.2.2 Protected Cultivation
-
5.3 Crop Type
- 5.3.1 Row Crops
- 5.3.1.1 Fiber Crops
- 5.3.1.1.1 Cotton
- 5.3.1.1.2 Other Fiber Crops
- 5.3.1.2 Forage Crops
- 5.3.1.2.1 Alfalfa
- 5.3.1.2.2 Forage Corn
- 5.3.1.2.3 Forage Sorghum
- 5.3.1.2.4 Other Forage Crops
- 5.3.1.3 Grains & Cereals
- 5.3.1.3.1 Corn
- 5.3.1.3.2 Rice
- 5.3.1.3.3 Sorghum
- 5.3.1.3.4 Wheat
- 5.3.1.3.5 Other Grains & Cereals
- 5.3.1.4 Oilseeds
- 5.3.1.4.1 Canola, Rapeseed & Mustard
- 5.3.1.4.2 Soybean
- 5.3.1.4.3 Sunflower
- 5.3.1.4.4 Other Oilseeds
- 5.3.1.5 Pulses
- 5.3.1.5.1 Pulses
- 5.3.2 Vegetables
- 5.3.2.1 Brassicas
- 5.3.2.1.1 Cabbage
- 5.3.2.1.2 Carrot
- 5.3.2.1.3 Cauliflower & Broccoli
- 5.3.2.1.4 Other Brassicas
- 5.3.2.2 Cucurbits
- 5.3.2.2.1 Cucumber & Gherkin
- 5.3.2.2.2 Pumpkin & Squash
- 5.3.2.2.3 Other Cucurbits
- 5.3.2.3 Roots & Bulbs
- 5.3.2.3.1 Garlic
- 5.3.2.3.2 Onion
- 5.3.2.3.3 Potato
- 5.3.2.3.4 Other Roots & Bulbs
- 5.3.2.4 Solanaceae
- 5.3.2.4.1 Chilli
- 5.3.2.4.2 Eggplant
- 5.3.2.4.3 Tomato
- 5.3.2.4.4 Other Solanaceae
- 5.3.2.5 Unclassified Vegetables
- 5.3.2.5.1 Asparagus
- 5.3.2.5.2 Lettuce
- 5.3.2.5.3 Okra
- 5.3.2.5.4 Peas
- 5.3.2.5.5 Spinach
- 5.3.2.5.6 Other Unclassified Vegetables
-
5.4 Country
- 5.4.1 Canada
- 5.4.2 Mexico
- 5.4.3 United States
- 5.4.4 Rest of North America
6. COMPETITIVE LANDSCAPE
- 6.1 Key Strategic Moves
- 6.2 Market Share Analysis
- 6.3 Company Landscape
-
6.4 Company Profiles
- 6.4.1 Advanta Seeds - UPL
- 6.4.2 BASF SE
- 6.4.3 Bayer AG
- 6.4.4 Corteva Agriscience
- 6.4.5 DLF
- 6.4.6 Groupe Limagrain
- 6.4.7 KWS SAAT SE & Co. KGaA
- 6.4.8 Land O’Lakes Inc.
- 6.4.9 Rijk Zwaan Zaadteelt en Zaadhandel BV
- 6.4.10 Syngenta Group
- *List Not Exhaustive
7. KEY STRATEGIC QUESTIONS FOR SEEDS CEOS
8. APPENDIX
-
8.1 Global Overview
- 8.1.1 Overview
- 8.1.2 Porter’s Five Forces Framework
- 8.1.3 Global Value Chain Analysis
- 8.1.4 Global Market Size and DROs
- 8.2 Sources & References
- 8.3 List of Tables & Figures
- 8.4 Primary Insights
- 8.5 Data Pack
- 8.6 Glossary of Terms
You Can Purchase Parts Of This Report. Check Out Prices For Specific Sections
Get Price Break-up Now
List of Tables & Figures
- Figure 1:
- AREA UNDER CULTIVATION OF ROW CROPS, HECTARE, NORTH AMERICA, 2017-2022
- Figure 2:
- AREA UNDER CULTIVATION OF VEGETABLES, HECTARE, NORTH AMERICA, 2017-2022
- Figure 3:
- VALUE SHARE OF MAJOR ALFALFA TRAITS, %, NORTH AMERICA, 2022
- Figure 4:
- VALUE SHARE OF MAJOR COTTON TRAITS, %, NORTH AMERICA, 2022
- Figure 5:
- VALUE SHARE OF MAJOR CABBAGE TRAITS, %, NORTH AMERICA, 2022
- Figure 6:
- VALUE SHARE OF MAJOR CUCUMBER TRAITS, %, NORTH AMERICA, 2022
- Figure 7:
- VALUE SHARE OF MAJOR RICE TRAITS, %, NORTH AMERICA, 2022
- Figure 8:
- VALUE SHARE OF MAJOR CORN TRAITS, %, NORTH AMERICA, 2022
- Figure 9:
- VALUE SHARE OF MAJOR TOMATO TRAITS, %, NORTH AMERICA, 2022
- Figure 10:
- VALUE SHARE OF MAJOR ONION TRAITS, %, NORTH AMERICA, 2022
- Figure 11:
- VALUE SHARE OF MAJOR WHEAT TRAITS, %, NORTH AMERICA, 2022
- Figure 12:
- VALUE SHARE OF MAJOR SOYBEAN TRAITS, %, NORTH AMERICA, 2022
- Figure 13:
- VALUE SHARE OF ROW CROPS BREEDING TECHNIQUES, %, NORTH AMERICA, 2022
- Figure 14:
- VALUE SHARE OF VEGETABLES BREEDING TECHNIQUES, %, NORTH AMERICA, 2022
- Figure 15:
- VOLUME OF SEEDS, METRIC TON, NORTH AMERICA, 2017 - 2030
- Figure 16:
- VALUE OF SEEDS, USD, NORTH AMERICA, 2017 - 2030
- Figure 17:
- VOLUME OF SEEDS BY BREEDING TECHNOLOGY CATEGORIES, METRIC TON, NORTH AMERICA, 2017 - 2030
- Figure 18:
- VALUE OF SEEDS BY BREEDING TECHNOLOGY CATEGORIES, USD, NORTH AMERICA, 2017 - 2030
- Figure 19:
- VOLUME SHARE OF SEEDS BY BREEDING TECHNOLOGY CATEGORIES, %, NORTH AMERICA, 2017 VS 2023 VS 2030
- Figure 20:
- VALUE SHARE OF SEEDS BY BREEDING TECHNOLOGY CATEGORIES, %, NORTH AMERICA, 2017 VS 2023 VS 2030
- Figure 21:
- VOLUME OF SEEDS BY HYBRIDS CATEGORIES, METRIC TON, NORTH AMERICA, 2017 - 2030
- Figure 22:
- VALUE OF SEEDS BY HYBRIDS CATEGORIES, USD, NORTH AMERICA, 2017 - 2030
- Figure 23:
- VOLUME SHARE OF SEEDS BY HYBRIDS CATEGORIES, %, NORTH AMERICA, 2017 VS 2023 VS 2030
- Figure 24:
- VALUE SHARE OF SEEDS BY HYBRIDS CATEGORIES, %, NORTH AMERICA, 2017 VS 2023 VS 2030
- Figure 25:
- VOLUME OF NON-TRANSGENIC HYBRIDS SEEDS, METRIC TON, NORTH AMERICA, 2017 - 2030
- Figure 26:
- VALUE OF NON-TRANSGENIC HYBRIDS SEEDS, USD, NORTH AMERICA, 2017 - 2030
- Figure 27:
- VALUE SHARE OF NON-TRANSGENIC HYBRIDS SEEDS BY CROP, %, NORTH AMERICA, 2023 AND 2030
- Figure 28:
- VOLUME OF SEEDS BY TRANSGENIC HYBRIDS CATEGORIES, METRIC TON, NORTH AMERICA, 2017 - 2030
- Figure 29:
- VALUE OF SEEDS BY TRANSGENIC HYBRIDS CATEGORIES, USD, NORTH AMERICA, 2017 - 2030
- Figure 30:
- VOLUME SHARE OF SEEDS BY TRANSGENIC HYBRIDS CATEGORIES, %, NORTH AMERICA, 2017 VS 2023 VS 2030
- Figure 31:
- VALUE SHARE OF SEEDS BY TRANSGENIC HYBRIDS CATEGORIES, %, NORTH AMERICA, 2017 VS 2023 VS 2030
- Figure 32:
- VOLUME OF HERBICIDE TOLERANT HYBRIDS SEEDS, METRIC TON, NORTH AMERICA, 2017 - 2030
- Figure 33:
- VALUE OF HERBICIDE TOLERANT HYBRIDS SEEDS, USD, NORTH AMERICA, 2017 - 2030
- Figure 34:
- VALUE SHARE OF HERBICIDE TOLERANT HYBRIDS SEEDS BY CROP, %, NORTH AMERICA, 2023 AND 2030
- Figure 35:
- VOLUME OF INSECT RESISTANT HYBRIDS SEEDS, METRIC TON, NORTH AMERICA, 2017 - 2030
- Figure 36:
- VALUE OF INSECT RESISTANT HYBRIDS SEEDS, USD, NORTH AMERICA, 2017 - 2030
- Figure 37:
- VALUE SHARE OF INSECT RESISTANT HYBRIDS SEEDS BY CROP, %, NORTH AMERICA, 2023 AND 2030
- Figure 38:
- VOLUME OF OTHER TRAITS SEEDS, METRIC TON, NORTH AMERICA, 2017 - 2030
- Figure 39:
- VALUE OF OTHER TRAITS SEEDS, USD, NORTH AMERICA, 2017 - 2030
- Figure 40:
- VALUE SHARE OF OTHER TRAITS SEEDS BY CROP, %, NORTH AMERICA, 2023 AND 2030
- Figure 41:
- VOLUME OF OPEN POLLINATED VARIETIES & HYBRID DERIVATIVES SEEDS, METRIC TON, NORTH AMERICA, 2017 - 2030
- Figure 42:
- VALUE OF OPEN POLLINATED VARIETIES & HYBRID DERIVATIVES SEEDS, USD, NORTH AMERICA, 2017 - 2030
- Figure 43:
- VALUE SHARE OF OPEN POLLINATED VARIETIES & HYBRID DERIVATIVES SEEDS BY CROP, %, NORTH AMERICA, 2023 AND 2030
- Figure 44:
- VOLUME OF SEEDS BY CULTIVATION MECHANISM CATEGORIES, METRIC TON, NORTH AMERICA, 2017 - 2030
- Figure 45:
- VALUE OF SEEDS BY CULTIVATION MECHANISM CATEGORIES, USD, NORTH AMERICA, 2017 - 2030
- Figure 46:
- VOLUME SHARE OF SEEDS BY CULTIVATION MECHANISM CATEGORIES, %, NORTH AMERICA, 2017 VS 2023 VS 2030
- Figure 47:
- VALUE SHARE OF SEEDS BY CULTIVATION MECHANISM CATEGORIES, %, NORTH AMERICA, 2017 VS 2023 VS 2030
- Figure 48:
- VOLUME OF SEEDS SOWN IN OPEN FIELD, METRIC TON, NORTH AMERICA, 2017 - 2030
- Figure 49:
- VALUE OF SEEDS SOWN IN OPEN FIELD, USD, NORTH AMERICA, 2017 - 2030
- Figure 50:
- VALUE SHARE OF SEEDS SOWN IN OPEN FIELD BY CROP, %, NORTH AMERICA, 2023 AND 2030
- Figure 51:
- VOLUME OF SEEDS SOWN IN PROTECTED CULTIVATION, METRIC TON, NORTH AMERICA, 2017 - 2030
- Figure 52:
- VALUE OF SEEDS SOWN IN PROTECTED CULTIVATION, USD, NORTH AMERICA, 2017 - 2030
- Figure 53:
- VALUE SHARE OF SEEDS SOWN IN PROTECTED CULTIVATION BY CROP, %, NORTH AMERICA, 2023 AND 2030
- Figure 54:
- VOLUME OF SEEDS BY CROP TYPE CATEGORIES, METRIC TON, NORTH AMERICA, 2017 - 2030
- Figure 55:
- VALUE OF SEEDS BY CROP TYPE CATEGORIES, USD, NORTH AMERICA, 2017 - 2030
- Figure 56:
- VOLUME SHARE OF SEEDS BY CROP TYPE CATEGORIES, %, NORTH AMERICA, 2017 VS 2023 VS 2030
- Figure 57:
- VALUE SHARE OF SEEDS BY CROP TYPE CATEGORIES, %, NORTH AMERICA, 2017 VS 2023 VS 2030
- Figure 58:
- VOLUME OF SEEDS BY CROP FAMILY CATEGORIES, METRIC TON, NORTH AMERICA, 2017 - 2030
- Figure 59:
- VALUE OF SEEDS BY CROP FAMILY CATEGORIES, USD, NORTH AMERICA, 2017 - 2030
- Figure 60:
- VOLUME SHARE OF SEEDS BY CROP FAMILY CATEGORIES, %, NORTH AMERICA, 2017 VS 2023 VS 2030
- Figure 61:
- VALUE SHARE OF SEEDS BY CROP FAMILY CATEGORIES, %, NORTH AMERICA, 2017 VS 2023 VS 2030
- Figure 62:
- VOLUME OF SEEDS BY CROP CATEGORIES, METRIC TON, NORTH AMERICA, 2017 - 2030
- Figure 63:
- VALUE OF SEEDS BY CROP CATEGORIES, USD, NORTH AMERICA, 2017 - 2030
- Figure 64:
- VOLUME SHARE OF SEEDS BY CROP CATEGORIES, %, NORTH AMERICA, 2017 VS 2023 VS 2030
- Figure 65:
- VALUE SHARE OF SEEDS BY CROP CATEGORIES, %, NORTH AMERICA, 2017 VS 2023 VS 2030
- Figure 66:
- VOLUME OF COTTON SEED, METRIC TON, NORTH AMERICA, 2017 - 2030
- Figure 67:
- VALUE OF COTTON SEED, USD, NORTH AMERICA, 2017 - 2030
- Figure 68:
- VALUE SHARE OF COTTON SEED BY BREEDING TECHNOLOGY, %, NORTH AMERICA, 2023 AND 2030
- Figure 69:
- VOLUME OF OTHER FIBER CROPS SEED, METRIC TON, NORTH AMERICA, 2017 - 2030
- Figure 70:
- VALUE OF OTHER FIBER CROPS SEED, USD, NORTH AMERICA, 2017 - 2030
- Figure 71:
- VALUE SHARE OF OTHER FIBER CROPS SEED BY BREEDING TECHNOLOGY, %, NORTH AMERICA, 2023 AND 2030
- Figure 72:
- VOLUME OF SEEDS BY CROP CATEGORIES, METRIC TON, NORTH AMERICA, 2017 - 2030
- Figure 73:
- VALUE OF SEEDS BY CROP CATEGORIES, USD, NORTH AMERICA, 2017 - 2030
- Figure 74:
- VOLUME SHARE OF SEEDS BY CROP CATEGORIES, %, NORTH AMERICA, 2017 VS 2023 VS 2030
- Figure 75:
- VALUE SHARE OF SEEDS BY CROP CATEGORIES, %, NORTH AMERICA, 2017 VS 2023 VS 2030
- Figure 76:
- VOLUME OF ALFALFA SEED, METRIC TON, NORTH AMERICA, 2017 - 2030
- Figure 77:
- VALUE OF ALFALFA SEED, USD, NORTH AMERICA, 2017 - 2030
- Figure 78:
- VALUE SHARE OF ALFALFA SEED BY BREEDING TECHNOLOGY, %, NORTH AMERICA, 2023 AND 2030
- Figure 79:
- VOLUME OF FORAGE CORN SEED, METRIC TON, NORTH AMERICA, 2017 - 2030
- Figure 80:
- VALUE OF FORAGE CORN SEED, USD, NORTH AMERICA, 2017 - 2030
- Figure 81:
- VALUE SHARE OF FORAGE CORN SEED BY BREEDING TECHNOLOGY, %, NORTH AMERICA, 2023 AND 2030
- Figure 82:
- VOLUME OF FORAGE SORGHUM SEED, METRIC TON, NORTH AMERICA, 2017 - 2030
- Figure 83:
- VALUE OF FORAGE SORGHUM SEED, USD, NORTH AMERICA, 2017 - 2030
- Figure 84:
- VALUE SHARE OF FORAGE SORGHUM SEED BY BREEDING TECHNOLOGY, %, NORTH AMERICA, 2023 AND 2030
- Figure 85:
- VOLUME OF OTHER FORAGE CROPS SEED, METRIC TON, NORTH AMERICA, 2017 - 2030
- Figure 86:
- VALUE OF OTHER FORAGE CROPS SEED, USD, NORTH AMERICA, 2017 - 2030
- Figure 87:
- VALUE SHARE OF OTHER FORAGE CROPS SEED BY BREEDING TECHNOLOGY, %, NORTH AMERICA, 2023 AND 2030
- Figure 88:
- VOLUME OF SEEDS BY CROP CATEGORIES, METRIC TON, NORTH AMERICA, 2017 - 2030
- Figure 89:
- VALUE OF SEEDS BY CROP CATEGORIES, USD, NORTH AMERICA, 2017 - 2030
- Figure 90:
- VOLUME SHARE OF SEEDS BY CROP CATEGORIES, %, NORTH AMERICA, 2017 VS 2023 VS 2030
- Figure 91:
- VALUE SHARE OF SEEDS BY CROP CATEGORIES, %, NORTH AMERICA, 2017 VS 2023 VS 2030
- Figure 92:
- VOLUME OF CORN SEED, METRIC TON, NORTH AMERICA, 2017 - 2030
- Figure 93:
- VALUE OF CORN SEED, USD, NORTH AMERICA, 2017 - 2030
- Figure 94:
- VALUE SHARE OF CORN SEED BY BREEDING TECHNOLOGY, %, NORTH AMERICA, 2023 AND 2030
- Figure 95:
- VOLUME OF RICE SEED, METRIC TON, NORTH AMERICA, 2017 - 2030
- Figure 96:
- VALUE OF RICE SEED, USD, NORTH AMERICA, 2017 - 2030
- Figure 97:
- VALUE SHARE OF RICE SEED BY BREEDING TECHNOLOGY, %, NORTH AMERICA, 2023 AND 2030
- Figure 98:
- VOLUME OF SORGHUM SEED, METRIC TON, NORTH AMERICA, 2017 - 2030
- Figure 99:
- VALUE OF SORGHUM SEED, USD, NORTH AMERICA, 2017 - 2030
- Figure 100:
- VALUE SHARE OF SORGHUM SEED BY BREEDING TECHNOLOGY, %, NORTH AMERICA, 2023 AND 2030
- Figure 101:
- VOLUME OF WHEAT SEED, METRIC TON, NORTH AMERICA, 2017 - 2030
- Figure 102:
- VALUE OF WHEAT SEED, USD, NORTH AMERICA, 2017 - 2030
- Figure 103:
- VALUE SHARE OF WHEAT SEED BY BREEDING TECHNOLOGY, %, NORTH AMERICA, 2023 AND 2030
- Figure 104:
- VOLUME OF OTHER GRAINS & CEREALS SEED, METRIC TON, NORTH AMERICA, 2017 - 2030
- Figure 105:
- VALUE OF OTHER GRAINS & CEREALS SEED, USD, NORTH AMERICA, 2017 - 2030
- Figure 106:
- VALUE SHARE OF OTHER GRAINS & CEREALS SEED BY BREEDING TECHNOLOGY, %, NORTH AMERICA, 2023 AND 2030
- Figure 107:
- VOLUME OF SEEDS BY CROP CATEGORIES, METRIC TON, NORTH AMERICA, 2017 - 2030
- Figure 108:
- VALUE OF SEEDS BY CROP CATEGORIES, USD, NORTH AMERICA, 2017 - 2030
- Figure 109:
- VOLUME SHARE OF SEEDS BY CROP CATEGORIES, %, NORTH AMERICA, 2017 VS 2023 VS 2030
- Figure 110:
- VALUE SHARE OF SEEDS BY CROP CATEGORIES, %, NORTH AMERICA, 2017 VS 2023 VS 2030
- Figure 111:
- VOLUME OF CANOLA, RAPESEED & MUSTARD SEED, METRIC TON, NORTH AMERICA, 2017 - 2030
- Figure 112:
- VALUE OF CANOLA, RAPESEED & MUSTARD SEED, USD, NORTH AMERICA, 2017 - 2030
- Figure 113:
- VALUE SHARE OF CANOLA, RAPESEED & MUSTARD SEED BY BREEDING TECHNOLOGY, %, NORTH AMERICA, 2023 AND 2030
- Figure 114:
- VOLUME OF SOYBEAN SEED, METRIC TON, NORTH AMERICA, 2017 - 2030
- Figure 115:
- VALUE OF SOYBEAN SEED, USD, NORTH AMERICA, 2017 - 2030
- Figure 116:
- VALUE SHARE OF SOYBEAN SEED BY BREEDING TECHNOLOGY, %, NORTH AMERICA, 2023 AND 2030
- Figure 117:
- VOLUME OF SUNFLOWER SEED, METRIC TON, NORTH AMERICA, 2017 - 2030
- Figure 118:
- VALUE OF SUNFLOWER SEED, USD, NORTH AMERICA, 2017 - 2030
- Figure 119:
- VALUE SHARE OF SUNFLOWER SEED BY BREEDING TECHNOLOGY, %, NORTH AMERICA, 2023 AND 2030
- Figure 120:
- VOLUME OF OTHER OILSEEDS SEED, METRIC TON, NORTH AMERICA, 2017 - 2030
- Figure 121:
- VALUE OF OTHER OILSEEDS SEED, USD, NORTH AMERICA, 2017 - 2030
- Figure 122:
- VALUE SHARE OF OTHER OILSEEDS SEED BY BREEDING TECHNOLOGY, %, NORTH AMERICA, 2023 AND 2030
- Figure 123:
- VOLUME OF PULSES SEED, METRIC TON, NORTH AMERICA, 2017 - 2030
- Figure 124:
- VALUE OF PULSES SEED, USD, NORTH AMERICA, 2017 - 2030
- Figure 125:
- VALUE SHARE OF PULSES SEED BY BREEDING TECHNOLOGY, %, NORTH AMERICA, 2023 AND 2030
- Figure 126:
- VOLUME OF SEEDS BY CROP FAMILY CATEGORIES, METRIC TON, NORTH AMERICA, 2017 - 2030
- Figure 127:
- VALUE OF SEEDS BY CROP FAMILY CATEGORIES, USD, NORTH AMERICA, 2017 - 2030
- Figure 128:
- VOLUME SHARE OF SEEDS BY CROP FAMILY CATEGORIES, %, NORTH AMERICA, 2017 VS 2023 VS 2030
- Figure 129:
- VALUE SHARE OF SEEDS BY CROP FAMILY CATEGORIES, %, NORTH AMERICA, 2017 VS 2023 VS 2030
- Figure 130:
- VOLUME OF SEEDS BY CROP CATEGORIES, METRIC TON, NORTH AMERICA, 2017 - 2030
- Figure 131:
- VALUE OF SEEDS BY CROP CATEGORIES, USD, NORTH AMERICA, 2017 - 2030
- Figure 132:
- VOLUME SHARE OF SEEDS BY CROP CATEGORIES, %, NORTH AMERICA, 2017 VS 2023 VS 2030
- Figure 133:
- VALUE SHARE OF SEEDS BY CROP CATEGORIES, %, NORTH AMERICA, 2017 VS 2023 VS 2030
- Figure 134:
- VOLUME OF CABBAGE SEED, METRIC TON, NORTH AMERICA, 2017 - 2030
- Figure 135:
- VALUE OF CABBAGE SEED, USD, NORTH AMERICA, 2017 - 2030
- Figure 136:
- VALUE SHARE OF CABBAGE SEED BY BREEDING TECHNOLOGY, %, NORTH AMERICA, 2023 AND 2030
- Figure 137:
- VOLUME OF CARROT SEED, METRIC TON, NORTH AMERICA, 2017 - 2030
- Figure 138:
- VALUE OF CARROT SEED, USD, NORTH AMERICA, 2017 - 2030
- Figure 139:
- VALUE SHARE OF CARROT SEED BY BREEDING TECHNOLOGY, %, NORTH AMERICA, 2023 AND 2030
- Figure 140:
- VOLUME OF CAULIFLOWER & BROCCOLI SEED, METRIC TON, NORTH AMERICA, 2017 - 2030
- Figure 141:
- VALUE OF CAULIFLOWER & BROCCOLI SEED, USD, NORTH AMERICA, 2017 - 2030
- Figure 142:
- VALUE SHARE OF CAULIFLOWER & BROCCOLI SEED BY BREEDING TECHNOLOGY, %, NORTH AMERICA, 2023 AND 2030
- Figure 143:
- VOLUME OF OTHER BRASSICAS SEED, METRIC TON, NORTH AMERICA, 2017 - 2030
- Figure 144:
- VALUE OF OTHER BRASSICAS SEED, USD, NORTH AMERICA, 2017 - 2030
- Figure 145:
- VALUE SHARE OF OTHER BRASSICAS SEED BY BREEDING TECHNOLOGY, %, NORTH AMERICA, 2023 AND 2030
- Figure 146:
- VOLUME OF SEEDS BY CROP CATEGORIES, METRIC TON, NORTH AMERICA, 2017 - 2030
- Figure 147:
- VALUE OF SEEDS BY CROP CATEGORIES, USD, NORTH AMERICA, 2017 - 2030
- Figure 148:
- VOLUME SHARE OF SEEDS BY CROP CATEGORIES, %, NORTH AMERICA, 2017 VS 2023 VS 2030
- Figure 149:
- VALUE SHARE OF SEEDS BY CROP CATEGORIES, %, NORTH AMERICA, 2017 VS 2023 VS 2030
- Figure 150:
- VOLUME OF CUCUMBER & GHERKIN SEED, METRIC TON, NORTH AMERICA, 2017 - 2030
- Figure 151:
- VALUE OF CUCUMBER & GHERKIN SEED, USD, NORTH AMERICA, 2017 - 2030
- Figure 152:
- VALUE SHARE OF CUCUMBER & GHERKIN SEED BY BREEDING TECHNOLOGY, %, NORTH AMERICA, 2023 AND 2030
- Figure 153:
- VOLUME OF PUMPKIN & SQUASH SEED, METRIC TON, NORTH AMERICA, 2017 - 2030
- Figure 154:
- VALUE OF PUMPKIN & SQUASH SEED, USD, NORTH AMERICA, 2017 - 2030
- Figure 155:
- VALUE SHARE OF PUMPKIN & SQUASH SEED BY BREEDING TECHNOLOGY, %, NORTH AMERICA, 2023 AND 2030
- Figure 156:
- VOLUME OF OTHER CUCURBITS SEED, METRIC TON, NORTH AMERICA, 2017 - 2030
- Figure 157:
- VALUE OF OTHER CUCURBITS SEED, USD, NORTH AMERICA, 2017 - 2030
- Figure 158:
- VALUE SHARE OF OTHER CUCURBITS SEED BY BREEDING TECHNOLOGY, %, NORTH AMERICA, 2023 AND 2030
- Figure 159:
- VOLUME OF SEEDS BY CROP CATEGORIES, METRIC TON, NORTH AMERICA, 2017 - 2030
- Figure 160:
- VALUE OF SEEDS BY CROP CATEGORIES, USD, NORTH AMERICA, 2017 - 2030
- Figure 161:
- VOLUME SHARE OF SEEDS BY CROP CATEGORIES, %, NORTH AMERICA, 2017 VS 2023 VS 2030
- Figure 162:
- VALUE SHARE OF SEEDS BY CROP CATEGORIES, %, NORTH AMERICA, 2017 VS 2023 VS 2030
- Figure 163:
- VOLUME OF GARLIC SEED, METRIC TON, NORTH AMERICA, 2017 - 2030
- Figure 164:
- VALUE OF GARLIC SEED, USD, NORTH AMERICA, 2017 - 2030
- Figure 165:
- VALUE SHARE OF GARLIC SEED BY BREEDING TECHNOLOGY, %, NORTH AMERICA, 2023 AND 2030
- Figure 166:
- VOLUME OF ONION SEED, METRIC TON, NORTH AMERICA, 2017 - 2030
- Figure 167:
- VALUE OF ONION SEED, USD, NORTH AMERICA, 2017 - 2030
- Figure 168:
- VALUE SHARE OF ONION SEED BY BREEDING TECHNOLOGY, %, NORTH AMERICA, 2023 AND 2030
- Figure 169:
- VOLUME OF POTATO SEED, METRIC TON, NORTH AMERICA, 2017 - 2030
- Figure 170:
- VALUE OF POTATO SEED, USD, NORTH AMERICA, 2017 - 2030
- Figure 171:
- VALUE SHARE OF POTATO SEED BY BREEDING TECHNOLOGY, %, NORTH AMERICA, 2023 AND 2030
- Figure 172:
- VOLUME OF OTHER ROOTS & BULBS SEED, METRIC TON, NORTH AMERICA, 2017 - 2030
- Figure 173:
- VALUE OF OTHER ROOTS & BULBS SEED, USD, NORTH AMERICA, 2017 - 2030
- Figure 174:
- VALUE SHARE OF OTHER ROOTS & BULBS SEED BY BREEDING TECHNOLOGY, %, NORTH AMERICA, 2023 AND 2030
- Figure 175:
- VOLUME OF SEEDS BY CROP CATEGORIES, METRIC TON, NORTH AMERICA, 2017 - 2030
- Figure 176:
- VALUE OF SEEDS BY CROP CATEGORIES, USD, NORTH AMERICA, 2017 - 2030
- Figure 177:
- VOLUME SHARE OF SEEDS BY CROP CATEGORIES, %, NORTH AMERICA, 2017 VS 2023 VS 2030
- Figure 178:
- VALUE SHARE OF SEEDS BY CROP CATEGORIES, %, NORTH AMERICA, 2017 VS 2023 VS 2030
- Figure 179:
- VOLUME OF CHILLI SEED, METRIC TON, NORTH AMERICA, 2017 - 2030
- Figure 180:
- VALUE OF CHILLI SEED, USD, NORTH AMERICA, 2017 - 2030
- Figure 181:
- VALUE SHARE OF CHILLI SEED BY BREEDING TECHNOLOGY, %, NORTH AMERICA, 2023 AND 2030
- Figure 182:
- VOLUME OF EGGPLANT SEED, METRIC TON, NORTH AMERICA, 2017 - 2030
- Figure 183:
- VALUE OF EGGPLANT SEED, USD, NORTH AMERICA, 2017 - 2030
- Figure 184:
- VALUE SHARE OF EGGPLANT SEED BY BREEDING TECHNOLOGY, %, NORTH AMERICA, 2023 AND 2030
- Figure 185:
- VOLUME OF TOMATO SEED, METRIC TON, NORTH AMERICA, 2017 - 2030
- Figure 186:
- VALUE OF TOMATO SEED, USD, NORTH AMERICA, 2017 - 2030
- Figure 187:
- VALUE SHARE OF TOMATO SEED BY BREEDING TECHNOLOGY, %, NORTH AMERICA, 2023 AND 2030
- Figure 188:
- VOLUME OF OTHER SOLANACEAE SEED, METRIC TON, NORTH AMERICA, 2017 - 2030
- Figure 189:
- VALUE OF OTHER SOLANACEAE SEED, USD, NORTH AMERICA, 2017 - 2030
- Figure 190:
- VALUE SHARE OF OTHER SOLANACEAE SEED BY BREEDING TECHNOLOGY, %, NORTH AMERICA, 2023 AND 2030
- Figure 191:
- VOLUME OF SEEDS BY CROP CATEGORIES, METRIC TON, NORTH AMERICA, 2017 - 2030
- Figure 192:
- VALUE OF SEEDS BY CROP CATEGORIES, USD, NORTH AMERICA, 2017 - 2030
- Figure 193:
- VOLUME SHARE OF SEEDS BY CROP CATEGORIES, %, NORTH AMERICA, 2017 VS 2023 VS 2030
- Figure 194:
- VALUE SHARE OF SEEDS BY CROP CATEGORIES, %, NORTH AMERICA, 2017 VS 2023 VS 2030
- Figure 195:
- VOLUME OF ASPARAGUS SEED, METRIC TON, NORTH AMERICA, 2017 - 2030
- Figure 196:
- VALUE OF ASPARAGUS SEED, USD, NORTH AMERICA, 2017 - 2030
- Figure 197:
- VALUE SHARE OF ASPARAGUS SEED BY BREEDING TECHNOLOGY, %, NORTH AMERICA, 2023 AND 2030
- Figure 198:
- VOLUME OF LETTUCE SEED, METRIC TON, NORTH AMERICA, 2017 - 2030
- Figure 199:
- VALUE OF LETTUCE SEED, USD, NORTH AMERICA, 2017 - 2030
- Figure 200:
- VALUE SHARE OF LETTUCE SEED BY BREEDING TECHNOLOGY, %, NORTH AMERICA, 2023 AND 2030
- Figure 201:
- VOLUME OF OKRA SEED, METRIC TON, NORTH AMERICA, 2017 - 2030
- Figure 202:
- VALUE OF OKRA SEED, USD, NORTH AMERICA, 2017 - 2030
- Figure 203:
- VALUE SHARE OF OKRA SEED BY BREEDING TECHNOLOGY, %, NORTH AMERICA, 2023 AND 2030
- Figure 204:
- VOLUME OF PEAS SEED, METRIC TON, NORTH AMERICA, 2017 - 2030
- Figure 205:
- VALUE OF PEAS SEED, USD, NORTH AMERICA, 2017 - 2030
- Figure 206:
- VALUE SHARE OF PEAS SEED BY BREEDING TECHNOLOGY, %, NORTH AMERICA, 2023 AND 2030
- Figure 207:
- VOLUME OF SPINACH SEED, METRIC TON, NORTH AMERICA, 2017 - 2030
- Figure 208:
- VALUE OF SPINACH SEED, USD, NORTH AMERICA, 2017 - 2030
- Figure 209:
- VALUE SHARE OF SPINACH SEED BY BREEDING TECHNOLOGY, %, NORTH AMERICA, 2023 AND 2030
- Figure 210:
- VOLUME OF OTHER UNCLASSIFIED VEGETABLES SEED, METRIC TON, NORTH AMERICA, 2017 - 2030
- Figure 211:
- VALUE OF OTHER UNCLASSIFIED VEGETABLES SEED, USD, NORTH AMERICA, 2017 - 2030
- Figure 212:
- VALUE SHARE OF OTHER UNCLASSIFIED VEGETABLES SEED BY BREEDING TECHNOLOGY, %, NORTH AMERICA, 2023 AND 2030
- Figure 213:
- VOLUME OF SEEDS BY COUNTRY, METRIC TON, NORTH AMERICA, 2017 - 2030
- Figure 214:
- VALUE OF SEEDS BY COUNTRY, USD, NORTH AMERICA, 2017 - 2030
- Figure 215:
- VOLUME SHARE OF SEEDS BY COUNTRY, %, NORTH AMERICA, 2017 VS 2023 VS 2030
- Figure 216:
- VALUE SHARE OF SEEDS BY COUNTRY, %, NORTH AMERICA, 2017 VS 2023 VS 2030
- Figure 217:
- VOLUME OF CANADA SEEDS, METRIC TON, NORTH AMERICA, 2017 - 2030
- Figure 218:
- VALUE OF CANADA SEEDS, USD, NORTH AMERICA, 2017 - 2030
- Figure 219:
- VALUE SHARE OF CANADA SEEDS BY CROP, %, NORTH AMERICA, 2023 AND 2030
- Figure 220:
- VOLUME OF MEXICO SEEDS, METRIC TON, NORTH AMERICA, 2017 - 2030
- Figure 221:
- VALUE OF MEXICO SEEDS, USD, NORTH AMERICA, 2017 - 2030
- Figure 222:
- VALUE SHARE OF MEXICO SEEDS BY CROP, %, NORTH AMERICA, 2023 AND 2030
- Figure 223:
- VOLUME OF UNITED STATES SEEDS, METRIC TON, NORTH AMERICA, 2017 - 2030
- Figure 224:
- VALUE OF UNITED STATES SEEDS, USD, NORTH AMERICA, 2017 - 2030
- Figure 225:
- VALUE SHARE OF UNITED STATES SEEDS BY CROP, %, NORTH AMERICA, 2023 AND 2030
- Figure 226:
- VOLUME OF REST OF NORTH AMERICA SEEDS, METRIC TON, NORTH AMERICA, 2017 - 2030
- Figure 227:
- VALUE OF REST OF NORTH AMERICA SEEDS, USD, NORTH AMERICA, 2017 - 2030
- Figure 228:
- VALUE SHARE OF REST OF NORTH AMERICA SEEDS BY CROP, %, NORTH AMERICA, 2023 AND 2030
- Figure 229:
- MOST ACTIVE COMPANIES BY NUMBER OF STRATEGIC MOVES, COUNT, NORTH AMERICA, 2017-2023
- Figure 230:
- MOST ADOPTED STRATEGIES, COUNT, NORTH AMERICA, 2017-2023
- Figure 231:
- VALUE SHARE OF MAJOR PLAYERS, %, NORTH AMERICA
North America Seed Industry Segmentation
Hybrids, Open Pollinated Varieties & Hybrid Derivatives are covered as segments by Breeding Technology. Open Field, Protected Cultivation are covered as segments by Cultivation Mechanism. Row Crops, Vegetables are covered as segments by Crop Type. Canada, Mexico, United States are covered as segments by Country.| Breeding Technology | Hybrids | Non-Transgenic Hybrids | ||
| Transgenic Hybrids | Herbicide Tolerant Hybrids | |||
| Insect Resistant Hybrids | ||||
| Other Traits | ||||
| Open Pollinated Varieties & Hybrid Derivatives | ||||
| Cultivation Mechanism | Open Field | |||
| Protected Cultivation | ||||
| Crop Type | Row Crops | Fiber Crops | Cotton | |
| Other Fiber Crops | ||||
| Forage Crops | Alfalfa | |||
| Forage Corn | ||||
| Forage Sorghum | ||||
| Other Forage Crops | ||||
| Grains & Cereals | Corn | |||
| Rice | ||||
| Sorghum | ||||
| Wheat | ||||
| Other Grains & Cereals | ||||
| Oilseeds | Canola, Rapeseed & Mustard | |||
| Soybean | ||||
| Sunflower | ||||
| Other Oilseeds | ||||
| Pulses | Pulses | |||
| Vegetables | Brassicas | Cabbage | ||
| Carrot | ||||
| Cauliflower & Broccoli | ||||
| Other Brassicas | ||||
| Cucurbits | Cucumber & Gherkin | |||
| Pumpkin & Squash | ||||
| Other Cucurbits | ||||
| Roots & Bulbs | Garlic | |||
| Onion | ||||
| Potato | ||||
| Other Roots & Bulbs | ||||
| Solanaceae | Chilli | |||
| Eggplant | ||||
| Tomato | ||||
| Other Solanaceae | ||||
| Unclassified Vegetables | Asparagus | |||
| Lettuce | ||||
| Okra | ||||
| Peas | ||||
| Spinach | ||||
| Other Unclassified Vegetables | ||||
| Country | Canada | |||
| Mexico | ||||
| United States | ||||
| Rest of North America | ||||
Need A Different Region or Segment?
Customize Now
Market Definition
- Commercial Seed - For the purpose of this study, only commercial seeds have been included as part of the scope. Farm-saved Seeds, which are not commercially labeled are excluded from scope, even though a minor percentage of farm-saved seeds are exchanged commercially among farmers. The scope also excludes vegetatively reproduced crops and plant parts, which may be commercially sold in the market.
- Crop Acreage - While calculating the acreage under different crops, the Gross Cropped Area has been considered. Also known as Area Harvested, according to the Food & Agricultural Organization (FAO), this includes the total area cultivated under a particular crop across seasons.
- Seed Replacement Rate - Seed Replacement Rate is the percentage of area sown out of the total area of crop planted in the season by using certified/quality seeds other than the farm-saved seed.
- Protected Cultivation - The report defines protected cultivation as the process of growing crops in a controlled environment. This includes greenhouses, glasshouses, hydroponics, aeroponics, or any other cultivation system that protects the crop against any abiotic stress. However, cultivation in an open field using plastic mulch is excluded from this definition and is included under open field.
| Keyword | Definition |
|---|---|
| Row Crops | These are usually the field crops which include the different crop categories like grains & cereals, oilseeds, fiber crops like cotton, pulses, and forage crops. |
| Solanaceae | These are the family of flowering plants which includes tomato, chili, eggplants, and other crops. |
| Cucurbits | It represents a gourd family consisting of about 965 species in around 95 genera. The major crops considered for this study include Cucumber & Gherkin, Pumpkin and squash, and other crops. |
| Brassicas | It is a genus of plants in the cabbage and mustard family. It includes crops such as carrots, cabbage, cauliflower & broccoli. |
| Roots & Bulbs | The roots and bulbs segment includes onion, garlic, potato, and other crops. |
| Unclassified Vegetables | This segment in the report includes the crops which don’t belong to any of the above-mentioned categories. These include crops such as okra, asparagus, lettuce, peas, spinach, and others. |
| Hybrid Seed | It is the first generation of the seed produced by controlling cross-pollination and by combining two or more varieties, or species. |
| Transgenic Seed | It is a seed that is genetically modified to contain certain desirable input and/or output traits. |
| Non-Transgenic Seed | The seed produced through cross-pollination without any genetic modification. |
| Open-Pollinated Varieties & Hybrid Derivatives | Open-pollinated varieties produce seeds true to type as they cross-pollinate only with other plants of the same variety. |
| Other Solanaceae | The crops considered under other Solanaceae include bell peppers and other different peppers based on the locality of the respective countries. |
| Other Brassicaceae | The crops considered under other brassicas include radishes, turnips, Brussels sprouts, and kale. |
| Other Roots & Bulbs | The crops considered under other roots & bulbs include Sweet Potatoes and cassava. |
| Other Cucurbits | The crops considered under other cucurbits include gourds (bottle gourd, bitter gourd, ridge gourd, Snake gourd, and others). |
| Other Grains & Cereals | The crops considered under other grains & cereals include Barley, Buck Wheat, Canary Seed, Triticale, Oats, Millets, and Rye. |
| Other Fibre Crops | The crops considered under other fibers include Hemp, Jute, Agave fibers, Flax, Kenaf, Ramie, Abaca, Sisal, and Kapok. |
| Other Oilseeds | The crops considered under other oilseeds include Ground nut, Hempseed, Mustard seed, Castor seeds, safflower seeds, Sesame seeds, and Linseeds. |
| Other Forage Crops | The crops considered under other forages include Napier grass, Oat grass, White clover, Ryegrass, and Timothy. Other forage crops were considered based on the locality of the respective countries. |
| Pulses | Pigeon peas, Lentils, Broad and horse beans, Vetches, Chickpeas, Cowpeas, Lupins, and Bambara beans are the crops considered under pulses. |
| Other Unclassified Vegetables | The crops considered under other unclassified vegetables include Artichokes, Cassava Leaves, Leeks, Chicory, and String beans. |
Need More Details on Market Definition?
Ask a Question
Research Methodology
Mordor Intelligence follows a four-step methodology in all our reports.
- Step-1: IDENTIFY KEY VARIABLES: In order to build a robust forecasting methodology, the variables and factors identified in Step-1 are tested against available historical market numbers. Through an iterative process, the variables required for market forecast are set and the model is built on the basis of these variables.
- Step-2: Build a Market Model: Market-size estimations for the forecast years are in nominal terms. Inflation is not a part of the pricing, and the average selling price (ASP) is kept constant throughout the forecast period.
- Step-3: Validate and Finalize: In this important step, all market numbers, variables and analyst calls are validated through an extensive network of primary research experts from the market studied. The respondents are selected across levels and functions to generate a holistic picture of the market studied.
- Step-4: Research Outputs: Syndicated Reports, Custom Consulting Assignments, Databases, and Subscription Platforms

Get More Details On Research Methodology
Download PDF


