
Market Overview
| Study Period | 2021 - 2031 |
|---|---|
| Forecast Data Period | 2026 - 2031 |
| Base Year Market Size (2025) | USD 1.53 Billion |
| Market Size (2026) | USD 2.16 Billion |
| Market Size (2031) | USD 12.07 Billion |
| Growth Rate (2026 - 2031) | 41.08 % |
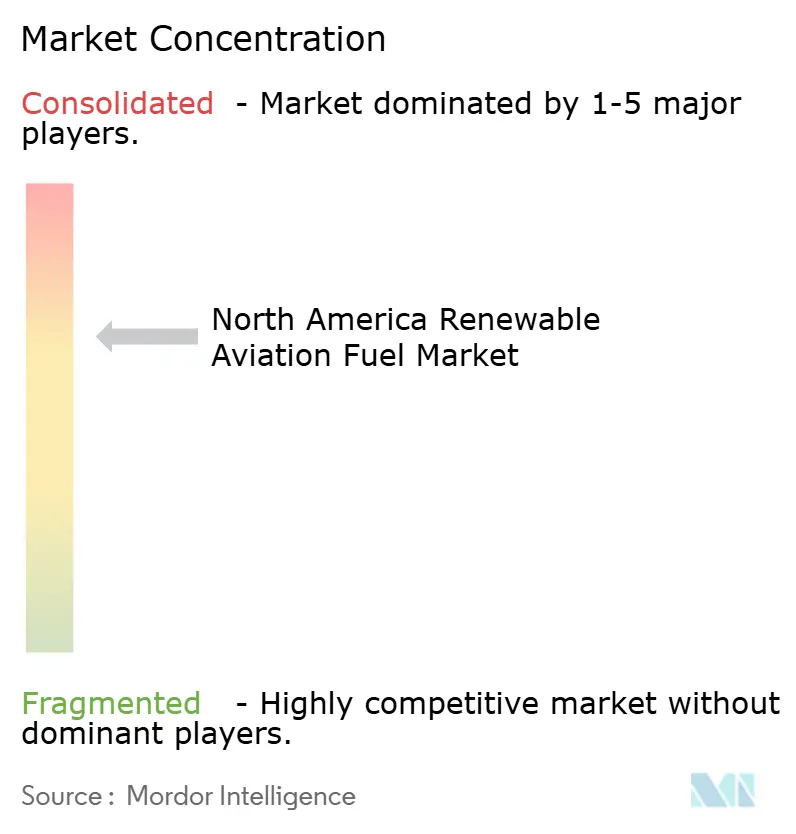
| Market Concentration | Medium |
Major Players *Disclaimer: Major Players sorted in no particular order Image © Mordor Intelligence. Reuse requires attribution under CC BY 4.0. | |
North America Renewable Aviation Fuel Market Analysis by Mordor Intelligence
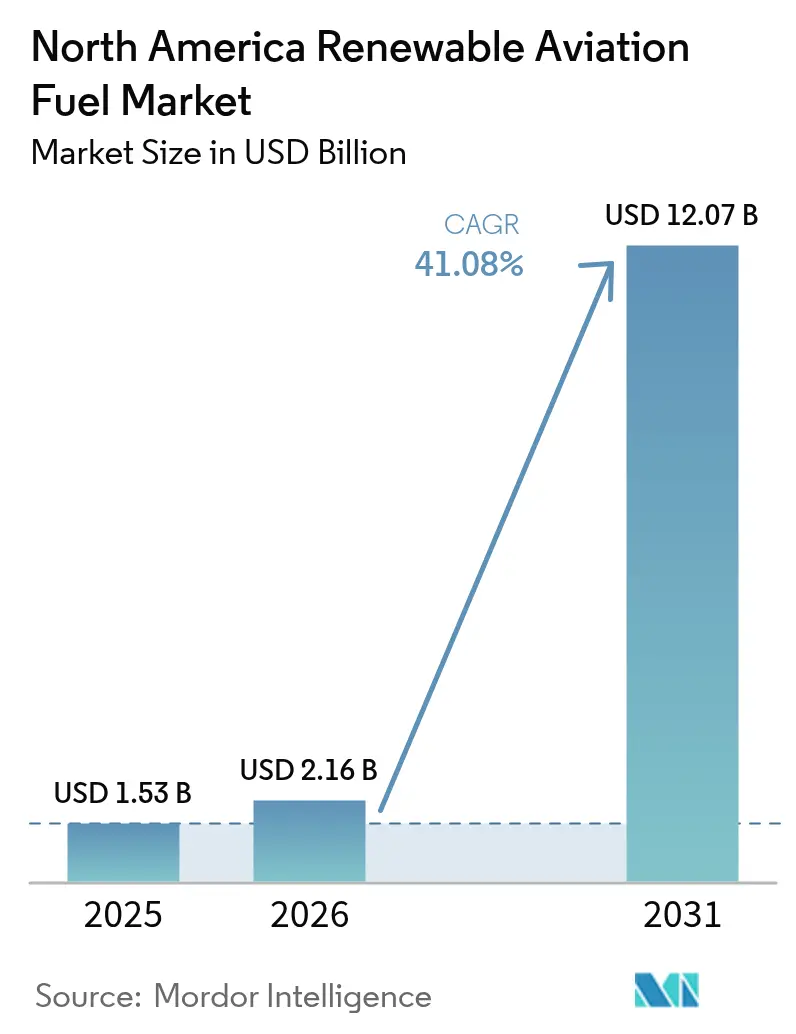
North America Renewable Aviation Fuel Market size in 2026 is estimated at USD 2.16 billion, growing from 2025 value of USD 1.53 billion with 2031 projections showing USD 12.07 billion, growing at 41.08% CAGR over 2026-2031.
Policy-driven production incentives, binding airline sustainability mandates, and rapid scale-up of conversion technologies converge to narrow the price gap between sustainable aviation fuel (SAF) and conventional Jet A. Section 40B SAF Blenders Tax Credits of up to USD 1.75 per gallon now cover a significant share of production costs, tilting the investment calculus toward large-scale projects. Airlines have signed long-term offtake agreements exceeding 200 million gallons, a signal that demand visibility has reached the threshold needed for debt financing. Technology innovation reinforces the growth trajectory: HEFA remains the dominant commercial pathway, yet alcohol-to-jet (ATJ) platforms show the fastest expansion as ethanol feedstock becomes abundant, and as lifecycle emissions scoring shifts credit values in their favor. The competitive environment favors vertically integrated players that control feedstock aggregation, conversion capacity, and distribution, providing insulation against price spikes in used cooking oil and animal fats.
Key Report Takeaways
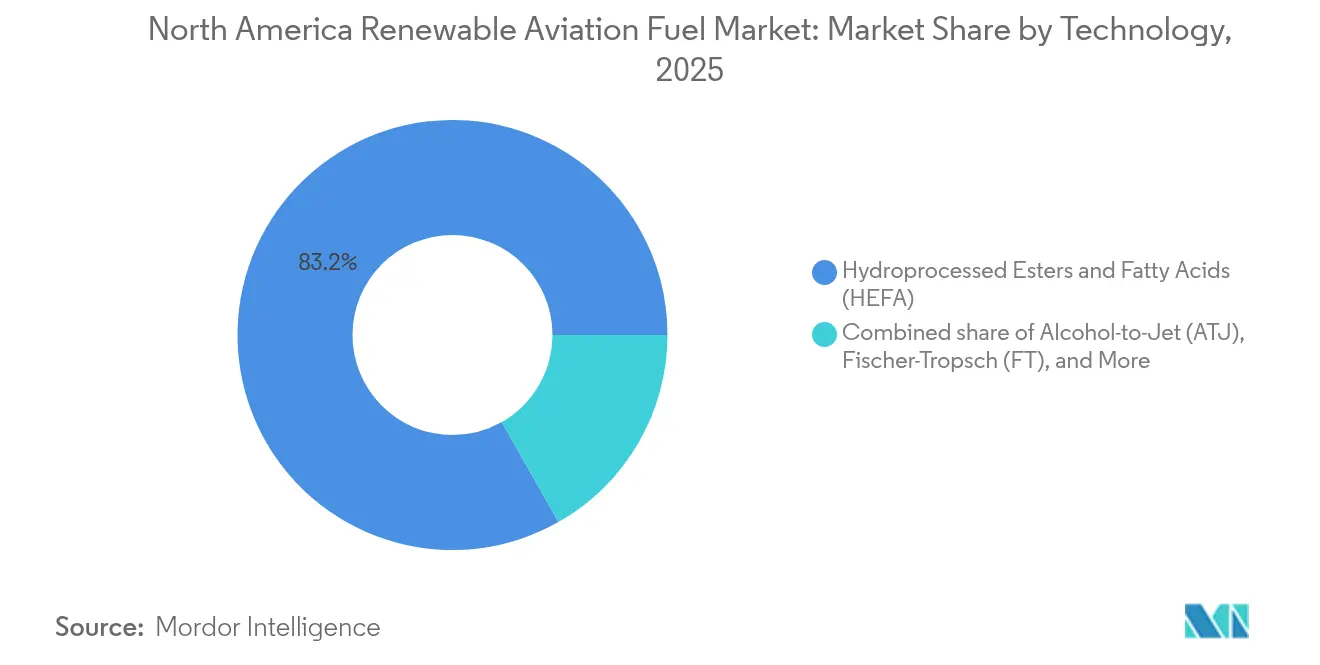
- By technology, HEFA commanded 83.20% revenue share in 2025; alcohol-to-jet is projected to advance at a 45.89% CAGR through 2031.
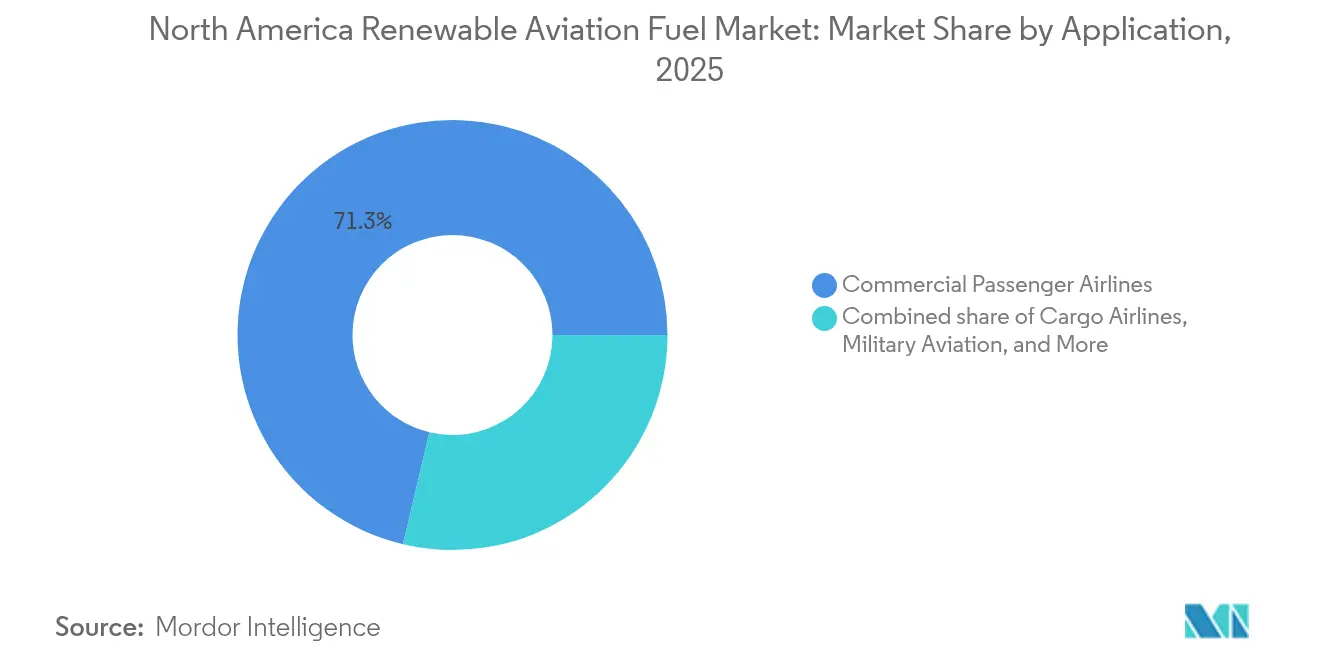
- By application, commercial passenger airlines held 71.30% of the North America renewable aviation fuel market share in 2025, while cargo aviation is forecast to expand at a 44.23% CAGR to 2031.
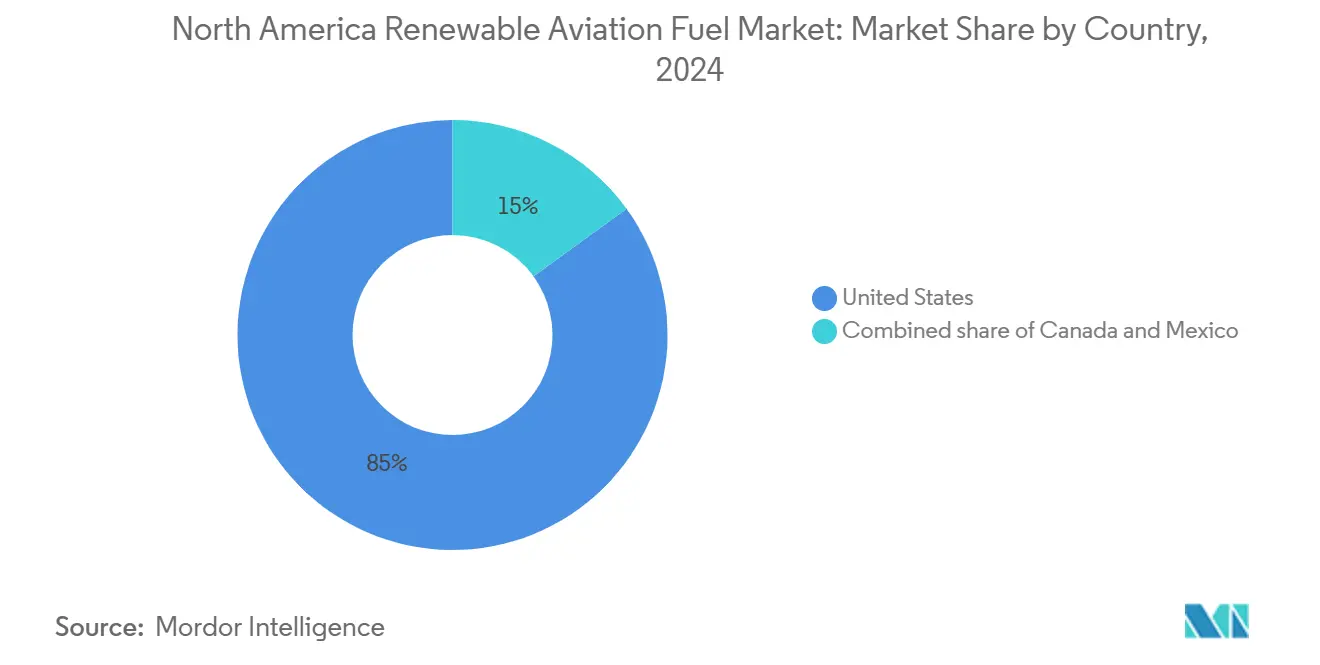
- By country, the United States captured an 84.40% share of the North America renewable aviation fuel market size in 2025 and is anticipated to climb at a 48.64% CAGR through 2031.
Note: Market size and forecast figures in this report are generated using Mordor Intelligence’s proprietary estimation framework, updated with the latest available data and insights as of 2026.
Market Trends and Insights
Drivers Impact Analysis of North America Renewable Aviation Fuel Market*
| Driver | (~) % Impact on CAGR Forecast | Geographic Relevance | Impact Timeline |
|---|---|---|---|
| SAF tax-credits under the U.S. Inflation Reduction Act | 8.50% | United States, spillover to Canada and Mexico | Short term (≤ 2 years) |
| Net-zero pledges signed by >90% of North-American airline capacity | 6.20% | North America | Medium term (2-4 years) |
| Rising corporate "green travel" procurement programs | 4.80% | United States and Canada, emerging in Mexico | Medium term (2-4 years) |
| Emerging carbon-negative alcohol-to-jet (ATJ) pathways | 3.10% | United States, early adoption in Canada | Long term (≥ 4 years) |
| Regional airport consortia financing on-site SAF blenders | 2.70% | United States, pilot programs in Canada | Long term (≥ 4 years) |
| Source: Mordor Intelligence | |||
SAF Tax-Credits Under the U.S. Inflation Reduction Act
The Inflation Reduction Act offers up to USD 1.75 per gallon for SAF achieving at least 50% lifecycle greenhouse-gas savings, a step that compresses the cost delta with fossil jet fuel and sets an economic foundation for multi-hundred-million-gallon projects. Lifecycle intensity rules tilt the advantage toward ATJ and Fischer-Tropsch designs that can meet deeper carbon cuts, hastening technology diversification across the North America renewable aviation fuel market. The shift in 2025 to Section 45Z credits layers fresh incentives for agricultural feedstock suppliers, potentially lowering ethanol input cost curves. Obligatory carbon accounting and verification increase administrative complexity, a hurdle more readily cleared by large, integrated producers. Still, the headline tax credit catalyzes offtake deals that transform airline demand into bankable cash flows, supporting the forecast 42.5% CAGR.
Net-Zero Pledges Signed by Above 90% of North-American Airline Capacity
Airlines representing over 90% of passenger capacity have committed to achieving net-zero by 2050, with interim targets that call for 10-30% SAF usage by 2030.[1] Delta alone has secured purchase agreements covering 200 million gallons, while United targets a 10% SAF blend within five years, thereby anchoring long-range demand curves. Military interest intensifies the pull: Lockheed Martin has cleared synthetic fuels for the F-35, F-16, and C-130 fleets, opening another sizable market segment. Binding pledges alter bargaining power, encouraging airlines to negotiate early, sometimes equity-linked, positions in upcoming facilities. The resulting demand certainty lifts lender confidence, accelerating project financial close across the North America renewable aviation fuel market.
Rising Corporate “Green Travel” Procurement Programs
Large enterprises embed Scope 3 emissions criteria into travel procurement, compelling airlines to verify SAF usage or deliver book-and-claim certificates. Neste’s “Neste Impact” service enables companies to purchase SAF attributes and report reductions in line with the Science Based Targets Initiative protocols.[2] The mechanism uncouples physical delivery from environmental claims, enlarging the customer base beyond airline operators. Premium pricing narrows uptake to corporations with robust ESG budgets, yet it still enlarges the addressable pool of committed SAF buyers, indirectly boosting forward-contracted volumes that underpin plant financing.
Emerging Carbon-Negative Alcohol-to-Jet Pathways
LanzaTech and LanzaJet’s CirculAir process converts waste carbon streams into ethanol, which is then upgraded to jet fuel, resulting in lifecycle reductions exceeding 85% compared to petroleum kerosene. Freedom Pines, the USD 200 million Georgia facility, demonstrates an annual output of 10 million gallons and validates bankability for ATJ at scale. Feedstock flexibility, spanning municipal waste to industrial CO₂, tackles constraints that beset HEFA projects and qualifies for the highest Section 40B and 45Z incentives. Carbon-negative metrics unlock additional revenue through voluntary carbon markets, strengthening cash flow resilience during feedstock price swings in the North American renewable aviation fuel market.
Restraints Impact Analysis of North America Renewable Aviation Fuel Market*
| Restraint | (~) % Impact on CAGR Forecast | Geographic Relevance | Impact Timeline |
|---|---|---|---|
| Feedstock aggregation bottlenecks in the U.S. Midwest | -3.20% | United States Midwest, affecting national supply | Short term (≤ 2 years) |
| HEFA feedstock price volatility linked to renewable diesel build-out | -2.80% | North America, particularly United States | Medium term (2-4 years) |
| Lack of ASTM approval for 100% drop-in SAF use | -1.90% | North America, global implications | Long term (≥ 4 years) |
| Source: Mordor Intelligence | |||
Feedstock Aggregation Bottlenecks in the U.S. Midwest
Corn-ethanol plants operate at scales smaller than the 100-million-gallon conversion units optimal for ATJ, resulting in complex aggregation networks that increase logistics costs. Ethanol already competes with gasoline in the market, so SAF projects must compete on price, potentially introducing volatility into supply contracts. Storage and pipeline capacity in the region remain limited, resulting in additional freight expenses for coastal refineries. Co-location strategies, such as SAFFiRE’s corn-stover-to-ethanol pairing with LanzaJet technology, partially mitigate the challenge but require synchronized capital deployment. Until bottlenecks ease, the North America renewable aviation fuel market faces supply-side friction that tempers near-term growth.
HEFA Feedstock Price Volatility Linked to Renewable Diesel Build-Out
The rapid expansion of renewable diesel refineries drives demand for used cooking oil and animal fats, thereby elevating prices and squeezing margins for HEFA SAF producers.[3] Road-fuel incentives often outbid aviation buyers, diverting feedstocks and occasionally idling SAF units. The geographic concentration of these fats in agricultural zones adds freight overhead for coastal airports. Integrated producers hedge by securing long-term supply contracts or by co-processing in existing hydrotreater assets, but smaller entrants without similar hedges face margin compression during price spikes.
*Our forecasts treat driver/restraint impacts as directional, not additive. The impact forecasts reflect baseline growth, mix effects, and variable interactions.
North America Renewable Aviation Fuel Market Segment Analysis
By Technology:
HEFA Dominance Faces ATJ DisruptionHEFA commanded 83.20% of the North America renewable aviation fuel market share in 2025, a testament to its commercial readiness, existing hydroprocessing infrastructure, and established logistics chains. Capital requirements remain modest because facilities retrofit legacy diesel hydrotreaters, enabling projects to achieve investment-grade status faster than greenfield designs. However, feedstock scarcity and rising competition from renewable diesel refineries curb long-term scalability.
Alcohol-to-jet pathways, although nascent, are projected to post a 45.89% CAGR through 2031, the fastest in the technology stack. LanzaJet’s Freedom Pines plant validates the route’s commercial viability, while CirculAir’s waste-carbon fermentation breaks the dependence on agricultural oils, an advantage that resonates with investors seeking long-lived assets. The high tax-credit uplift for deep-carbon-cut fuels amplifies project IRRs, further shifting capital allocation toward ATJ. Fischer-Tropsch routes remain in the demonstration phase due to high capital expenditures, yet they hold promise for forestry-rich regions like British Columbia. Catalytic Hydrothermolysis Jet and Hydrothermal Liquefaction remain in pilot stages but could advance if lifecycle scores meet the upper tiers of Section 45Z thresholds within the North American renewable aviation fuel market.

By Application:
Commercial Aviation Leads, Cargo AcceleratesCommercial passenger airlines accounted for 71.30% of total SAF volumes in 2025, reflecting their large fleet sizes and visible public sustainability commitments. They typically secure multi-year offtake agreements with volume escrows, swapping price certainty for supply priority. Cargo aviation, propelled by e-commerce and corporate logistics clients that demand carbon accountability, accelerates at a 44.23% CAGR to 2031. FedEx and UPS both pilot SAF at hub airports, signaling a sustained shift in procurement policy.
Military interest broadens the addressable pool. Approval for synthetic fuels in F-35, F-16, and C-130 platforms underscores the fuel’s performance under high-stress conditions, giving producers a stable offtake channel that is less price-sensitive and more security-oriented. Business aviation uptake remains limited by supply constraints at regional fixed-base operators and price premiums; however, the National Business Aviation Association documents expanding airport availability, suggesting a gradual improvement. Each application segment carries distinct demand elasticity, shaping supply contracts and influencing infrastructure build-out within the North America renewable aviation fuel market.
Geography Analysis
United States Renewable Aviation Fuel Market
The United States occupies the center of gravity for production, policy, and demand. Section 40B credits, USD 291 million FAST grants, and the California LCFS jointly reduce risk for project sponsors, drawing a pipeline of >30 new plants that could push annual capacity to 3 billion gallons by 2030. Regional airport hubs, such as Delta’s Los Angeles SAF blending tank farm, reinforce local demand and shorten supply chains. State incentives add incremental margin cushions and encourage the development of distributed facilities near feedstock pools, thereby improving logistics efficiency.
Canada Renewable Aviation Fuel Market
Canada’s Clean Fuel Regulations mandate escalating carbon intensity reductions, pressuring carriers and fueling import demand until domestic plants come online. Air Canada’s multi-year SAF deals illustrate the policy-driven ramp-up in procurement. British Columbia’s forest waste could anchor Fischer-Tropsch deployments, complementing ethanol-rich Midwest flows into Ontario and Quebec.
Mexico and United States Renewable Aviation Fuel Market
Mexico’s policy framework remains formative, yet US-Mexican supply-chain integration discussions point to eventual ethanol and lipid exports that feed Gulf-Coast refineries targeting the North America renewable aviation fuel market. Infrastructure financing remains a bottleneck because Mexican airports lack blending and storage facilities, but joint-venture models under consideration mirror those already operational in the United States. Over the forecast horizon, geographic expansion hinges on policy harmonization, feedstock logistics, and cross-border capital flows that facilitate the distribution of production closer to regional demand nodes.
Regulatory Landscape
In the United States, federal policy continues to anchor SAF economics through lifecycle-based incentives and renewable fuel compliance. The Inflation Reduction Act provisions referenced in the report, including the Section 40B SAF blender credit of up to USD 1.75 per gallon for fuels meeting at least 50% lifecycle GHG reduction thresholds, reinforce the role of carbon-intensity scoring and verification in qualifying volumes. In March 2026, the U.S. Environmental Protection Agency finalized the Renewable Fuel Standard (RFS) Set 2 rule for 2026 and 2027 volume requirements across cellulosic biofuel, biomass-based diesel, advanced biofuel, and total renewable fuel. The update adds a fresh compliance anchor for renewable fuel producers while tightening the definition of qualifying program pathways, including removal of renewable electricity eRINs as a qualifying fuel effective 2026.
In Canada, Environment and Climate Change Canada administers the Clean Fuel Regulations (CFR), which require regulated parties to reduce the carbon intensity of gasoline and diesel over time, targeting a 15% reduction from 2016 levels by 2030. Compliance is handled through a credit market where obligated parties create or buy credits, keeping lifecycle emissions accounting central to investment decisions. This framework shapes how producers weigh serving aviation through physical SAF supply, attribute-based approaches, or credit generation strategies tied to lower-carbon fuel production and distribution.
Competitive Landscape
Roughly 190 companies have announced SAF projects across 330 global sites, but only 18 are operating at a commercial scale, underscoring a fragmented, early-stage competitive landscape. Integrated majors such as Neste, TotalEnergies, and World Energy leverage proprietary refining assets, locked-in feedstock contracts, and direct airline partnerships to secure first-mover scale. Neste supplies carriers in San Francisco and Los Angeles, wielding book-and-claim platforms that expand its revenue base. TotalEnergies collaborates with Airbus to meet over half of the OEM’s European fuel needs, illustrating strategic alignment between airframe manufacturers and fuel suppliers.
Emerging pure-plays LanzaJet and Gevo differentiate through technology—ATJ and catalytic fermentation—targeting the tax-credit premiums accorded to deep-carbon-cut fuels. Freedom Pines validates ATJ’s bankability, while Gevo’s Net-Zero 1 project bundles power-to-x upgrades aimed at carbon-negative scores. Venture capital and airline equity appear in most new builds, a pattern demonstrated by Southwest’s USD 30 million investment in LanzaJet to secure future supply. Upstream, oilseed processors and rendering firms secure long-term offtake deals, seeking to arbitrage feedstock scarcity into negotiated pricing floors. Downstream, airports finance on-site blending modules, attracting smaller carriers that would otherwise lack access. Competitive positioning, therefore, depends on vertical integration that secures feedstock, tax-credit eligibility, and captive offtake, creating high entry barriers even in a market that outwardly appears fragmented.
North America Renewable Aviation Fuel Industry Leaders
-
Neste Oyj
-
World Energy LLC
-
TotalEnergies SA
-
Honeywell UOP (licensee capacity)
-
Gevo Inc.
- *Disclaimer: Major Players sorted in no particular order
North America Renewable Aviation Fuel Market Companies Covered in this Report
- Neste Oyj
- TotalEnergies SA
- World Energy LLC
- Honeywell UOP
- Gevo Inc.
- Fulcrum BioEnergy Inc.
- LanzaTech Global Inc.
- Alder Fuels
- Aemetis Inc.
- SG Preston Company
- Red Rock Biofuels LLC
- Velocys plc
- Marathon-Neste JV (Diamond Green Diesel)
- BP p.l.c.
- Shell plc (Shell Aviation)
- Praj Industries
- Virent Inc.
- SkyNRG Americas
- Boeing (SAF partnerships)
- Carbon Engineering Ltd.
Read Analysis of North America Renewable Aviation Fuel Companies
Market Opportunities and Future Outlook
Near-term whitespace sits at the infrastructure and monetization layer between production and aircraft fueling, where policy is creating targeted channels for airports and airlines to standardize access. The U.S. Consolidated Appropriations Act 2024 (P.L. 118-42) authorizes the Secretary of Transportation to award discretionary grants to airports for SAF fueling infrastructure, aligning with the report theme that airport consortia and hubs can finance on-site blending and storage to expand availability beyond a handful of large gateways. On the demand side, corporate book-and-claim programs already operate at scale in the region (for example, Neste Impact), which expands the buyer universe beyond airlines and supports contracted volumes when physical delivery is constrained.
A practical production opportunity is debottlenecking and repurposing existing renewable diesel and hydrotreater assets into SAF-capable configurations. This lowers greenfield capital intensity and can accelerate incremental volumes when incentives support broader spread versus road fuels. Evidence of this pathway appears through Montana Renewables (Calumet), which moved its MaxSAF 150 expansion into operation at Great Falls, Montana in 2026, lifting annual SAF capacity into the 120-150 million gallon range. A second opportunity is diversification beyond lipid-based HEFA into feedstock-flexible synthetic routes, supported by named project actions in Canada, such as SUSTAERO selecting Topsoe and Sasol as technology providers for a wood-waste-to-SAF project planned at 3,200 barrels per day, along with early-stage synthetic SAF models tied to low-carbon hydrogen in Quebec. Policy breadth is also widening, with the U.S. Farm, Food, and National Security Act of 2026 (H.R. 7567) passing the House in April 2026 and integrating SAF into federal agricultural biofuels policy for the first time, strengthening alignment between farm-side feedstocks and aviation fuel decarbonization goals.
Recent Industry Developments in North America Renewable Aviation Fuel Market
- July 2026: SUSTAERO selected Topsoe and Sasol as technology providers for a wood-waste-to-SAF project in Canada, with a planned capacity of 3,200 barrels per day. The selection signals continued movement toward non-lipid pathways that reduce exposure to used cooking oil and tallow price volatility. It also reinforces the role of established technology licensors in shaping project bankability for Canadian SAF builds.
- May 2026: Montana Renewables (Calumet) commenced operations of the MaxSAF 150 expansion at its Great Falls, Montana, refinery, increasing annual SAF capacity to about 120-150 million gallons. Bringing incremental capacity online at an existing site highlights the advantage of retrofit and debottlenecking approaches versus greenfield builds. The step-up adds nearer-term supply into airline and airport procurement channels that are increasingly structured around long-term offtakes.
- December 2024: Air France-KLM invested USD 4.7 million in DG Fuels for a Louisiana facility, securing purchase rights to 75,000 tons per year starting in 2029. The investment reflects airline strategies that combine capital support with future volume access to manage SAF scarcity. It also reinforces developer emphasis on pre-committed demand as a prerequisite for financing large-scale projects.
North America Renewable Aviation Fuel Market Report Scope and Research Methodology
Market Definition and Coverage
This market covers revenue generated from renewable aviation fuel supplied for aviation use across North America, where renewable components are blended into conventional jet fuel and sold through standard aviation fuel channels.
Scope exclusions: We exclude conventional jet fuel volumes sold without a renewable component and any unrelated renewable diesel or marine fuel volumes.
Segments Covered in This Report
- By Technology
- Fischer-Tropsch (FT)
- Hydroprocessed Esters & Fatty Acids (HEFA)
- Alcohol-to-Jet (ATJ)
- Synthesized Iso-Paraffinic (SIP)
- Catalytic Hydrothermolysis Jet (CHJ)
- Hydrothermal Liquefaction (HTL)
- By Application
- Commercial Passenger Airlines
- Cargo Airlines
- Military Aviation
- Business & General Aviation
- By Country
- United States
- Canada
- Mexico
Data Sources, Market Sizing, and Validation
Desk Research
Desk research establishes the factual baseline on aviation activity, policy timing, and fuel specifications before we size revenues. We reviewed public releases and datasets such as the US Energy Information Administration, US Environmental Protection Agency renewable fuel program documents, ICAO and IATA statistics, and government publications from agencies such as the US Department of Transportation and Natural Resources Canada.
To ground assumptions, we also used company filings and investor presentations, airport and airline sustainability disclosures, and association updates on SAF pathways and certification. In some cases, we referenced paid subscriptions for company financials and intelligence, plus patent databases, to cross-check capacity announcements, technology focus, and commercialization timelines. The desk sources listed here are illustrative, and we used other public documents for data collection, validation, and clarification.
Primary Interviews and Surveys
Primary work was used to confirm what is actually being produced, blended, and delivered into aviation fueling systems, and how contracts and premiums are being set in practice. We spoke with refiners and fuel suppliers, airlines and airport fuel teams, and industry experts across the United States, Canada, and Mexico to validate adoption pace, blending realities, and near-term constraints.
Inputs from these discussions were used to stress-test desk assumptions, resolve gaps where public data is lagging, and align the final model to observed supply and demand signals.
Distribution of primary research fieldwork respondents
| Company type | Respondent position |
|---|---|
| Top tier: 35% | CXOs: 13% |
| Mid tier: 48% | Functional/Unit leaders: 29% |
| Smaller Players: 17% | Managers: 58% |
Market-Sizing & Forecasting
Sizing starts with a top-down build that reconstructs the revenue pool from North America renewable aviation fuel supply and use, and then links it back to aviation demand signals. We map likely volumes by country using operating flights, jet fuel consumption indicators, announced SAF supply, and known blending limits, which are then converted to value using average selling prices that reflect observed SAF premiums and feedstock-linked cost movements.
To keep the totals realistic, we run selective bottom-up checks using supplier capacity additions, commissioning timelines, and sampled contract price ranges discussed in interviews. Key inputs that guide the model include ASTM pathway readiness (what can be sold as drop-in fuel), the pace of new plant start-ups and ramp-ups, airline offtake coverage, policy credit timing that influences netback pricing, and jet fuel price direction that shifts blending economics.
For forecasting, we use scenario analysis so adoption can flex with policy enforcement, capacity ramp delays, and premium normalization. Where company or plant level data is incomplete, we fill gaps with conservative ramp curves and then re-test totals against flight activity and announced supply to avoid overstating early years.
Data Validation & Update Cycle
Validation is performed through multiple checks so the final value is not driven by a single assumption. We compare modeled revenues against independent signals such as announced SAF capacity, flight activity trends, and public policy timelines, and we investigate sharp jumps that do not match these external markers.
Before sign-off, outputs go through a multi-step internal review where assumptions are challenged and recalculated if needed, and follow-up calls are triggered when interview feedback diverges from desk inputs. Reports are refreshed annually, with interim updates when material events occur, including major policy changes, new capacity start-ups, or large shifts in jet fuel pricing. Right before delivery, an analyst completes a fresh review pass so clients receive the latest updated view.
Mordor Intelligence's North America Renewable Aviation Fuel Market Estimate Compared With Other Published Estimates
It is common to see different market sizes for renewable aviation fuel because each publisher chooses its own boundaries and timing for prices and volumes. In this market, the biggest drivers tend to be whether the estimate counts only aviation-grade drop-in volumes, how blending is treated, and whether pricing uses spot indicators or contract-like premiums.
A refresh-led gap is also visible when price assumptions are not updated with the same currency timing across years, which can move the revenue total even if gallons do not change much. By keeping average selling prices tied to recent fuel price movements and re-checking the model when new capacity or policy signals change, Mordor Intelligence reduces swings caused by stale premiums or one-time announcements.
Benchmark comparison
| Source | Market Size | Gaps in Research Methodology |
|---|---|---|
| Mordor Intelligence | USD 1.53 B (2025) | |
| Trade Journal A | USD 2.95 B (2025) | Often uses a broader SAF definition that can include additional categories and may apply aggressive premium assumptions that do not reflect blended delivery constraints across countries. |
| Industry Report B | USD 0.84 B (2024) | May anchor the value to early-stage delivered volumes only and apply conservative pricing, which can undercount contracted supply that is ramping but not yet fully reflected in public datasets. |
The spread mostly comes down to scope and timing choices rather than simple math errors. When volumes are limited by certification and blending realities, and when prices are updated consistently to the same year basis, the market total becomes easier to trace to clear demand and supply drivers and to repeat in future updates.
Key Questions Answered in the Report
What is the projected size of the North America renewable aviation fuel market in 2031?
The market is forecast to reach USD 12.07 billion by 2031, expanding at a 41.08% CAGR over 2026-2031.
Which technology is growing fastest in the North America renewable aviation fuel industry?
Alcohol-to-jet pathways are expanding at a 45.89% CAGR through 2031, outpacing other conversion technologies.
How do U.S. federal incentives support SAF production?
Section 40B SAF Blenders Tax Credits provide up to USD 1.75 per gallon for fuels that cut lifecycle emissions by at least 50%, significantly improving project economics.
Why is the U.S. market dominant in North America renewable aviation fuel?
A combination of federal tax credits, state-level clean-fuel standards, and a dense airline network gives the United States 84.40% market share and drives a 48.64% CAGR.
What restrains faster growth of SAF in North America?
Feedstock aggregation challenges, competition for HEFA feedstocks with renewable diesel, and limitations on 100% SAF certification presently slow deployment.
Which application segment is witnessing the highest growth rate?
Cargo aviation shows the fastest growth, advancing at a 44.23% CAGR as logistics firms demand lower-carbon freight solutions.